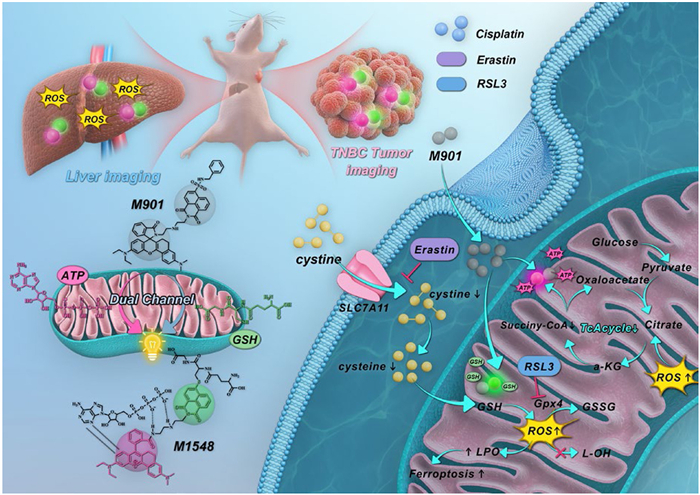
Scheme 1.
M901 visualizes energy metabolism pathways under oxidative stress associated with cancer treatment and liver injury.
Dual-activated fluorescent sensor visualizes energy metabolism pathways under ferroptosis-mediated oxidative stress relevant to cancer therapy
Jiao Lu , Bin Yang , Zhou Wu , Yong Li , Jun Wang , Ruihong Yao , Yanli Li , Zhihao Lu , Yufei Jiang , Fabiao Yu , Zhirong Geng , Zhilin Wang

Malignant tumors, characterized by uncontrolled cell proliferation and invasion, posing a significant threat to human survival [1–3]. Chemotherapy and surgical resection remain the primary treatment modalities for solid tumors [4–6]. Accurate monitoring of the tumor's status is crucial for assessing treatment efficacy and guiding optimization of treatment plans to improve survival rates [7]. In recent years, clinical imaging methods including X-rays, ultrasound (US), magnetic resonance imaging (MRI), and positron emission tomography-computed tomography (PET-CT) have made significant advancements in tumor localization [8–10]. However, these methods cannot provide real-time monitoring tumor progression or accurately distinguish tumor boundaries. Puncture biopsy is widely recognized as the clinical diagnostic "gold standard", but it carries a potential risk of tumor metastasis [11–13]. Therefore, there is an urgent need to develop a non-invasive method based on specific biomarkers for real-time monitoring of tumor progression.
Cancer cells sustain rapid proliferation through metabolic reprogramming, while their abnormally active biosynthetic demands significantly enhance their reliance on ATP and antioxidant systems [14–16]. Mitochondria, as the main site of ATP synthesis, generate substantial byproducts reactive oxygen species (ROS) during the process of energy production through oxidative phosphorylation [17–19]. Cancer cells maintain redox homeostasis to counteract the cytotoxicity of ROS by synthesizing glutathione (GSH) through solute carrier family 7 member 11 (SLC7A11)-mediated cystine (Cys) uptake, and utilizing glutathione peroxidase 4 (GPX4) to eliminate lipid peroxides [20–22]. Tumor cells effectively avoid programmed cell death pathways such as ROS induced ferroptosis while maintaining high proliferation activity [23–25]. Therefore, GSH and ATP could serve as potential biomarkers for detecting and evaluating the development status of tumors. Based on this, targeting the tumor antioxidant defense system (such as inhibiting SLC7A11 or GPX4) could disrupt the redox homeostasis, accurately monitor the specific compensation pathways of GSH and ATP, not only for studying the specific regulatory relationship between oxidative damage and energy blockade, but also provide new ideas for overcoming tumor drug resistance. Small molecule fluorescent probes have attracted wide-spread attention due to their advantages of excellent permeability, biocompatibility, non-invasiveness and real-time tracking of endogenous species [26–28]. The activatable sensor with multi-recognition sites eliminates false signals through specific multi biomarker activation and spatiotemporal consistency characteristics, enhancing detection accuracy and sensitivity, which is suitable for dynamic analysis of pathological mechanisms in complex diseases [29–31]. Currently, the development of several probes capable of simultaneously detecting ATP and reactive sulfur species (RSS) for synchronized imaging has provided critical tools for studying related pathological processes (Table S1 in Supporting information). These probes exhibit higher sensitivity and lower detection limits, but their detectable ranges are mostly confined to the micromolar range (µmol/L) [32–37]. The reported literatures indicate that the concentration of GSH/ATP in tumor cells are in mmol/L range [38–40]. Therefore, achieving mmol-level visualization imaging of ATP/GSH in biological systems is crucial for disease diagnosis and evaluation of therapeutic efficacy.
To meet the above requirements, the sulfonamide group was introduced into 1,8-naphthalimide and incorporated into the modified rhodamine lactam skeleton to synthesize a dual-sites probe M901 for independent detection of GSH and ATP without spectral crosstalk (peak separation is 155 nm) (Scheme 1). Upon activation by GSH and ATP, M901 exhibited of 15- and 700-fold fluorescence responses, respectively, the response range of M901 for GSH (0–7 mmol/L) and ATP (0–6.5 mmol/L) matching the physiological concentration fluctuations [38,39]. Based on this, the bidirectional regulatory relationship between energy imbalance induced by carbonyl cyanide 3-chlorophenylhydrazone (CCCP) and oxidative stress induced by L-buthionine sulfoximine (BSO) in tumor cells was visualized by M901. ATP synthesis inhibition↓ (energy imbalance) ↔ dysfunction of the electron transport chain ↔ ROS↑ ↔ depletion of GSH↓ (oxidative stress). Targeting the tumor antioxidant defense system (such as inhibiting SLC7A11 or GPX4) to disrupt redox homeostasis, the differential compensation mechanism of GSH/ATP was revealed for the first time. In addition, M901 revealed GSH depletion and ATP reduction are direct results of liver injury, and the therapeutic effect is positively correlated with the content of GSH/ATP. More importantly, M901 directly correlates metabolic regulation mechanisms with therapeutic effects by dynamically visualizing GSH/ATP in tumors. It could predict and evaluate the anti-tumor effects of different ferroptosis agents and cisplatin combination treatments, and the results showed that the therapeutic effect was positively correlated with the decrease in GSH/ATP concentration. Through dual-channel imaging, M901 guided precise resection of invasive malignant tumors (negative margin 0.2 mm). The M901 provides a multifunctional visualization tool for high-accuracy disease diagnosis, treatment efficacy evaluation, and precise surgical resection.
Designing GSH/ATP dual-responsive fluorescent probes must adhere to the following core principles: Spectrally resolvable dual-emissive fluorophores; non-emissive or weakly emissive in the absence of biomarkers; precise mitochondrial targeting capability. Rhodamine and 1,8-naphthalimide were selected as fluorophores. N,N-Dimethylbenzene was incorporated into the rhodamine skeleton to extend emission to the near-infrared range and avoid spectral crosstalk. A sulfonamide group was integrated into the 1,8-naphthalimide skeleton and combined with cyclorhodamine via diethylene triamine to construct probe M901 for GSH/ATP detection. The sulfonamide group suppresses the intramolecular charge transfer (ICT) of 1,8-naphthalimide, while spirocyclization disrupts the rhodamine π-conjugated region, placing M901 in a fluorescence-off state for both GSH and ATP channels. GSH cleaves the sulfonamide bond to generate a thiol substitute, restoring electron transfer in 1,8-naphthalimide and activating green fluorescence at 495 nm. ATP triggers a reversible non-conjugated-to-conjugated ring-opening transformation in the rhodamine derivative via synergistic hydrogen bonding and π-π stacking, activating near-infrared fluorescence at 650 nm. The two-channel fluorescence emission peaks differ by ~155 nm, eliminating spectral crosstalk. M901 was synthesized according to the synthetic route shown in Scheme S1 (Supporting information). M901 and its corresponding intermediates were well characterized by high-resolution mass spectrometry (electron spray ionization) (HRMS (ESI)) and 1H, 13C nuclear magnetic resonance spectra (NMR) (Figs. S31–S35 in Supporting information).
We systematically investigated the dual-channel optical response characteristics of M901 to GSH and ATP. In a phosphate buffered saline (PBS) containing 10% ethanol, the absorption spectra and concentration-dependent fluorescence spectra of M901 were measured by adding varying concentrations of GSH. As shown in Fig. 1A, a new absorption peak emerged at 398 nm. Simultaneously, under 450 nm excitation, the fluorescence intensity at 495 nm gradually increased with increasing GSH concentration (0–7 mmol/L), achieving a 15-fold fluorescence enhancement at 495 nm, which was attributed to the formation of nucleophilic substitution products mediated by GSH (Fig. 1B). The green fluorescence intensity at 495 nm exhibited a good linear relationship with GSH concentration (0.5–6.0 mmol/L), and the detection limit for GSH was calculated as 0.2 mmol/L (Fig. 1C). Subsequently, we evaluated the specificity of M901 for GSH recognition. As shown in Fig. S1A (Supporting information), in the presence of metal ions, ROS/RNS, or energy metabolism-related molecules alone, the fluorescence signal at 495 nm exhibited negligible enhancement. Notably, significant fluorescence enhancement effect was observed only when GSH was added, and this activation effect remained highly specific even after adding 1 mmol/L Cys (Fig. S2 in Supporting information).
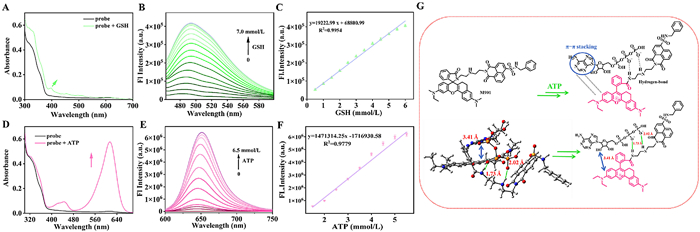
Next, we evaluated the response characteristics of M901 to ATP. As shown in Fig. 1D, upon incubation condition of 6.5 mmol/L ATP, the absorption spectrum showed a characteristic peak at 614 nm. Under 580 nm excitation wavelength, the near-infrared fluorescence at 650 nm showed a significant increase with a positive correlation to ATP concentration (0–6.5 mmol/L), achieving a steady-state signal amplification factor of 700-fold (Fig. 1E). The linear range of the detection system was 1.5–5.5 mmol/L, and the detection limit was 0.32 mmol/L. The selectivity test showed that M901 could specifically recognize ATP and was significantly distinguishable from ROS, RNS/RSS, and nucleoside polyphosphates (NPPS) (Fig. S1B in Supporting information). The above in vitro experiments confirmed the application potential of M901 in the field of ATP biosensing. In addition, in the GSH channel, adding 6.5 mmol/L ATP did not cause a noticeable change in fluorescence signal at 495 nm, whereas adding 7.0 mmol/L GSH significantly enhanced the emission peak, indicating no cross-response to ATP in this channel (Fig. S3A in Supporting information). In the ATP channel, adding 7.0 mmol/L GSH only weakly increased the 650 nm signal, while ATP addition robustly amplified the signal, confirming the channel's specificity for ATP (Fig. S3B in the Supporting information). The two channels are spectrally separated (495 nm vs. 650 nm), enabling independent detection of GSH and ATP and effectively avoiding spectral crosstalk. Under physiological pH conditions, M901 and its activated products with GSH and ATP demonstrate excellent stability (Figs. S4A and B in supporting information). After adding 7.0 mmol/L GSH, the fluorescence intensity at 495 nm reached its peak within 20 min, while with the addition of 6.5 mmol/L ATP, the fluorescence signal at 650 nm rapidly attained a stable maximum within 60 s (Figs. S5A and B in Supporting information). After reacting with GSH/ATP, the fluorescence intensity of M901 at 495 nm and 650 nm remained stable within 24 h (Figs. S6A and C in Supporting information). In a serum environment, both M901 itself and its reaction products demonstrated good stability (Figs. S6B and D in Supporting information).
To elucidate the reaction mechanism of M901 towards GSH/ATP, the Gaussian 16 program was employed to optimize the molecular geometries of M901 and its GSH/ATP-activated products. After GSH nucleophilic substitution, the energy gap between the highest occupied molecular orbital (HOMO) and the lowest unoccupied molecular orbital (LUMO) increased from 2.06 to 2.43 (Fig. S7 in Supporting information), which contradicts the experimental results showing longer absorption and emission wavelengths of the products post-reaction. We separately investigated the frontier orbitals of the two recognition units before and after the reaction. As shown in Fig. S8 A (Supporting information), in the GSH reaction unit, GSH attacks the sulfonamide site to generate an electron donor, reducing the HOMO-LUMO energy gap (3.92-3.27 eV) and promoting a red shift in the absorption band. HRMS detected a product peak (m/z) at 1037.4207 (calcd. for 1037.4226), confirming that GSH underwent nucleophilic attack on the 4th carbon atom of the 1,8-naphthalimide fluorophore (Figs. S9 and S10 in Supporting information). In the ATP recognition section, the addition of ATP reduced the bandgap from 3.80 eV to 2.62 eV, generating conjugation recovery-related absorption and emission "turn-on" characteristics (Fig. S8B in Supporting information). After adding ATP to the M901 solution, HRMS detected a new peak (m/z) at 1406.3579 (calcd. for 1406.3553), consistent with ATP-mediated formation of a hydrogen-bonded open-ring compound (Fig. S11 in Supporting information). Furthermore, optical results in Fig. S12 (Supporting information) showed that the fluorescence signal at 650 nm rapidly recovered upon adding apyrase (an enzyme hydrolyzing phosphate groups) to the M901+ATP solution, indicating hydrogen bond interactions between ATP and the probe. As shown in Fig. 1G, molecular docking calculations showed that M901 forms intramolecular hydrogen bonds between the phosphate group H atoms and diethylenetriamine group N atoms (distances of 1.73 and 2.02 Å), and the adenine backbone of ATP matches the spatial orientation of the rhodamine group (distance of 3.44 Å). Studies on the spatial configurations of other nucleoside polyphosphates probed by the probes found that GTP/CTP form hydrogen bonds with M901, but lack π-π stacking interactions due to spatial configuration mismatch (Fig. S13 in Supporting information). Additionally, the M901+ATP group exhibited distinct chemical shifts in both 31P signals and 1H NMR, indicating that the ATP-triggered near-infrared emission of M901 originated from the synergy of hydrogen bonding and π-π stacking interactions (Fig. S14 in Supporting information). HRMS (ESI) verification confirmed M901′s capability for simultaneous determination of GSH/ATP, with mass spectrometry analysis revealing a target product peak (m/z) at 1542.4131 (calcd. for 1542.4037) (Fig. S15 in Supporting information). The experimentally measured spectral overlap integral (J) between the M901+GSH donor and M901+ATP acceptor was 14.8 (Fig. S16 in Supporting information), below the effective Förster resonance energy transfer (FRET) threshold (J ≥ 30) [41,42], suggesting no resonance energy transfer occurred.
Based on the excellent performance of M901 in reacting with GSH/ATP in vitro, the feasibility for simultaneous imaging monitoring GSH and ATP in tumor cells was further evaluated. MTT assay demonstrated low cytotoxicity of M901 (Figs. S17A and B in Supporting information). Additionally, after continuous irradiation with 488/594 nm lasers for 60 min, the intracellular fluorescence intensity in both channels remained stable (Fig. S18 in Supporting information), indicating excellent optical stability of M901. Additionally, M901 enables dual-channel detection of intracellular GSH and ATP without spectral crosstalk. The green channel (λex = 488 nm, λem = 500–550 nm) and red channel (λex = 605 nm, λem = 620–700 nm) respectively captured endogenous fluorescence signals of GSH and ATP. The fluorescence intensity in channel 3 (λex = 488 nm, λem = 620–700 nm) was negligible (Fig. S19 in Supporting information), demonstrating excellent spectral independence of the dual-channel detection system. The Pearson coefficient between M901 and Mito-Tracker Green reached 0.932 (Fig. S20 in Supporting information), indicating its high mitochondrial targeting specificity. Mitochondrial GSH/ATP level differences could reflect cellular metabolic characteristics. M901 was incubated with different cell lines, as shown in Figs S21A and B (Supporting information), compared to LX2 normal cell lines, other cancer cell lines demonstrated significant signal increases in both metabolic pathways. Commercial detection kits further validated the overexpression of GSH/ATP concentrations in cancer cell lines (Fig. S21C in Supporting information). This discovery reveals that cancer cells maintain high metabolic demands through enhanced oxidative and energy metabolic pathways, while M901 probes enable effectively distinguish metabolic differences between normal and cancer cells as metabolic tracking tools.
Based on the high-precision imaging of cellular GSH/ATP using probe M901, we analyzed their correlation under different incubation conditions. Experimental findings revealed that exogenous addition of either GSH or ATP enhanced the dual-channel signal intensity, and the results were verified by commercial kit (Figs. S22A–C in Supporting information). ATP synthesis inhibitor oligomycin A (Omy A) and GSH synthesis inhibitor BSO were used to investigate the endogenous levels of GSH or ATP in cells [43]. As shown in Figs. S23A–C (Supporting information), cells treated with Omy A exhibited ATP/GSH fluorescence intensities that were 0.32- and 0.467-fold of the control group, and endogenous ATP and GSH concentrations were reduced to 0.7 and 2.2 mmol/L respectively. Upon addition of exogenous ATP, the red fluorescence significantly increased while the green fluorescence partially recovered. After treatment with BSO, the fluorescence of GSH was significantly reduced, and the ATP signal also partially decreased. After supplementation with 5 mmol/L glutathione monoethyl ester (GSH-MEE), the fluorescence in both channels was partially restored. The above results show that energy imbalance induced by Omy A and oxidative stress induced by BSO could both significantly regulate the dynamic balance between GSH and ATP.
Next, we further verified the regulatory relationship of endogenous GSH/ATP under cellular oxidative stress and energy imbalance. As shown in Figs. S23D–F (Supporting information), after pre-treatment with H2O2, the fluorescence intensity of GSH and ATP decreased to 0.288- and 0.312-fold of the control group respectively, and the endogenous GSH and ATP concentrations decreased to 2.0 and 1.03 mmol/L, indicating significant depletion of GSH and notable inhibition of ATP in cells under oxidative stress. Upon supplementation with the GSH synthesis substrate N-acetyl-L-cysteine (NAC), the fluorescence signals of GSH and ATP were restored [44,45]. After co-incubation with the oxidative phosphorylation uncoupling agent CCCP [46], tumor cells exhibited significant inhibition in both red and green channels, indicating significant depletion of GSH and ATP in cells under energy imbalance. Meanwhile, treatment with NAC pro-moted the recovery of GSH/ATP fluorescence intensity. M901 visualized the bidirectional regulatory relationship between energy imbalance and oxidative stress by tracking GSH/ATP, ATP synthesis inhibition↓ (energy imbalance) ↔ electron transport chain dysfunction ↔ ROS↑ ↔ GSH depletion↓ (oxidative stress). Therefore, achieving energy blockade in tumor cells by regulating oxidative stress may be a feasible anti-cancer strategy.
We first explored the dynamic regulation mechanism of GSH/ATP under erastin incubation [47]. As shown in Figs. 2A–C, within 0–6 h, the fluorescence intensity of GSH in tumor cells decreased with time, while the ATP fluorescence signal increased slightly. Subsequently, within 9–24 h, the fluorescence intensity of the GSH/ATP channel continued to decrease, and the cell morphology was significantly damaged or even ruptured (Fig. 2D). The experimental results were verified by commercial kits (Fig. S24A in Supporting information). Erastin inhibits the Cys transporter SLC7A11, blocking GSH synthesis and causing redox imbalance and ROS burst, ultimately leading to lipid peroxidation accumulation. In the initial phase, ROS transiently activate mitochondrial membrane potential to promote ATP synthesis. However, subsequent mitochondrial damage, metabolic collapse, and sustained ROS accumulation result in energy depletion.
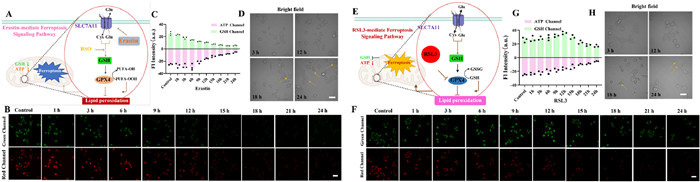
Next, we studied the GSH/ATP compensation mechanism under (1S,3R)-RSL3 (RSL3) incubation [48]. As shown in Figs. 2E–H, within 0–12 h, the fluorescence signal of ATP slightly weakened, while the fluorescence signal of GSH showed an up-ward trend. Within 12–24 h, the GSH level decreased and finally stabilized at a certain level, while ATP was depleted. The experimental results were verified by commercial kits (Fig. S24B in Supporting information). Inhibition of GPX4 does not block Cys uptake, and GSH precursors can still be temporarily supplemented. Under these conditions, cells consume ATP to maintain metabolic balance. GSH becomes irreversibly depleted due to direct neutralization of ROS, while mitochondrial damage leads to metabolic collapse, ultimately triggering cell death. Thus, M901 provides a real-time tracking of the concentration changes of ROS and GSH, elucidating the compensatory-collapse relationship between oxidative stress and metabolism.
All surgical procedures and experimental protocols were approved by the Animal Care and Use Committee of Hainan Medical University (No. HYLL-2021–184). Blood routine examination and hematoxylin and eosin (H&E) staining analysis of healthy mice injected with M901 showed no significant abnormalities, indicating the low toxicity and good biocompatibility of the probe (Figs. S25 and S26 in Supporting information). Acetaminophen (APAP) overdose induces hepatic oxidative stress and causes liver injury, its antidote 1-aminobenzotriazole (ABT) exerts hepatoprotective effects by inhibiting cytochrome P450 metabolic pathways [49]. We first validated the capability of probe M901 to track GSH/ATP dynamics in APAP-induced liver injury mice. C57 mice were administered 300 mg/kg APAP via intraperitoneal injection to establish liver injury models, followed by intravenous injection of M901 (100 µL, 0.5 mmol/L) via the tail vein for dual-channel fluorescence imaging, and the ABT-treated group served as the repair group. The GSH/ATP fluorescence intensities in the APAP group decreased to 0.58- and 0.61-fold of the control group, while ABT treatment restored GSH/ATP levels to 1.35-fold and 1.42-fold of the APAP group (Figs. S27A–C in Supporting information). Ex vivo liver tissue imaging results were consistent with in vivo imaging findings (Figs. S27D and E in Supporting information). H&E staining analysis of liver tissues confirmed high proportions of patchy hepatocyte necrosis in injured livers, which could be alleviated by ABT intervention (Fig. S27F in Supporting information). The above results indicate that M901 enables real-time detection of liver injury by tracking in vivo GSH/ATP fluctuations, positioning it as a promising tool for anti-liver drug screening.
Tumor cells rely on abnormally high levels of GSH and ATP to maintain proliferative activity and evade programmed death, so we investigated the enhanced anticancer efficacy of energy imbalance induced by GSH depletion under cisplatin (CDDP) treatment by targeting the antioxidant system. 4T1 cells were subcutaneously injected into the right axilla of nude mice. Eight days later, tumor-bearing mice were randomly divided into four groups treated with PBS, CDDP, erastin+CDDP, or RSL3+CDDP. GSH/ATP signaling was monitored using M901 to analyze tumor burden. As shown in Figs. S28A–C (Supporting information), after tail vein injection, the probe was continuously enriched in tumor tissues through the enhanced permeability and retention effect (EPR). However, passive diffusion in systemic circulation caused strong signal interference in the liver and kidneys. In contrast, the signal intensity of intratumoral M901 injection reached its peak within 45 min (Fig. 3A). Considering imaging timeliness, local drug concentration, and signal interference factors, the intratumoral injection was ultimately selected as the optimal administration route for efficacy evaluation. As shown in Fig. 3A, the PBS group exhibited the strongest red and green fluorescent signals, while the intensities in the purple channel for CDDP, erastin+CDDP, and RSL3+CDDP treatment groups was 0.517-, 0.203-, and 0.183-fold that of the control group, and the signal intensities in the red channel was 0.483-, 0.224-, and 0.148-fold, respectively (Figs. S29A-1 and B-1 in Supporting information). The combination therapy of RSL3 and CDDP showed the best efficacy in tumor growth inhibition, exhibiting lower expressions of GSH and ATP (Figs. S29A-2 and B-2 in Supporting information). Tumors were collected after the treatment, as shown in the Figs. S29C-1 and C-2 (Supporting information), the tumor volume in the combination therapy group was reduced to 19.74% and 10.51% of the control group, significantly suppressing tumor growth, and consistent with fluorescence imaging results. The mice treated with combination drug therapy showed no significant body weight loss, demonstrating lower acute toxicity along with superior biocompatibility and anticancer activity (Fig. S29D in Supporting information). The survival time of the GSH-inhibition-assisted cisplatin treatment group was significantly longer than the other groups (Fig. S29E in Supporting information). Fluorescence imaging of tissue sections showed that the signal intensity of the RSL3+CDDP group was the lowest, which was 0.117- and 0.096-fold that of the control group in two channels, respectively, which were consistent with the results of in vivo imaging (Figs. S30A–C in Supporting information). As shown in Fig. 3B, the histological changes of collected tumor tissues were evaluated using H&E staining, showing the most severe tissue damage in the RSL3+CDDP group with negligible damage in the control group. Tumor cell proliferation and differentiation were assessed by detecting Ki67 protein expression, which was almost absent in the RSL3+CDDP group, indicating strong inhibitory effects of the combination therapy on tumor cell growth. The terminal deoxynucleotidyl transferase (TdT) dUTP nick-end labeling (TUNEL) assay further confirmed that GSH inhibition augmented by cisplatin induced massive apoptotic cells throughout the tumor tissue. These experimental results suggest that the GSH/ATP content is negatively correlated with the therapeutic effect. M901 could evaluate the tumor treatment effect and predict the results in real time by monitoring GSH/ATP.
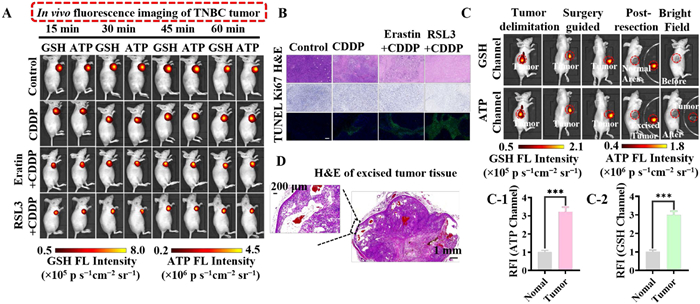
Currently, for early-stage solid tumors without metastasis, surgery is the cornerstone of curative treatment; however, the invasive growth characteristics of tumor cells blur the boundaries between the tumor and normal tissues. In traditional surgeries, micro-invasive foci (such as <5 mm) are difficult to accurately locate macroscopically, potentially leading to residual margins. To enhance the accuracy of fluorescence-guided tumor resection, we attempted dual-channel fluorescence-guided surgery using a dual-responsive turn-on probe with a good signal-to-noise ratio, exploring the effectiveness of dual fluorescence channel surgical navigation. Following injection of the probe, tumors could be accurately distinguished from surrounding normal tissues and successfully removed under NIR fluorescence guidance (Fig. 3C). Additionally, under real-time image guidance, the relative fluorescence intensity (RFI) between the resected tumor and adjacent normal tissues was observed to be 3.774- and 4.09-fold, respectively (Figs. 3C-1 and C-2). Subsequently, the excised specimens were stained with H&E for pathological diagnosis, and H&E staining analysis confirmed the reliability of our probe in tumor resection, reducing the residual negative margin diameter to approximately 0.2 mm (Fig. 3D). The probe M901 enables precise localization of tumor boundaries and provides effective assistance in tumor navigation through high-specificity NIR-I imaging.
In summary, we synthesized a dual-site probe M901 to simultaneously detect GSH and ATP in mitochondria without spectral overlap (peak difference 155 nm), and the response range matching the fluctuation range of physiological concentrations of GSH (0–7 mmol/L) and ATP (0–6.5 mmol/L) in tumor cells. The excellent performance of M901 for GSH and ATP in vitro enables it to visualize the bidirectional regulatory relationship between CCCP-stimulated energy imbalance and BSO-stimulated oxidative stress in tumor cells. Based on this, M901 first revealed the differential compensation mechanism of GSH and ATP under the disruption of the antioxidant defense system of tumor cells (such as inhibition of SLC7A11 or GPX4). More importantly, by tracking GSH/ATP, M901 enable predict and evaluate the anti-tumor efficacy of different ferroptosis-inducing drugs in combination with cisplatin, and successfully guide the precise resection of 0.2 mm invasive tumors. M901 has potential as a clinical visualization tool for diagnosing, treating and monitoring a variety of diseases.
The authors declare that they have no known competing financial interests or personal relationships that could have appeared to influence the work reported in this paper.
Jiao Lu: Writing – original draft, Software, Project administration. Bin Yang: Validation, Software. Zhou Wu: Validation, Software. Yong Li: Validation, Software. Jun Wang: Data curation. Ruihong Yao: Data curation. Yanli Li: Data curation. Zhihao Lu: Data curation. Yufei Jiang: Methodology. Fabiao Yu: Writing – review & editing, Supervision. Zhirong Geng: Writing – review & editing, Supervision. Zhilin Wang: Supervision, Funding acquisition, Conceptualization.
The authors greatly appreciate the financial support from the National Natural Science Foundation of China (No. U2341290).
Supplementary material associated with this article can be found, in the online version, at doi:
N.N. Pavlova, C.B. Thompson, Cell Metab. 23 (2016) 27–47. doi: 10.1016/j.cmet.2015.12.006
L.K. Boroughs, R.J. DeBerardinis, Nat. Cell Biol. 17 (2015) 351–359. doi: 10.1038/ncb3124
R.J. DeBerardinis, N.S. Chandel, Sci. Adv. 2 (2016) e1600200. doi: 10.1126/sciadv.1600200
L.L. Bu, J. Yan, Z. Wang, et al., Biomaterials 219 (2019) 119182. doi: 10.1016/j.biomaterials.2019.04.027
D.J. Sugarbaker, J. Thorac. Oncol. 1 (2006) 175–176. doi: 10.1097/01243894-200602000-00014
X. Qu, D. Zhou, J. Lu, et al., Bioact. Mater. 24 (2023) 136–152.
Y.T. Tsai, J. Schlom, R.N. Donahue, J. Exp. Clin. Cancer Res. 43 (2024) 82. doi: 10.1186/s13046-024-02969-1
K.A. Caprio, A.B. Chagpar, R. Hooley, et al., J. Clin. Oncol. 30 (2012) 1109. doi: 10.1200/jco.2012.30.15_suppl.1109
C. Bund, C. Heimburger, A. Imperiale, et al., Clin. Nucl. Med. 42 (2017) 250–257. doi: 10.1097/RLU.0000000000001540
Y. Abboud, A. Shah, R. Sutariya, et al., JAMA Oncol. 11 (2025) 345–349. doi: 10.1001/jamaoncol.2024.5937
S. He, P. Cheng, K. Pu, Nat. Biomed. Eng. 7 (2023) 281–297. doi: 10.1038/s41551-023-01009-1
C. Ungari, F. Filiaci, E. Riccardi, A. Agrillo, Ann. Rheum. Dis. 75 (2016) 28.
C. Galisteo, M. Garcia Manrique, J. Calvet, et al., Ann. Rheum. Dis. 75 (2016) 1056–1057.
Y. Liu, Y. Zhao, H. Song, et al., Cancer Lett. 597 (2024) 217076. doi: 10.1016/j.canlet.2024.217076
K. Fekir, H. Dubois-Pot-Schneider, R. Désert, et al., Cancer Res. 79 (2019) 1869–1883. doi: 10.1158/0008-5472.can-18-2110
H.E. Greenwood, P.N. McCormick, T. Gendron, et al., Clin. Cancer Res. 25 (2019) 2471–2482. doi: 10.1158/1078-0432.ccr-18-3423
M.O. Breckwoldt, F.M.J. Pfister, P.M. Bradley, et al., Nat. Med. 20 (2014) 555–560. doi: 10.1038/nm.3520
M. Ristow, M.F. Pfister, A.J. Yee, et al., Proc. Natl. Acad. Sci. U. S. A. 97 (2000) 12239–12243. doi: 10.1073/pnas.220403797
S.J. Lee, Y. Jin, H.Y. Yoon, et al., Br. J. Pharmacol. 145 (2005) 469–476. doi: 10.1038/sj.bjp.0706206
V.D.B. Bonifácio, S.A. Pereira, J. Serpa, J.B. Vicente, Br. J. Cancer 124 (2021) 862–879. doi: 10.1038/s41416-020-01156-1
I.I.C. Chio, D.A. Tuveson, Trends Mol. Med. 23 (2017) 411–429.
H. Sato, M. Tamba, T. Ishii, S. Bannai, J. Biol. Chem. 274 (1999) 11455–11458. doi: 10.1074/jbc.274.17.11455
P. Koppula, L. Zhuang, B. Gan, Protein Cell 12 (2021) 599–620. doi: 10.1007/s13238-020-00789-5
G. Lei, L. Zhuang, B. Gan, Nat. Rev. Cancer 22 (2022) 381–396. doi: 10.1038/s41568-022-00459-0
L. Jiang, N. Kon, T. Li, et al., Nature 520 (2015) 57–62. doi: 10.1038/nature14344
R. Zhang, Y. Zhou, Y. Lu, et al., Chin. Chem. Lett. 37 (2026) 111144. doi: 10.1016/j.cclet.2025.111144
H. Zhang, K. Feng, G. Li, et al., Chin. Chem. Lett. 37 (2026) 111047. doi: 10.1016/j.cclet.2025.111047
K. Dou, J. Lu, Y. Xing, et al., Angew. Chem. Int. Ed. 64 (2025) e202419191. doi: 10.1002/anie.202419191
Z. Wu, M. Liu, Z. Liu, Y. Tian, J. Am. Chem. Soc. 142 (2020) 7532–7541. doi: 10.1021/jacs.0c00771
J. Liu, W. Zhang, X. Wang, et al., J. Am. Chem. Soc. 145 (2023) 19662–19675. doi: 10.1021/jacs.3c04303
H.Yan Y.Wang, Y. Yue, et al., Chem. Eng. J. 464 (2023) 142496. doi: 10.1016/j.cej.2023.142496
W. Lang, Z.W. Wu, J. Li, Y. Chen, Q.Y. Cao, Sens. Actuat. B: Chem. 412 (2024) 135772.
T. Yu, Y. Li, J. Li, et al., Adv. Sci. 12 (2025) 2415882. doi: 10.1002/advs.202415882
J.M. Qin, X. Li, W. Lang, F.H. Zhang, Q.Y. Cao, Chin. Chem. Lett. 35 (2024) 108925.
S.L. Wen, W. Lang, X. Li, Q.Y. Cao, Talanta 271 (2024) 125739.
P. Sun, H.C. Chen, S. Lu, et al., Anal. Chem. 94 (2022) 11573–11581. doi: 10.1021/acs.analchem.2c01850
X. Yang, P. Xie, J. Liu, et al., Chem. Eng. J. 442 (2022) 136141.
K. Umezawa, M. Yoshida, M. Kamiya, T. Yamasoba, Y. Urano, Nat. Chem. 9 (2017) 279–286. doi: 10.1038/nchem.2648
T.B. Ren, S.Y. Wen, L. Wang, et al., Anal. Chem. 92 (2020) 4681–4688. doi: 10.1021/acs.analchem.0c00506
N. Li, T. Wang, N. Wang, M. Fan, X. Cui, Angew. Chem. Int. Ed. 62 (2023) e202217326.
L. Wu, C. Huang, B.P. Emery, et al., Chem. Soc. Rev. 49 (2020) 5110–5139. doi: 10.1039/c9cs00318e
L. Yuan, W. Lin, K. Zheng, S. Zhu, Acc. Chem. Res. 46 (2013) 1462–1473. doi: 10.1021/ar300273v
L. Wu, J. Liu, X. Tian, et al., J. Am. Chem. Soc. 144 (2022) 174–183.
S.A. Cate, T. Ozpolat, J. Chen, et al., Blood 124 (2014) 2662 -2662.
H. Gao, L. Sun, J. Li, et al., Adv. Sci. 10 (2023) 2303926.
J. Lu, K. Dou, Z.R. Geng, Z.L. Wang, Sens. Actuators B: Chem. 390 (2023) 134043.
Q. Huang, Y. Ru, Y. Luo, et al., Sci. Adv. 10 (2024) eadk1200.
D.M. Cheff, C. Huang, K.C. Scholzen, et al., Redox Biol. 62 (2023) 102703.
L. Shangguan, J. Wang, X. Qian, Y. Wu, Y. Liu, Anal. Chem. 94 (2022) 11881–11888. doi: 10.1021/acs.analchem.2c02431

Scheme 1 M901 visualizes energy metabolism pathways under oxidative stress associated with cancer treatment and liver injury.

Figure 1 Optical properties of M901 (10 µmol/L) toward GSH and ATP in PBS buffer (10 mmol/L, pH 7.4, 10% EtOH). (A) Absorption spectra of M901 in the absence and presence of GSH (7.0 mmol/L). (B) Fluorescence spectrum of M901 (10 µmol/L) upon addition of GSH (0–7 mmol/L). (C) Linear correlation between the fluorescence intensity of M901 at 495 nm with various GSH. (D) UV–vis absorption spectra of M901 in the absence and presence of ATP (6.5 mmol/L). (E) Fluorescence spectrum of M901 (10 µmol/L) upon addition of ATP (0–6.5 mmol/L). (F) Linear correlation between the fluorescent intensity of M901 at 650 nm after treatment with ATP. The data are expressed as the mean ± SD (n = 3). (G) Molecular docking calculations of M901 in the presence of ATP. The hydrogen bond interaction is denoted by green lines, and the π-π stacking interaction is denoted by a blue line. Carbon, hydrogen, oxygen, nitrogen, and phosphorus atoms are colored with gray, white, red, blue and orange, respectively.

Figure 2 Imaging of the GSH and ATP changes under different ferroptosis pathways within 24 h. (A) Schematic of intracellular cascade signaling pathway during erastin-induced ferroptosis. (B) Dynamic visualization of GSH (green channel: λex = 488 nm, λem = 500–550 nm) and ATP (red channel: λex = 594 nm, λem = 620–700 nm) within 24 h of incubation with erastin (10 µmol/L). (C) Relative pixel intensity of (B). (D) Bright-filed and cell morphology changes as represented in panel (B). (E) Schematic of intracellular cascade signaling pathway during RSL3-induced ferroptosis. (F) Dynamic visualization of GSH and ATP within 24 h of incubation with RSL3 (1 µmol/L). (G) Relative pixel intensity of (F). (H) Bright-filed and cell morphology changes as represented in panel (F). The data are expressed as the mean ± SD (n = 3). Scale bar: 20 µm.

Figure 3 Antitumor effect of different treatment regimens on primary triple negative breast cancer (TNBC) model. (A) Dynamic fluorescence imaging of GSH (λex = 488 nm, λem = 500–550 nm) and ATP (λex = 605 nm, λem = 620–700 nm) after intratumoral injection of M901 (100 µL, 0.5 mmol/L). (B) Images of tumor tissue section stained with H&E, Ki67, and TUNEL in different groups. Scale bar: 100 µm. (C) NIR-I image-guided subcutaneous tumor resection. (D) H&E staining images of excised tumor tissue. Scale bar: 1 mm, 200 µm. (C1, C2) RFI of excised tumor. The data are expressed as the mean ± SD (n = 3). ***P < 0.001.

 扫一扫看文章

扫一扫关注我们
 DownLoad:
 下载:
下载:
 下载:
下载: