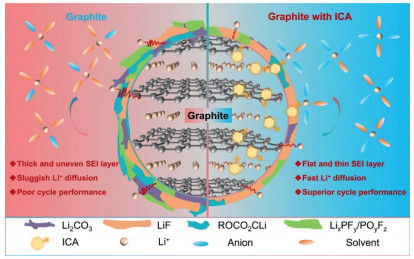
Scheme 1.
Schematics showing the evolution process of Gr and SO3Li-modified Gr anode during charging.

SO3Li-grafted ion-conducting agents for graphite-based lithium-ion batteries with extended cycle life
Shijie Liao , Dongming Cheng , Xinyan Xu , Qiyue Li , Shengzhe Xu , Jianchao Zhang , Helei Wei , Ying Wei , Qi Li , Kai Li , Zihan Long , Yuanyuan Luo , Yunhui Huang , Mingfeng Tan , Bo Lin , Henghui Xu


Lithium-ion batteries (LIBs) are critical energy storage and power supply devices in electric vehicles and large-scale energy storage systems [1–4]. Graphite is the most commonly used anode material in LIBs due to its high theoretical capacity (372 mAh/g), excellent electrical conductivity, low lithium intercalation potential, and mature manufacturing process [5,6]. Despite these advantages, the practical application of graphite anodes is hindered by several inherent limitations [7,8]. During repeated lithiation and delithiation cycles, the SEI layer on the graphite surface is prone to rupture, compromising its ability to act as a stable barrier between the electrode and electrolyte. The instability of the SEI leads to continuous electrolyte decomposition, increased internal resistance, and the depletion of active lithium, ultimately reducing the battery's cycle life. Moreover, the organic-rich SEI layer typically exhibits poor ionic conductivity, further slowing lithium-ion transport [9–12].
To address these challenges, various strategies have been explored to improve the performance of graphite anodes [13–16]. Nanostructured graphite, for example, increases the number of lithium-ion diffusion channels and active sites, while heteroatom doping, such as nitrogen doping, enhances electronic conductivity and lithium-ion adsorption [17–24]. However, these methods often involve high costs, complex processes, and challenges in scalability, limiting their use in practical applications [25,26].
Recently, ion-conducting agents (ICAs) functionalized with specific chemical groups have emerged as a promising approach to optimize lithium-ion transport at the electrode/electrolyte interface [27]. ICAs can improve the ionic conduction environment while maintaining the intrinsic properties of graphite [28]. Several functionalized ICAs have shown potential for enhancing graphite anodes, but they also come with drawbacks. For instance, carboxyl-functionalized ICAs are sensitive to moisture, which reduces their stability and lithium-ion conductivity. Similarly, amino-functionalized ICAs can react with electrolyte components, generating harmful by-products that increase internal resistance [29–32].
In this study, we introduce a graphene-based ICA functionalized with lithium sulfonate groups (–SO3Li) to overcome the limitations of graphite anodes in LIBs (Scheme 1). The –SO3Li groups regulate the Li+ solvation structure by creating an anion-rich coordination environment through anion-solvent dipole interactions. This unique solvation structure promotes the preferential decomposition of PF6− anions, leading to the formation of a stable, LiF-rich SEI layer. As a result, lithium-ion transport kinetics are significantly improved, interfacial resistance is reduced, and the cycling stability of the graphite anode is enhanced. Furthermore, the ICA mitigates mechanical strain within the anode during cycling, improving its structural integrity over long-term operation. A 3 Ah Gr||LiFePO4 pouch cell incorporating this functionalized ICA demonstrates excellent cycling performance, retaining 86.4% of its capacity after 1200 cycles at 1 C. This work highlights the potential of functionalized ICAs, such as –SO3Li-grafted graphene, as a practical and scalable method to address the intrinsic limitations of graphite and develop high-performance, long-life LIBs for advanced energy storage applications.
The ion-conducting agent (ICA) with –SO3Li groups was successfully synthesized by grafting lithiated sulfonic acid groups onto graphene (Fig. S1 in Supporting information). The structural and chemical properties of ICA were systematically characterized to confirm the successful functionalization. X-ray diffraction (XRD) analysis (Fig. 1a) reveals a broad peak at 25.8°, corresponding to the (002) crystalline plane of carbon materials, indicative of a sp² hybridized two-dimensional network structure. The presence of amorphous carbon in the pattern likely arises from mesoscale conformational fluctuations, consistent with the characteristics of covalent organic polymers [33]. Raman spectroscopy further supports this structural analysis. As shown in Fig. 1b, the D peak at 1375 cm–1 indicates disordered or amorphous carbon, while the G peak at 1577 cm–1 reflects the presence of aromatic rings, confirming the graphitic nature of the ICA [34]. The successful grafting of –SO3Li groups onto graphene was confirmed using Fourier-transform infrared (FT-IR) spectroscopy (Fig. 1c and Fig. S2 in Supporting information). Characteristic peaks at 658.1, 1063.6, and 1257.4 cm–1 correspond to the stretching vibrations of C—S, S—O, and S═O bonds, respectively [35].
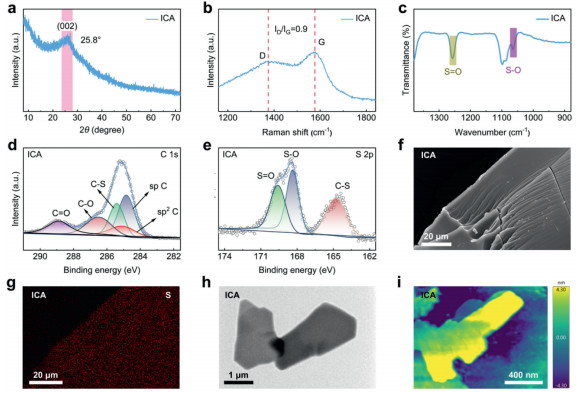
X-ray photoelectron spectroscopy (XPS) provided further evidence of functionalization. In the C 1s spectrum (Fig. 1d), a peak at 285.8 eV is attributed to C–S bonds, while the S 2p spectrum (Fig. 1e) shows peaks corresponding to S—C (164.8 eV), S═O (168.4 eV), and S—O (169.6 eV). Additionally, the Li 1s spectrum (Fig. S3 in Supporting information) exhibits a characteristic peak at 56.0 eV, assigned to Li—O bonds, further confirming the presence of –SO3Li groups [36,37]. To investigate the microstructure of ICA, multiple imaging techniques were employed. Scanning electron microscopy (SEM) images (Fig. 1f) reveal a layered structure, while energy-dispersive X-ray spectrometry (EDS) elemental mapping (Fig. 1g and Fig. S4 in Supporting information) confirms the uniform distribution of oxygen (O) and sulfur (S) throughout the material. Transmission electron microscopy (TEM) images (Fig. 1h and Fig. S5 in Supporting information) further highlight the two-dimensional lamellar morphology, consistent with the results from atomic force microscopy (AFM) (Fig. 1i and Fig. S6 in Supporting information). Collectively, these results confirm the successful synthesis of the ICA with a well-defined layered structure and uniform functionalization of –SO3Li groups.
To determine the optimal concentration of the ion-conducting agent (ICA) in graphite anodes, a series of gradients (0%, 0.1%, 0.2%, 0.3%, 0.5%, and 1.0%) were prepared, with the corresponding anodes labeled as Gr, Gr-0.1ICA, Gr-0.2ICA, Gr-0.3ICA, Gr-0.5ICA, and Gr-1.0ICA, respectively. The SEM images (Fig. S7 in Supporting information) confirm a uniform distribution of slurry components on the electrode surface, although the low ICA concentration makes it difficult to distinguish individual ICA particles. The electrochemical performance of these anodes was evaluated using Li||Gr half-cells. As shown in Fig. 2a, the Gr-0.2ICA anode delivers superior specific capacities at various charge-discharge rates, reaching 375.7, 357.8, 318.7, 289.6, 222.0, and 158.9 mAh/g at 0.1, 0.25, 0.5, 0.75, 1, and 2 C rates, respectively. These values are significantly higher than those of other ICA concentrations and pristine graphite (Gr). Furthermore, the Gr-0.2ICA anode demonstrates excellent reversibility, recovering to 366.8 mAh/g when the rate is returned to 0.1 C. In contrast, the pristine Gr anode delivers only 100.8 mAh/g at 2 C, highlighting its inferior rate performance. Cycling performance at 1 C (Fig. 2b) further supports the effectiveness of ICA. After 200 cycles, the Gr-0.2ICA anode retains a specific capacity of 325.4 mAh/g, significantly surpassing the 254.2 mAh/g retention of the pristine Gr anode. The electrochemical activation process observed during the initial 50 cycles is characteristic of graphite-based systems, where the electrode requires this stabilization period to establish optimal interfacial conditions for sustained performance [38,39]. Additionally, constant-current discharge profiles (Fig. 2c) show that the Gr-0.2ICA anode exhibits the lowest polarization potential, confirming improved rate capability, cycling stability, and reduced overpotential.
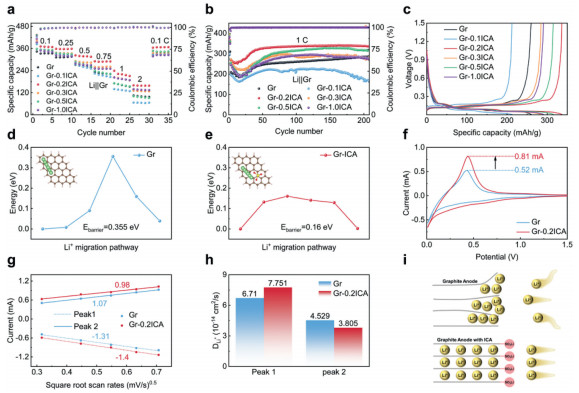
To understand the mechanism behind these improvements, 0.2% ICA concentration was selected as the optimal value for further investigation. The energy barriers for Li+ diffusion in pristine graphite (Gr) and ICA-modified graphite (Gr–ICA) were calculated (Figs. 2d and e) [40]. The Gr–ICA anode exhibits a significantly reduced energy barrier of 0.16 eV compared to 0.355 eV for pristine Gr, enabling faster Li+ transfer across the graphite electrode. Cyclic voltammetry (CV) analysis (Fig. 2f) shows that the peak current of Gr-0.2ICA (0.81 mA) is notably higher than that of pristine Gr (0.52 mA), reflecting enhanced reaction kinetics [41]. Further CV analysis at varying scan rates (Figs. 2g and h, Fig. S8 in Supporting information) provides insight into lithium-ion diffusion behavior. During lithiation, the slope of oxidation peak 1 for Gr-0.2ICA cells is –1.4, higher than the –1.31 observed for pristine Gr cells, indicating improved Li+ transport. The corresponding lithium-ion diffusion coefficient for peak 1 in Gr-0.2ICA cells is 7.75 × 10⁻¹⁴ cm2/s, significantly higher than that of pristine Gr. This enhancement is attributed to the reduced Li+ diffusion barrier facilitated by ICA, which ensures uniform lithium-ion flux within the graphite structure. In contrast, during delithiation, the slope of peak 2 for Gr-0.2ICA cells is slightly lower (0.98) than that of pristine Gr cells (1.07), with a lithium-ion diffusion coefficient of 3.81 × 10⁻¹⁴ cm2/s. This suggests that pristine Gr cells exhibit a slightly higher Li+ diffusion rate during delithiation, likely due to lithium-ion accumulation at the graphite edges in the absence of ICA.
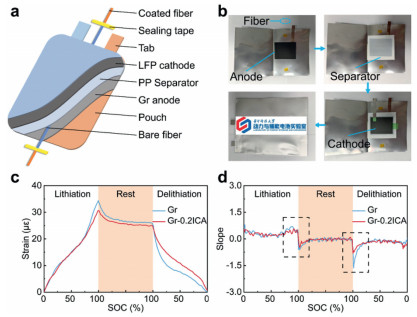
The observed behavior can be explained as follows: During lithiation, pristine graphite suffers from sluggish Li+ diffusion, leading to lithium-ion accumulation at the edges and hindering further insertion into the bulk (Fig. 2i). ICA effectively mitigates this issue by lowering the diffusion barrier and enabling more uniform Li+ transport. During delithiation, accumulated lithium ions in pristine graphite edge rapidly migrate to the positive electrode, resulting in a higher apparent diffusion coefficient but also causing greater strain and uneven ion flux. To verify these findings, strain generated during lithiation and delithiation was monitored in Gr||LiFePO4 (Gr||LFP) pouch cells using embedded optical fibers as in-situ sensors by our group (Figs. 3a and b) [42–44]. The strain profiles of the graphite anode at different states of charge (SOC) are shown in Fig. 3c, with the strain rate of change determined by the slopes of the curves (Fig. 3d). The results reveal that the strain generated by the Gr-0.2ICA anode is significantly lower than that of the pristine Gr anode. This reduction in strain can be attributed to the enhanced reaction kinetics of lithium ions facilitated by the –SO3Li functional groups in ICA, which mitigate stress accumulation during cycling. In contrast, the sluggish Li+ transfer in the pristine Gr anode leads to a significant accumulation of lithium ions at the graphite edges, resulting in higher strain and impeding Li+ migration into the graphite bulk. Consequently, during the delithiation process, a large number of lithium ions are rapidly released from the edges of the pristine Gr anode, leading to a significantly higher strain reduction rate compared to the Gr-0.2ICA anode These findings are consistent with the results obtained from CV tests.
XRD analysis of the graphite anodes before and after cycling (Fig. 4a) reveals key insights into structural changes. The (002) peak of the pristine Gr anode shifts from 26.5° to 26.8°, indicating a reduction in the interlayer spacing of graphite sheets. This shift is attributed to stress accumulation caused by sluggish lithium-ion transport during cycling, which leads to graphite pulverization. In contrast, the (002) peak of the Gr-0.2ICA anode remains unchanged after cycling, demonstrating that ICA effectively enhances lithium-ion transport, alleviates stress associated with lithiation/delithiation, and maintains optimal interlayer spacing. These effects collectively improve lithium-ion transport and contribute to enhanced electrochemical performance and structural stability.
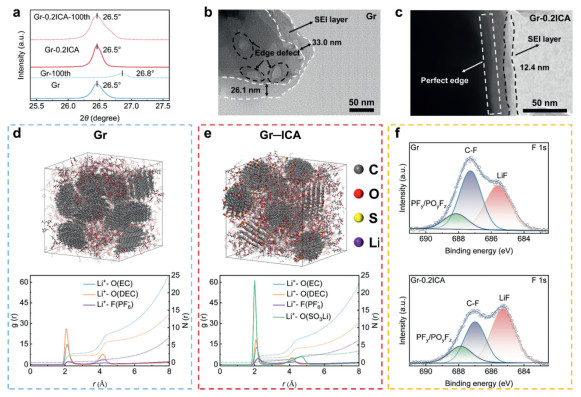
The SEM images (Fig. S9 in Supporting information) further support these findings. After cycling, the Gr-0.2ICA electrode retains a relatively intact lamellar structure, while the pristine Gr electrode exhibits severe pulverization. Similarly, the lithium metal surface in Gr-0.2ICA cells appears smooth and flat, whereas significant cracks are observed on the lithium metal from pristine Gr cells. The TEM images provide additional evidence (Figs. 4b and c). The pristine Gr anode develops a highly inhomogeneous SEI layer with substantial defects at the graphite edges. In contrast, the Gr-0.2ICA anode forms a uniform and dense SEI layer with a thickness of 12.4 nm and maintains a well-defined edge structure. This uniform SEI layer improves interfacial stability and reduces side reactions, further enhancing the cycling performance and durability of the Gr-0.2ICA anode.
To understand the influence of ICA on lithium-ion solvation and SEI formation, ab initio molecular dynamics (AIMD) simulations were conducted. Two models were established: Pristine graphene (Gr) and graphene grafted with –SO3Li groups (Gr-ICA). Radial distribution function (RDF) analysis (Figs. 4d and e) shows that, compared to the pristine Gr model, the Gr-ICA model exhibits a significant decrease in the g(r) and N(r) values of ethylene carbonate (EC) and diethyl carbonate (DEC) molecules, alongside a slight increase in those of PF6− anions. This indicates a reduction in the coordination number of EC and DEC in the Li+ solvation sheath, accompanied by an increased proportion of PF6− anions. These changes promote the formation of an inorganic-rich SEI layer, reducing interfacial resistance and facilitating lithium-ion migration. Additionally, a distinct peak emerges at 1.97 Å in the Gr-ICA model, positioned closer to Li+ than the peaks for EC, DEC, and PF6− anions. This peak corresponds to the coordination of Li+ with –SO3Li groups, which exhibit a coordination number similar to that of PF6− anions. These results demonstrate that while the –SO3Li groups remain covalently anchored to the graphene surface, their strong dipole moment induces significant reorganization of the adjacent Li+ solvation structure. This interfacial restructuring not only accounts for the observed kinetic enhancement but also facilitates the incorporation of additional PF6− anions into the solvation shell. Consequently, the preferential decomposition of these anions at the electrode-electrolyte interface results in the formation of an inorganic-rich SEI layer with superior electrochemical stability. By influencing the composition of the SEI layer, the –SO3Li groups promote the formation of a stable, uniform, and inorganic-rich SEI, which significantly improves interfacial stability and electrochemical performance.
The role of ICA in interfacial chemistry was further investigated using XPS of the cycled graphite anodes (Fig. S10 in Supporting information). The F 1s spectra (Fig. 4f) reveal consistent fluorinated species in both pristine Gr and Gr-0.2ICA anodes, including LiF (685.3 eV), PFy/POyFz (687.9 eV), and C–F (687.3 eV). However, the proportion of LiF in the SEI layer of the Gr-0.2ICA anode is significantly higher (49.5%) than that of the pristine Gr anode (41.2%). The LiF-rich SEI is formed through the participation of ICA in Li+ solvation and the decomposition of PF6− anions on the electrode surface. The increased LiF content enhances interfacial stability, promotes uniform lithium-ion flux, and ensures favorable conditions for stable cycling.
To further validate the role of the ICA grafted with –SO3Li groups in graphite batteries, single-layer pouch cells (Gr||LFP) were assembled using different anodes and commercial lithium iron phosphate (LFP) cathodes (with a specific capacity of 143 mAh/g). The Gr-0.2ICA pouch cell exhibits superior discharge specific capacities across a range of charge densities (0.1–2 C) compared to the pristine Gr pouch cell (Fig. 5a and Fig. S11 in Supporting information), owing to the optimized interfacial ion transport facilitated by ICA. Additionally, the Gr-0.2ICA cell demonstrates exceptional cycling stability, retaining 75.1% of its capacity (96.4 mAh/g) after 1400 cycles at 1 C, whereas the pristine Gr cell experiences rapid capacity degradation and fails after only 500 cycles (Fig. 5b). Consistent with the coin cell results, pouch cells employing non-optimal ICA ratios (0.1%, 0.3%, 0.5% and 1.0%) all displayed significantly faster capacity decay compared to the 0.2% ICA formulation (Fig. S12 in Supporting information). Post-cycling SEM images of the graphite anodes and LFP cathodes (Figs. S13 and S14 in Supporting information) reveal that the Gr-0.2ICA anode maintains an intact lamellar structure, while the pristine Gr anode shows significant surface disruption and lithium dendrite formation. The charge-discharge curves at the 400th cycle (Fig. 5c) further highlight the advantages of Gr-0.2ICA, with lower polarization and higher specific capacity attributed to the uniform, LiF-rich SEI layer formed by addition of the ICA. The addition of ICA improves battery performance without compromising safety, as confirmed by ARC tests demonstrating maintained thermal stability with no thermal runaway below 120 ℃ (Fig. S15 in Supporting information).
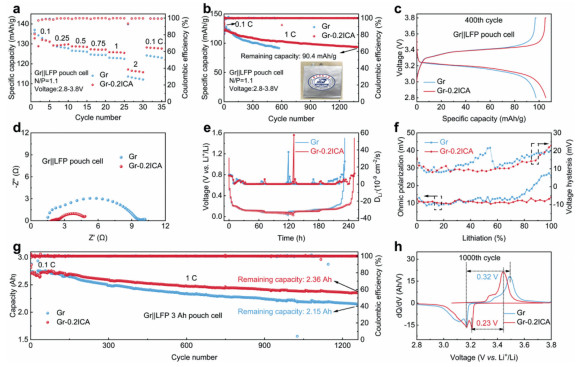
Differential capacity curves (Fig. S16 in Supporting information) indicate that Gr-0.2ICA exhibits a higher amplitude and more pronounced peaks during discharge, as well as a greater specific capacity per unit voltage, suggesting deeper lithiation compared to the pristine Gr anode [45]. This behavior is attributed to the accelerated lithium-ion transport through the LiF-rich SEI enabled by ICA. Electrochemical impedance spectroscopy (EIS) measurements after 50 cycles (Fig. 5d) further confirm the benefits of ICA, showing significantly lower impedance for the Gr-0.2ICA pouch cell. This reduction in impedance is attributed to the regulation of the interfacial solvation structure by ICA, which promotes the formation of a highly ion-conductive SEI.
The ion diffusion kinetics of the Gr-0.2ICA and pristine Gr anodes were further investigated using the galvanostatic intermittent titration technique (GITT) [40], as illustrated in Fig. 5e and Fig. S17 (Supporting information). The Li+ diffusion coefficients (
In order to better illustrate the improvement effect of ICA on the performance of graphite batteries, 3 Ah Gr||LFP pouch cells were assembled. Both the pristine Gr and Gr-0.2ICA pouch cells initially exhibit stable specific discharge capacities of 2.74 and 2.73 Ah, respectively, at 1 C, indicating that ICA incorporation maintains the intrinsic capacity characteristics. However, significant divergence in electrochemical performance becomes apparent upon prolonged cycling, with the Gr-0.2ICA cells exhibiting markedly enhanced cycling stability compared to the pristine Gr cells. After 1200 cycles at 1 C, the Gr-0.2ICA cell retains a specific discharge capacity of 2.36 Ah, corresponding to a capacity retention rate of 86.4%, significantly higher than that of the pristine Gr cell (2.17 Ah, 79.5%) (Fig. 5g). Furthermore, the polarization voltage of the Gr-0.2ICA cell (0.23 V) is markedly lower than that of the pristine Gr cell (0.32 V) (Fig. 5h). These results demonstrate that the ICA facilitates the formation of a LiF-rich SEI layer, which enhances lithium-ion conduction, reduces polarization, and significantly improves the overall cycling stability of the battery.
In summary, we develop an ion-conducting agent by grafting –SO3Li groups onto graphene surface. The SO3Li groups promote the entry of PF6− anions into the Li+ solvation shell by anions-solvent dipole interaction, contributing to a stable LiF-rich SEI. Consequently, LiF-rich SEI reduces the migration barrier of Li+ in graphite electrodes and facilitates the rapid migration of lithium ions in the anode. The assembled 3 Ah Gr||LiFePO4 pouch cell with ICA could maintain a high-capacity retention of 86.4% after 1200 cycles at 1 C. This work not only presents a novel and convenient method for the preparation of high-performance graphite lithium-ion battery with the wide applications, but also helps to reveal the underlying correlation between the solvent/anode interface and electrochemical stability of the graphite anode.
The authors declare that they have no known competing financial interests or personal relationships that could have appeared to influence the work reported in this paper.
Shijie Liao: Writing – original draft, Validation, Data curation. Dongming Cheng: Writing – original draft, Validation, Data curation. Xinyan Xu: Data curation. Qiyue Li: Data curation. Shengzhe Xu: Data curation. Jianchao Zhang: Data curation. Helei Wei: Data curation. Ying Wei: Validation. Qi Li: Data curation. Kai Li: Data curation. Zihan Long: Data curation. Yuanyuan Luo: Data curation. Yunhui Huang: Validation, Data curation. Mingfeng Tan: Writing – review & editing. Bo Lin: Writing – review & editing. Henghui Xu: Writing – review & editing.
This work was supported by the National Natural Science Foundation of China (No. 52302253), the Key Program of the National Natural Science Foundation of China (No. 52231009), Key R&D Program of Hubei Province (No. 2023BAB028). We also thank the Analytical and Testing Centre of HUST and the State Key Laboratory of Materials Processing and Die & Mold Technology of HUST for XRD, SEM, Raman, and TEM measurements. The authors thank the Neware Technology Limited for the electrochemical testing. Thanks to shiyanjia (
Supplementary material associated with this article can be found, in the online version, at doi:
Y. Huang, J. Li, Adv. Energy Mater. 12 (2022) 2202197. doi: 10.1002/aenm.202202197
F. Degen, M. Winter, D. Bendig, et al., Nat. Energy. 8 (2023) 1284–1295. doi: 10.1038/s41560-023-01355-z
J. Xiao, F. Shi, T. Glossmann, et al., Nat. Energy 8 (2023) 329–339. doi: 10.1038/s41560-023-01221-y
J.B. Goodenough, K. Park, J. Am. Chem. Soc. 135 (2013) 1167–1176. doi: 10.1021/ja3091438
W. Zhao, C. Zhao, H. Wu, et al., J. Energy Stor. 81 (2024) 110409. doi: 10.1016/j.est.2023.110409
B. Cao, M. Du, Z. Guo, et al., Carbon Fut. 1 (2024) 9200017. doi: 10.26599/cf.2024.9200017
Y. Liu, H. Shi, Z. Wu, Energy Environ. Sci. 16 (2023) 4834–4871. doi: 10.1039/d3ee02213g
Y. Yin, X. Dong, Interdiscipl. Mater. 2 (2023) 569–588. doi: 10.1002/idm2.12105
R. Tian, S. Park, P.J. King, et al., Nat. Commun. 10 (2019) 1933. doi: 10.1038/s41467-019-09792-9
H. Liu, Z. Zhu, Q. Yan, et al., Nature 585 (2020) 63–67. doi: 10.1038/s41586-020-2637-6
S.S. Zhang, L. Ma, J.L. Allen, et al., J. Electrochem. Soc. 168 (2021) 40519. doi: 10.1149/1945-7111/abf40c
T.R. Jow, S.A. Delp, J.L. Allen, et al., J. Electrochem. Soc. 165 (2018) A361. doi: 10.1149/2.1221802jes
E. Kazyak, K.H. Chen, Y. Chen, et al., Adv. Energy Mater. 12 (2022) 2102618. doi: 10.1002/aenm.202102618
S. Lee, J. Kim, J. Moon, et al., Nat. Commun. 12 (2021) 39. doi: 10.1038/s41467-020-20297-8
X. Yang, G. Zhang, B. Bai, et al., Rare Met. 40 (2021) 1708–1718. doi: 10.1007/s12598-020-01692-y
C. Ma, Z. Hu, N. Song, et al., Rare Met. 40 (2021) 837–847. doi: 10.1007/s12598-020-01625-9
N. Kim, S. Chae, J. Ma, et al., Nat. Commun. 8 (2017) 812. doi: 10.1038/s41467-017-00973-y
Q. Cheng, R. Yuge, K. Nakahara, et al., J. Power Sourc. 284 (2015) 258–263. doi: 10.1016/j.jpowsour.2015.03.036
J. Liu, H. Wu, J. Tang, et al., Nanotechnology 35 (2024) 505402. doi: 10.1088/1361-6528/ad7b3b
C. Ji, Q. Zhou, Y. Yuan, et al., Energy Environ. Sci. 17 (2024) 4273–4282. doi: 10.1039/d4ee00970c
R. Wang, G. Lu, W. Qiao, et al., Carbon 95 (2015) 940–948. doi: 10.1016/j.carbon.2015.09.013
P. Wang, X. Zhu, Y. Ding, et al., Ionics 30 (2024) 105–114. doi: 10.1007/s11581-023-05290-7
N. Wang, Q. Liu, B. Sun, et al., Sci. Rep. 8 (2018) 9934. doi: 10.1038/s41598-018-28310-3
X. Guan, J. Xia, Z. Wei, et al., Carbon 225 (2024) 119143. doi: 10.1016/j.carbon.2024.119143
D. Hu, L. Chen, J. Tian, et al., Chin. J. Chem. 39 (2021) 165–173. doi: 10.1002/cjoc.202000512
L. Zhang, C. Zhu, S. Yu, et al., J. Energy Chem. 66 (2022) 260–294. doi: 10.1016/j.jechem.2021.08.001
A. Madzvamuse, L. Hamenu, L. Mohammed, et al., ChemistrySelect 3 (2018) 10805–10810. doi: 10.1002/slct.201802259
X. Gong, Y. Zheng, J. Zheng, et al., ChemElectroChem 7 (2020) 1465–1472. doi: 10.1002/celc.201902098
D. Shao, H. Zhong, L. Zhang, ChemElectroChem 1 (2014) 1679–1687. doi: 10.1002/celc.201402210
T. Ruan, J. Xu, N. Fang, et al., Adv. Funct. Mater. 35 (2025) 2418307. doi: 10.1002/adfm.202418307
Y. Li, S. Jia, Z. Chen, et al., J. Energy Stor. 96 (2024) 112671. doi: 10.1016/j.est.2024.112671
J. Kim, Y.K. Park, H. Kim, et al., Chem. Mat. 34 (2022) 5791–5798. doi: 10.1021/acs.chemmater.2c00220
J. He, N. Wang, Z. Yang, et al., Energy Environ. Sci. 11 (2018) 2893–2903. doi: 10.1039/c8ee01642a
X. Wang, Z. Luo, J. Huang, et al., J. Mater. Sci. Technol. 147 (2023) 47–55. doi: 10.1016/j.jmst.2022.11.015
Y. Kong, X. Qiu, Y. Xue, et al., J. Am. Chem. Soc. 146 (2024) 23764–23774. doi: 10.1021/jacs.4c05107
T. Wang, M. Li, L. Qi, et al., Adv. Funct. Mater. 33 (2023) 2308470. doi: 10.1002/adfm.202308470
X. Luan, L. Qi, Z. Zheng, et al., Angew. Chem. Int. Ed. 62 (2023) e202215968. doi: 10.1002/anie.202215968
L.L. Jiang, C. Yan, Y.X. Yao, et al., Angew. Chem. Int. Ed. 60 (2021) 3402–3406. doi: 10.1002/anie.202009738
R. Zhou, H. Guo, Y. Yang, et al., J. Alloy. Compd. 689 (2016) 130–137. doi: 10.1016/j.jallcom.2016.07.315
M. Niu, L. Dong, J. Yue, et al., Angew. Chem. Int. Ed. 63 (2024) e202318663. doi: 10.1002/anie.202318663
T. Zhang, F. Hu, W. Shao, et al., ACS Nano 15 (2021) 15027–15038. doi: 10.1021/acsnano.1c05330
L.W. Sommer, P. Kiesel, A. Ganguli, et al., J. Power Sourc. 296 (2015) 46–52. doi: 10.1016/j.jpowsour.2015.07.025
K. Li, Y. Huang, G. Han, et al., J. Power Sourc. 624 (2024) 235526. doi: 10.1016/j.jpowsour.2024.235526
Y. Zhang, S. Hao, F. Pei, et al., Natl. Sci. Rev. 11 (2024) nwae254. doi: 10.1093/nsr/nwae254
H. Kato, Y. Kobayashi, H. Miyashiro, J. Power Sourc. 398 (2018) 49–54. doi: 10.1016/j.jpowsour.2018.07.043

Scheme 1 Schematics showing the evolution process of Gr and SO3Li-modified Gr anode during charging.

Figure 1 Characterization of ICA: (a) XRD spectra. (b) Raman spectra. (c) FT-IR spectra. (d) C 1s of XPS spectra. (e) S 2p of XPS spectra. (f) SEM image and (g) EDS elemental distributions of corresponding S of ICA. (h) TEM image of ICA. (i) AFM image of ICA.

Figure 2 (a) Rate performance of Li||Gr cells with various proportions of ICA from 0.1 C to 2 C. (b) Cycling performance of with various proportions of ICA at 1 C. (c) Charge/discharge curves of Li||Gr cells with various proportions of ICA at 100th cycle (1 C). Li-ion migration barriers on (d) Gr and (e) Gr-SO3Li (inset shows the optimized structure). (f) CV curves of the first cycle of Li||Gr and Li||Gr-0.2ICA cells at 0.5 mV/s. (g) Profiles of CV peak currents versus the square root of the scan rates. (h) Diffusion coefficient of lithium ions. (i) Schematic diagram of the evolution of embedded lithium in Gr and Gr-0.2ICA anodes.

Figure 3 (a) Schematic diagram of the pouch cell with an implanted optical fiber. (b) Process of implanting an optical fiber into a pouch cell. (c) Plot of the relationship between different states of charge and strain. (d) Slope of strain variation at different states of charge.

Figure 4 (a) XRD patterns of Gr and Gr-0.2ICA anodes after cycling. TEM image of (b) Gr and (c) Gr-0.2ICA anodes after cycling. Radial distribution function analysis of (d) Gr, (e) Gr-ICA with AIMD simulation. (f) F 1s spectra of XPS in Gr and Gr-0.2ICA anodes after cycling.

Figure 5 (a) Rate performance and (b) long-term cycling performance at 1 C of Gr and Gr-0.2ICA pouch cells. (c) Corresponding capacity curves of the 400th cycle at 1 C. (d) EIS plots of Gr and Gr-0.2ICA pouch cells after 50 cycles at 1 C. (e) GITT curves and the calculated Li+ diffusion coefficients and derived (f) Ohmic polarization and voltage hysteresis of Gr and Gr-0.2ICA anodes. (g) Long-cycle performance of 3 Ah pouch cell with Gr and Gr-0.2ICA anodes at 1 C. (h) Corresponding differential capacity curves of 2.8–3.8 V vs. Li+/Li at 1 C for the 1000th cycle.

 扫一扫看文章


扫一扫关注我们
 DownLoad:
 下载:
下载:
 下载:
下载: