Dynamic self-engineering of Fe-doped NiSe2 into amorphous γ-FexNi1-xOOH ultrathin nanosheets via electrochemical reconstruction for alkaline oxygen evolution
Citation:
Elhussein Desoki Helal, Wenhai Xu, Liyao Gao, Yizhe Li, Hao Sun, Qingzhen Xu, Imran Ali Chandio, Safdar Abbas, Abdul Hameed Pato, Mohamed Mokhtar Mohamed, Man Zhao, Wen Liu. Dynamic self-engineering of Fe-doped NiSe2 into amorphous γ-FexNi1-xOOH ultrathin nanosheets via electrochemical reconstruction for alkaline oxygen evolution[J]. Chinese Chemical Letters,
2026, 37(8): 111311.
doi:
10.1016/j.cclet.2025.111311
Dynamic self-engineering of Fe-doped NiSe2 into amorphous γ-FexNi1-xOOH ultrathin nanosheets via electrochemical reconstruction for alkaline oxygen evolution
English
Dynamic self-engineering of Fe-doped NiSe2 into amorphous γ-FexNi1-xOOH ultrathin nanosheets via electrochemical reconstruction for alkaline oxygen evolution
wenliu@buct.edu.cn (W. Liu). 1 These authors contributed equally to this work.
Received Date:
26 February 2025 Accepted Date:
13 May 2025 Revised Date:
07 May 2025 Available Online:
15 August 2026
Abstract:
We report a facile low-temperature synthesis of Fe-doped NiSe2 nanoparticles as an efficient pre-catalyst, which undergoes complete electrochemical reconstruction into amorphous γ-FexNi1-xOOH nanosheets (< 2 nm thickness) during activation process of cyclic voltammetry. The reconstituted catalyst achieves record-low overpotentials of 163 mV at 20 mA/cm2 and 230 mV at 300 mA/cm2, with a Tafel slope of 33.8 mV/dec and a turnover frequency (TOF) of 0.1 s-1 at overpotential of 210 mV. Remarkably, it shows outstanding operational stability with negligible activity decay after 300 h chronopotentiometry at 100 mA/cm2. Through multimodal ex situ/in situ characterizations, we conclusively identify the in situ-formed amorphous γ-FexNi1-xOOH nanosheets as the active phase, where Fe doping optimizes the electronic structure of Ni sites while the ultrathin morphology maximizes exposed active centers. This work establishes a universal precatalyst engineering strategy through controlled structural evolution of metastable precursors, applicable to diverse energy conversion systems.
OER plays a pivotal role in sustainable energy conversion technologies such as water electrolysis and metal air batteries. However, its intrinsically sluggish kinetics, arising from the multi-step proton coupled electron transfer process (4OH- → O2 + 2H2O + 4e-), necessitates highly efficient electrocatalysts to reduce overpotentials and enable practical applications. Although noble-metal oxides (e.g., IrO2 and RuO2) are excellent OER electrocatalysts, their scarcity, prohibitive cost and poor stability have prompted ever-increasing efforts for seeking alternative non-precious-metal-based electrocatalysts [1–3].
Nickel-based non-oxidic materials have emerged as promising candidates for alkaline OER due to their surface reconstruction into oxyhydroxide phases (e.g., γ-NiOOH) under operational conditions [4,5]. γ-NiOOH is a promising alkaline OER electrocatalyst, which has a large interplanar distance facilitating the movement of water (H2O) and hydroxide (OH-) ions through it, resulting in more exposed surface area and in turn high activity and stability [6]. The reconstructed phases of γ-NiOOH, whether forming core-shell surface structures or defect-rich bulk phases, consistently outperform their conventionally synthesized counterpart in OER activity [7,8]. Li et al. obtained NiSe@NiOOH core–shell hyacinth-like nanostructures via in situ electrochemical oxidation (ISEO), demonstrating OER activity with overpotential of 332 mV at 50 mA/cm2 [9]. In another study, carbonate-intercalated γ-NiOOH particles were in situ derived from Ni sulfide under the alkaline OER conditions, achieving overpotential of 255 mV at 10 mA/cm2 [10]. Other study showed that K-intercalated γ-NiOOH was in situ obtained from amorphous Nickel Pnictides during operation process of OER, achieving outstanding performance [11]. Recent advances further suggest that amorphous catalysts and ultrathin 2D nanostructures provide superior catalytic performance compared to crystalline or bulk materials, owing to their abundant defect sites and maximized surface accessibility [12,13]. Inspired by these findings, we aimed to design a Ni-based precatalyst capable of in situ transforming into amorphous ultrathin γ-NiOOH nanosheets during activation process, thereby synergistically integrating structural and compositional advantages for enhanced activity and stability.
NiFe selenides have attracted particular interest due to their optimal electronic structure for OER intermediate adsorption. Despite their potential, conventional synthetic methods for NiFe selenides require high-temperatures (> 400 ℃), leading to polydisperse particles with mixed phase compositions and limited active site exposure, thus compromising catalytic performance [14,15]. Consequently, there is an urgent need for innovative synthesis that can produce phase-pure NiFe selenides with controlled nanostructures under mild conditions.
Herein, we demonstrate a rapid low-temperature synthesis of phase-pure Fe-doped NiSe2 nanoparticles via a hydrazine hydrate assisted selenization strategy (Scheme S1 in Supporting information). By controlling the feeding ratio of FeCl3·6H2O into NiCl2 precursors (denoted as x%, where x = 5, 10, 15, 20), a series of Fe-NiSe2-x% catalysts (Table S1 in Supporting information) were obtained within 180 min at 80 ℃. Comprehensive characterizations including X-ray diffraction (XRD), transmission electron microscopy (TEM), and energy-dispersive X-ray (EDX) mapping (Figs. S1-S4 in Supporting information) confirms the formation of homogeneous cubic NiSe2 nanoparticles (20-50 nm in length) with uniform Fe doping and no detectable impurity phases.
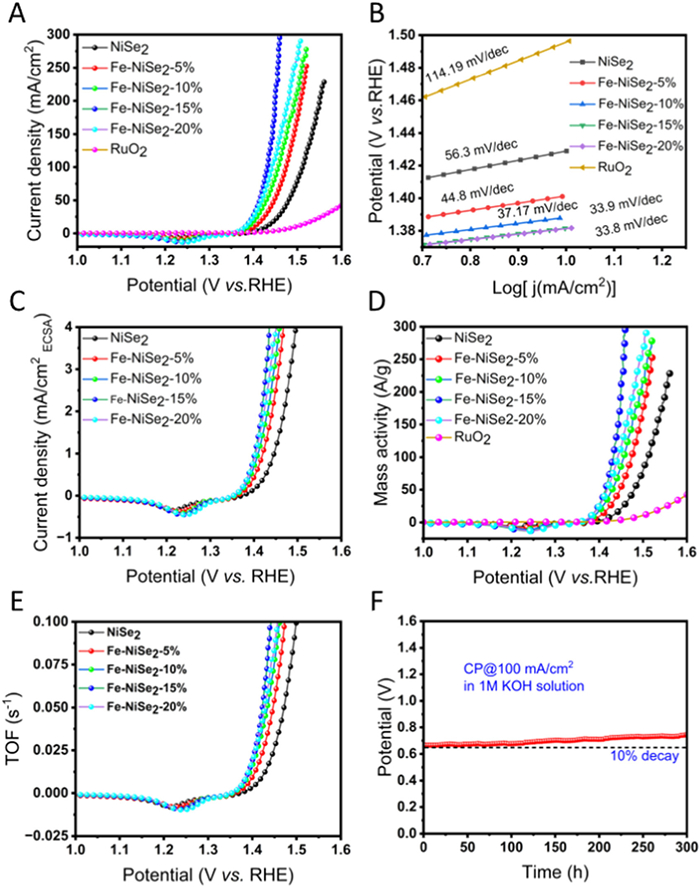
The electrocatalytic performance of Fe-NiSe2-x% catalysts (x = 5, 10, 15, 20), bare NiSe2 and commercial RuO2 was systematically evaluated for OER in 1 mol/L KOH using a three-electrode configuration. Prior to assessing the electrochemical activities, an activation process of 200 cyclic voltammetry (CV) cycles was conducted for the catalysts (Figs. S5 and S6 in Supporting information). Linear sweep voltammetry (LSV) curves after iR-correction (Fig. 1A, Figs. S7 and S8 in Supporting information) reveal a pronounced Fe-doping-dependent activity trend. The Fe-NiSe2-15% electrode delivers an ultralow overpotential (η) of 163 mV at 20 mA/cm2, outperforming both RuO2 (η = 307 mV) and other Fe-NiSe2-x% variants (η = 218 mV for NiSe2, 188 mV for 5% Fe, 178 mV for 10% Fe, and 165 mV for 20% Fe) (Fig. S9A in Supporting information). This performance ranks among the top notch of reported Ni-based OER catalysts (Table S5 in Supporting information). Kinetic analysis via Tafel slopes (Fig. 1B) further confirm the superiority of Fe-NiSe2-15%, exhibiting the lowest Tafel slope of 33.8 mV/dec, significantly lower than Fe-NiSe2-20% (33.9 mV/dec), Fe-NiSe2-10% (37.17 mV/dec), Fe-NiSe2-5% (44.8 mV/dec), and NiSe2 (56.3 mV/dec). This indicates Fe doping optimally accelerates the rate-determining step of OER, likely by modulating the electronic structure of active sites.
Figure 1
Figure 1.
Catalytic OER performances of the as-prepared samples and commercial RuO2 in 1 mol/L aqueous KOH solution. (A) Polarization curves, (B) Tafel plots, (C) normalized polarization curves by ECSA, (D) mass activities, (E) TOF values, (F) chronopotentiometry (CP) test of Fe-NiSe2-15% at 100 mA/cm2 for 300 h.
To probe charge transfer dynamics, electrochemical impedance spectroscopy (EIS) was employed (Figs. S9B and C in Supporting information). Fe-NiSe2-15% exhibits the smallest semicircle diameter, corresponding to the lowest charge transfer resistance (Rct), followed by Fe-NiSe2-20% < Fe-NiSe2-10% < Fe-NiSe2-5% < NiSe2 < RuO2 (Table S4in Supporting information). This trend aligns well with the activity sequence, suggesting enhanced interfacial electron transfer kinetics in Fe-NiSe2-15%.
Intrinsic activity was quantified by normalizing the current density to both electrochemical specific surface area (ECSA) and catalyst mass. ECSA was estimated via double layer capacitance (Cdl) measurements, performed by recording CVs in the non-faradic potential region at scan rates ranging from 10 mV/s to 100 mV/s (Fig. S10 in Supporting information). As shown in Fig. S10 and S9D (Supporting information), Fe-NiSe2-15% and Fe-NiSe2-20% exhibit the highest Cdl value of 1.17 mF/cm2, compared to Fe-NiSe2-10% (1.05 mF/cm2), Fe-NiSe2-5% (0.85 mF/cm2), and pristine NiSe2 (0.73 mF/cm2). This trend suggests that Fe doping at 15% optimally increases the electrochemically active surface area, exposing more accessible sites for OER. Normalized LSV curves (Fig. 1C) confirm Fe-NiSe2-15% achieves the highest specific activity (4 mA/cmECSA2 at 1.43 V vs. RHE), while mass activity reaches 300 A/g at η = 230 mV- 61-fold higher than commercial RuO2, also outperforming other counterparts (Fig. 1D and Fig. S9E in Supporting information). Furthermore, turnover frequency (TOF) calculations at η = 210 mV yield 0.1 s-1 for Fe-NiSe2-15%, surpassing Fe-NiSe2-20% (0.07 s-1), Fe-NiSe2-10% (0.06 s-1), Fe-NiSe2-5% (0.041 s-1), and NiSe2 (0.019 s-1) (Fig. 1E and Fig. S9F in Supporting information). The numbers of active sites were calculated based on the integration of reduction peaks in Fig. S11 (Supporting information). This multi-metric superiority confirms Fe-NiSe2-15% as the most intrinsically active catalyst in the series. Additionally, the long-term stability was assessed via chronopotentiometry (CP) at 100 mA/cm2 (Fig. 1F). Fe-NiSe2-15% maintains 90% initial activity after 300 h, demonstrating exceptional durability under harsh OER conditions. More importantly, the alkali water electrolyzer of Pt∥Fe-NiSe2-15% requires only 1.48 V to reach current density of 20 mA/cm2, outperforming that of Pt/C∥RuO2 (1.65 V). Moreover, it can work stably for more than 80 h without significant voltage decay at 100 mA/cm2 (Fig. S12 in Supporting information), indicating the potential industrial application for water splitting.
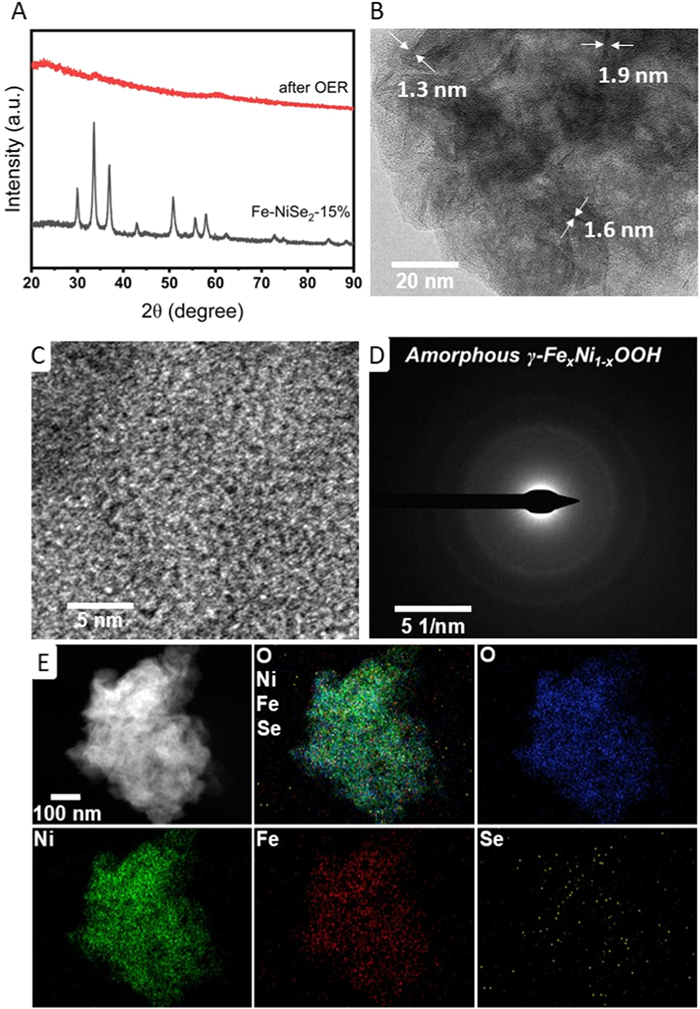
To unravel the structural evolution and active site origin of Fe-NiSe2-15% during OER, post-test characterizations were performed after 24 h chronopotentiometry at 100 mA/cm2. XRD pattern (Fig. 2A) reveals broadened diffraction features with diminished intensity, indicative of complete amorphization. Morphological evolution was captured by electron microscopy: pre-catalyst nanoparticles (Figs. S2 and S3) reconstructed into ultrathin nanosheets (Fig. S13 in Supporting information and Fig. 2B) with lateral thickness < 2 nm as evidenced by Atomic Force Microscopy images (AFM, Fig. S14 in Supporting information). High resolution TEM (HR-TEM) image confirms the dominantly amorphous nature of these nanosheets (Fig. 2C), evidenced by the absence of lattice fringes, while selected-area electron diffraction (SAED, Fig. 2D) displays diffuse halos without discrete spots, ruling out residual crystalline phases. Elemental redistribution during reconstruction was quantified through nanoscale EDX mapping (Fig. 2E): Selenium content drops by over 99% (from 63.68 at% for Fe-NiSe2-15% to 0.2 at% after activation to 0.15 at% after CP test), replaced by oxygen incorporation (52.09 at%) to form γ-FexNi1-xOOH (Tables S2 and S3 in Supporting information). Notably, Fe and Ni maintain homogeneous distribution with atomic Fe/Ni ratio preserved at 0.09 (vs. initial 0.085), confirming structural integrity despite drastic phase transformation at the activation process (Table S3 in Supporting information). This synergistic amorphous 2D architecture-combining metastable oxyhydroxide chemistry with maximized surface accessibility-establishes the fundamental structure-correlation underlying the exceptional OER performance.
Figure 2
Figure 2.
Structure investigation of Fe-NiSe2-15% after CP at 100 mA/cm2 for 24 h. (A) XRD patterns, (B) TEM image showing several thicknesses of nanosheets, (C) HR-TEM image, (D) selected area diffraction (SAED) pattern, (E) elemental mapping at a 100 nm scale by HAADF-STEM.
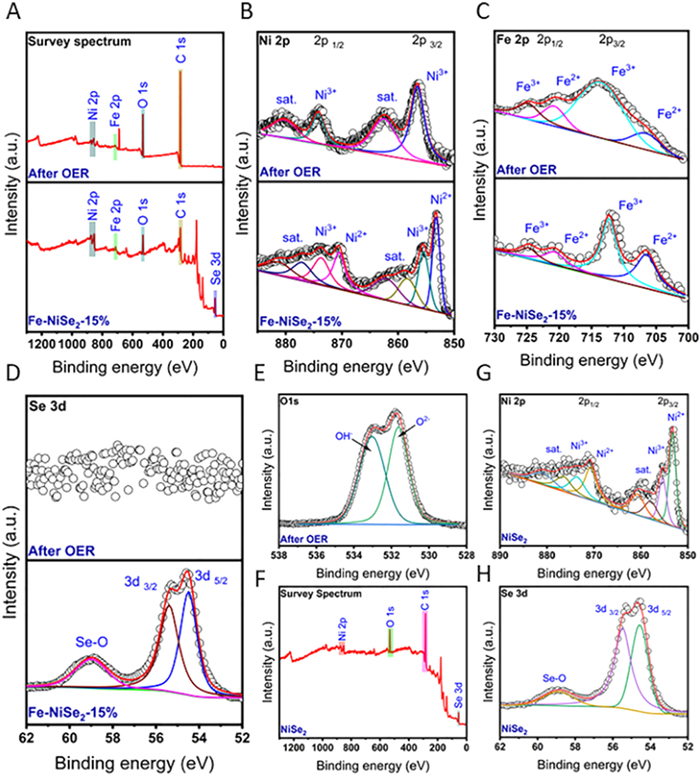
Comprehensive XPS analysis elucidates the dynamic chemical evolution of Fe-NiSe2-15% during prolonged OER operation. Calibration of the binding energies was first done using C 1s (284.8 eV). The initial survey spectra (Fig. 3A) confirm the coexistence of Ni, Fe, Se, and trace surface oxygen species, with a distinct Se 3d peak (54.47 eV) verifying successful selenium incorporation. Post-OER characterization reveals complete disappearance of Se 3d signals (< 0.5 at% detection limit) alongside a dramatic increase in O 1s intensity, consistent with full structural reconstruction toward oxyhydroxide phases. High-resolution Ni 2p spectra (Fig. 3B) identify critical oxidation state transitions: Pristine catalyst surface exhibits mixed Ni2+ (853.21 eV) and Ni3+ (855.43 eV) states, accompanied by satellite peaks characteristic of Ni-Se bonding (857.84/861.13 eV). Following 24 h OER operation, sharp Ni3+ (856.6 eV) with a +1.17 eV binding energy shift relative to initial Ni3+ states, matching reference spectra for γ-NiOOH phases [16,17]. The complete absence of Ni2+ signals confirms irreversible complete surface oxidation to catalytically active Ni3+ species.
Figure 3
Figure 3.
XPS analysis before and after the chronopotentiometry (CP) test at 100 mA/cm2 for 24 h. (A) The XPS survey spectrum. The high-resolution deconvoluted XPS spectra of (B) Ni 2p, (C) Fe 2p, (D) Se 3d, and (E) O 1s after the CP test. For comparison, the XPS data of NiSe2 are also shown, including (F) the survey spectrum and the high-resolution deconvoluted spectra of (G) Ni 2p, (H) Se 3d.
Parallel Fe 2p XPS analysis (Fig. 3C) reveals retained iron incorporation with modified oxidation states: Initial Fe2+ (39.2%) and Fe3+ (60.8%) components transition to predominantly Fe3+ (76.8%) post OER test, indicating progressive Fe oxidation [18]. Se 3d spectrum (Fig. 3D) transitions from metallic Se (54.47/55.38 eV) and surface SeO2 (58.97 eV) [19,20] to complete signal loss post-OER, which confirms near-total Se leaching. Oxygen speciation further supports structural reconstruction, with O 1s peaks (Fig. 3E) resolving into lattice oxygens (531.6 eV) and surface hydroxyl groups (533.0 eV)-diagnostic of γ-NiOOH phase [21]. The surface of NiSe2 was also investigated by XPS spectra, showing the surface oxidation of Ni and Se species (Figs. 3F-H). These correlative analyses demonstrate Fe doping accelerates a three-stage reconstruction pathway: (1) Initial selenium oxidation (Se-2 to SeO2) and dissolution, (2) progressive nickel oxidation (Ni2+ to Ni3+) coupled with iron redox modulation, and (3) final stabilization into amorphous γ-FexNi1-xOOH nanosheets. This structural evolution generates defect-rich architectures with optimized Ni3+-O-Fe3+ active motifs, rationalizing the exceptional OER performance through enhanced active site exposure and optimized electronic configurations.
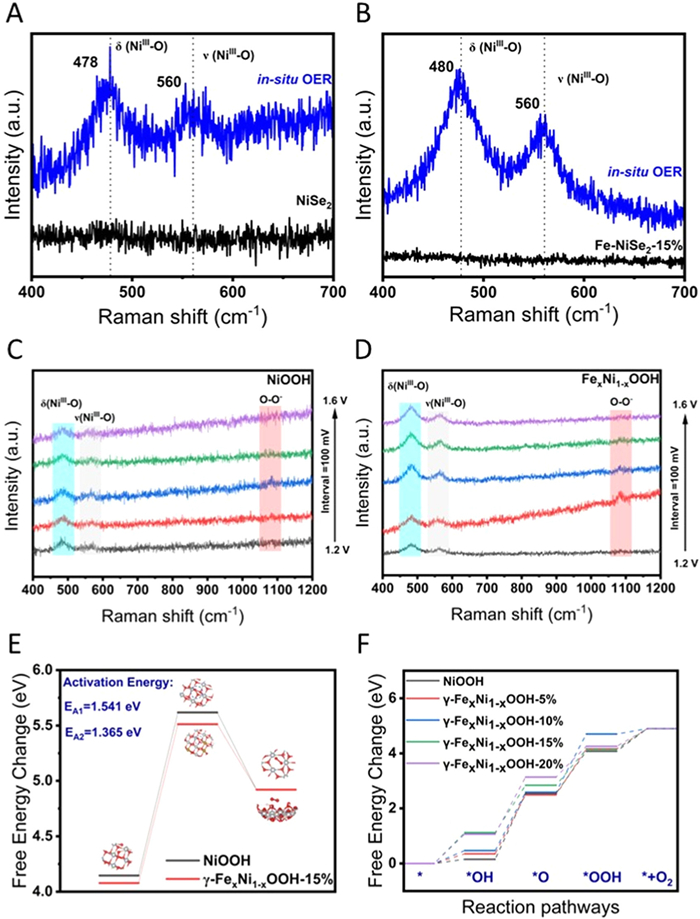
To dynamically track the structural evolution of Fe-NiSe2-15% during OER process, we employed cryo-quenched operando Raman spectroscopy. Catalysts were rapidly frozen using liquid N2 after 24 h OER operation at 100 mA/cm2, effectively preserving metastable intermediates. While pristine NiSe2 and Fe-NiSe2-15% powder showed featureless Raman spectra between 400 cm-1 and 700 cm-1 (Figs. 4A and B), the post-OER samples exhibited two definitive Raman vibrational modes: A depolarized bending mode at 480 cm-1 (δ(NiIII-O)) and a polarized stretching mode at 560 cm-1 (ν(NiIII-O)), characteristic of γ-NiOOH phases [22]. This spectroscopic evidence conclusively establishes the electro-chemical reconstruction of Fe-NiSe2 into γ-FexNi1-xOOH under operational conditions, corroborating our XPS observations of nickel oxidation and selenium depletion.
Figure 4
Figure 4.
Analysis of surface adsorption on catalysts. (A, B) Raman spectra of the as-prepared NiSe2 and Fe-NiSe2-15% powder and after OER chronopotentiometry for 24 h at 100 mA/cm2 (in situ) in 1 mol/L KOH. (C, D) In situ Raman spectra of OER process on (C) NiOOH and (D) FexNi1-xOOH at different applied potentials in 1 mol/L KOH. (E) Transition state and activation energy during the adsorption of OOH to O2 by NiOOH and FexNi1-xOOH-15%. (F) Step diagram of the OER reaction mechanism.
Potential-dependent Raman spectroscopy (Figs. 4C and D) further resolved the mechanistic sequence: Below 1.35 V vs. RHE, Fe3+ sites preferentially stabilize O-O- intermediates through strong orbital hybridization (Fe 3d-O 2p), lowering the energy barrier for O-O bond formation. As potentials exceed 1.45 V, intensification of the 560 cm-1 NiIII-O vibration with O2 bubble evolution, indicating Ni3+ centers drive the final O-O- disproportionation through enhanced electron withdrawal from anti-bonding orbitals.
First-principles calculations quantify this dual-site synergy: The Fe-incorporated γ-phase demonstrates a 18% reduction in O-O- formation energy (1.36 vs. 1.54 eV for Ni-only sites, Fig. 4E), while the overall reaction pathway identifies *O → *OOH as the potential-determining step with an overpotential of 0.48 V (Fig. 4F). Crucially, metastable O-O- bridges (detected at 1080 cm-1 in operando spectra) facilitates electron delocalization across Fe-O-Ni centers, simultaneously elevating Ni valence state and weakening *O adsorption energy barrier by 0.32 eV through dipole-charge interactions. Bader charge and OER reaction intermediates of γ-NiOOH and γ-FexNi1-xOOH-15% are clarified in Fig. S15 (Supporting information).
This self-optimizing architecture-combining Fe-mediated O-O- generation with Ni3+-driven O2 release-establishes a mechanistic bridge between our observed structural evolution (amorphous γ-phase formation) and exceptional catalytic performance. The synergistic redox interplay rationalizes both the 61-fold mass activity enhancement over RuO2 and the sustained 300 h stability through continuous surface renewal.
In summary, this study demonstrates a facile low-temperature synthesis of Fe doped NiSe2 as a high-efficiency pre-catalyst for alkaline oxygen evolution. Through operando characterization and post-test analysis, we unveil dynamic electrochemical reconstruction mechanisms: The initial crystalline Fe-NiSe2 undergoes complete structural metamorphosis under activation process of cyclic voltammetry, evolving into ultrathin amorphous γ-FexNi1-xOOH nanosheets via three synchronized processes: (1) Near-total selenium leaching (> 99% Se depletion), (2) progressive nickel oxidation (Ni2+ → Ni3+), and (3) iron-regulated morphological reorganization into 2D architectures. This self-engineered active phase delivers exceptional catalytic performance (overpotential η20 = 163 mV, stability > 300 h at 100 mA/cm2), attributable to three interconnected advantages: First, the amorphous γ-phase creates defect-rich surfaces exposing optimized Ni3+-O-Fe3+ dual-active motifs that lower O-O bond formation barriers. Second, the ultrathin 2D morphology maximizes electrochemical interfaces. Third, Fe incorporation modulates charge distribution across Ni-O-Fe centers, enhancing both electron transfer kinetics and structural resilience against oxidative corrosion.
Remarkably, this in situ electrochemical reconstruction strategy bypasses traditional complex catalyst design, establishing a general paradigm where transition metal chalcogenides serve as dynamic precursors that self-optimize into high-performance oxyhydroxides under operational conditions. The fundamental insights into reconstruction-driven activation mechanisms open new avenues for developing adaptive electrocatalysts tailored for industrial water splitting applications.
Declaration of competing interest
The authors declare that they have no known competing financial interests or personal relationships that could have appeared to influence the work reported in this paper.
CRediT authorship contribution statement
Elhussein Desoki Helal: Writing – review & editing, Writing – original draft, Visualization, Validation, Software, Project administration, Methodology, Investigation, Formal analysis, Data curation, Conceptualization. Wenhai Xu: Writing – review & editing, Writing – original draft, Visualization, Validation, Software, Methodology, Investigation, Formal analysis, Data curation, Conceptualization. Liyao Gao: Formal analysis, Data curation. Yizhe Li: Formal analysis, Data curation. Hao Sun: Formal analysis, Data curation. Qingzhen Xu: Formal analysis, Data curation. Imran Ali Chandio: Formal analysis, Data curation. Safdar Abbas: Formal analysis, Data curation. Abdul Hameed Pato: Formal analysis, Data curation. Mohamed Mokhtar Mohamed: Formal analysis, Data curation. Man Zhao: Formal analysis, Data curation. Wen Liu: Supervision, Resources, Project administration, Funding acquisition.
Acknowledgments
The work was supported by the National Natural Science Foundation of China (Nos. 21771018 and 21875004), Beijing Natural Science Foundation and Xiaomi Joint Grants (No. L223011), and the Beijing University of Chemical Technology (No. buctrc201901).
Supplementary materials
Supplementary material associated with this article can be found, in the online version, at doi:10.1016/j.cclet.2025.111311.
[1]
J.H. Montoya, L.C. Seitz, P. Chakthranont, et al., Nat. Mater. 16 (2017) 70–81. doi: 10.1038/nmat4778
[2]
L.L. Ma, Y.R. Hao, J. Sun, et al., Adv. Funct. Mater. 35 (2025) 2409924. doi: 10.1002/adfm.202409924
[3]
J.X. Wen, Y.R. Hao, J. Sun, et al., Adv. Energy Mater. 15 (2025) 2405555. doi: 10.1002/aenm.202405555
[4]
Z. Zhao, P.S. Lamoureux, A. Kulkarni, M. Bajdich, ChemCatChem 11 (2019) 3423–3431. doi: 10.1002/cctc.201900846
[5]
L. Trotochaud, J.K. Ranney, K.N. Williams, S.W. Boettcher, J. Am. Chem. Soc. 134 (2012) 17253–17261. doi: 10.1021/ja307507a
[6]
S. Lee, Y.C. Chu, L. Bai, H.M. Chen, X. Hu, Chem. Catal. 3 (2023) 100475.
M. Gong, Y. Li, H. Wang, et al., J. Am. Chem. Soc. 135 (2013) 8452–8455. doi: 10.1021/ja4027715
[19]
C. Xia, Q. Jiang, C. Zhao, M.N. Hedhili, H.N. Alshareef, Adv. Mater. 28 (2015) 77.
[20]
S. Huang, Q. He, W. Chen, et al., Chem. Eur. J. 21 (2015) 4085–4091. doi: 10.1002/chem.201406124
[21]
E.L. Ratcliff, J. Meyer, K.X. Steirer, et al., Chem. Mater. 23 (2011) 4988–5000. doi: 10.1021/cm202296p
[22]
A.C. Garcia, T. Touzalin, C. Nieuwland, N. Perini, M.T. Koper, Angew. Chem. Int. Ed. 58 (2019) 12999–13003. doi: 10.1002/anie.201905501
Figure 1
Catalytic OER performances of the as-prepared samples and commercial RuO2 in 1 mol/L aqueous KOH solution. (A) Polarization curves, (B) Tafel plots, (C) normalized polarization curves by ECSA, (D) mass activities, (E) TOF values, (F) chronopotentiometry (CP) test of Fe-NiSe2-15% at 100 mA/cm2 for 300 h.
Figure 2
Structure investigation of Fe-NiSe2-15% after CP at 100 mA/cm2 for 24 h. (A) XRD patterns, (B) TEM image showing several thicknesses of nanosheets, (C) HR-TEM image, (D) selected area diffraction (SAED) pattern, (E) elemental mapping at a 100 nm scale by HAADF-STEM.
Figure 3
XPS analysis before and after the chronopotentiometry (CP) test at 100 mA/cm2 for 24 h. (A) The XPS survey spectrum. The high-resolution deconvoluted XPS spectra of (B) Ni 2p, (C) Fe 2p, (D) Se 3d, and (E) O 1s after the CP test. For comparison, the XPS data of NiSe2 are also shown, including (F) the survey spectrum and the high-resolution deconvoluted spectra of (G) Ni 2p, (H) Se 3d.
Figure 4
Analysis of surface adsorption on catalysts. (A, B) Raman spectra of the as-prepared NiSe2 and Fe-NiSe2-15% powder and after OER chronopotentiometry for 24 h at 100 mA/cm2 (in situ) in 1 mol/L KOH. (C, D) In situ Raman spectra of OER process on (C) NiOOH and (D) FexNi1-xOOH at different applied potentials in 1 mol/L KOH. (E) Transition state and activation energy during the adsorption of OOH to O2 by NiOOH and FexNi1-xOOH-15%. (F) Step diagram of the OER reaction mechanism.


 DownLoad:

 下载:
下载:


 下载:
下载:

