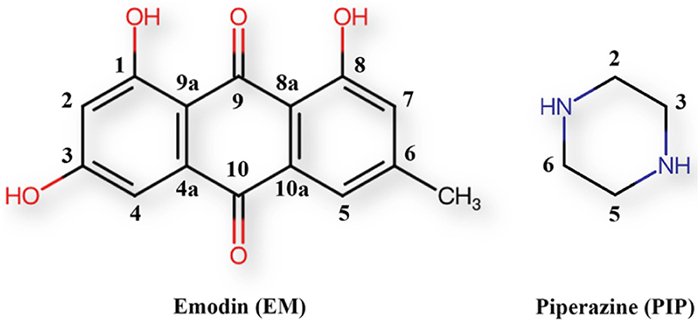
Scheme 1.
The molecular structure of EM and cocrystal former (CCF).
Revolutionizing sepsis therapy: Machine learning-driven co-crystallization reveals emodin's therapeutic potential
Shuang Li , Penghui Yuan , Xinyi Zhang , Meiru Liu , Dezhi Yang , Linglei Kong , Li Zhang , Yang Lu , Guanhua Du

Machine learning is an advanced analytics technique that is able to find useful value in large amounts of data and make accurate predictions about it, and is a branch of artificial intelligence. It has the advantage of fast computation and high accuracy. Due to its advantages, it has been widely used in various fields such as physics, legal science, medicine [1–3].
Co-crystallization technology allows for the formation of cocrystals or salts without altering the chemical structure of active pharmaceutical ingredients (APIs). This technique has effectively enhanced the physicochemical properties of APIs, significantly improving their druggability [4–6]. Such advantages bring new hope for natural products with extensive biological activity that have yet to reach clinical application due to inherent physical and chemical limitations.
Emodin (EM) is an anthraquinone compound extracted and isolated from the Chinese herb rhubarb (Rheum rhabarbarum L.), known as an insoluble natural product [7]. The structural formula of EM is shown in Scheme 1. Numerous studies have demonstrated EM's diverse pharmacological activities, including antibacterial [8,9], anti-inflammatory [10–12], antiviral [13,14], antidiabetic [15–17], anticancer [18–21], and anti-Alzheimer's effects [22–25]. Recent research indicates that EM shows remarkable therapeutic or protective effects in animal models of sepsis. Its primary mechanism involves reducing inflammation, thereby limiting tissue and organ damage, such as injury to the lungs and jejunum, and preventing further dysfunction [26–32]. This makes EM a promising candidate for sepsis treatment. However, EM's limited solubility [33–35] presents a challenge. Drug researchers have explored various strategies to improve its physicochemical properties, including cocrystals, salts, inclusion complexes, and lipid complexes [36–40]. While these approaches have yielded progress in enhancing its physicochemical profile, further in vivo studies are needed to confirm EM's bioavailability and its ameliorative effect on sepsis.
The key to successful co-crystallization lies in screening appropriate coformers to create stable cocrystals or salts. Building on prior research and recently published screening studies [41–43], we identified piperazine (PIP) as a highly suitable coformer. Fig. S1 (Supporting information) lists the ∆pKa distributions of the two-component piperazine cocrystals and salts in Cambridge Structural Database (CSD). PIP offers several advantages: (1) It has good solubility and permeability, making it potentially effective at enhancing the solubility and permeability of host molecules; (2) it is safe and has low toxicity; (3) its weak alkalinity makes it easily co-crystallized with acidic compounds, including salts and cocrystals. PIP enhances the solubility of anthraquinone compounds by modifying the molecular stacking and local chemical environment. Through statistical analysis of cocrystals and salts formed between APIs and PIP, we observed that the inclusion of highly soluble PIP in the crystal lattice can lead to solvent-mediated phase transitions [44–49]. This effect likely results from the strong interaction between PIP and the solvent, which causes substantial dissolution in solution, thereby weakening the crystal structure and enhancing the dissolution rate.
To determine whether EM can form cocrystal with PIP, we first make predictions using computational chemistry and molecular modeling methods. We used molecular electrostatic potential surface (MEPS) [50,51], molecular complementarity (MC) and multicomponent hydrogen-bond propensity (MCHBP) methods. Unexpectedly, all three predictions showed that the two could not form a cocrystal or salt. After that we thought of the machine learning model for cocrystal virtual screening that we established earlier - eXtreme Gradient Boosting (XGBoost) model [52]. Surprisingly, this prediction instead showed that EM and PIP can form cocrystal. In recent years, we have continuously enriched our database and improved the accuracy of cocrystal prediction. Therefore, we resolved to verify it through experiments. Fortunately, we successfully synthesized the EM-PIP cocrystal and conducted comprehensive characterizations, including single crystal X-ray diffraction (SCXRD), powder X-ray diffraction (PXRD), differential scanning calorimetry (DSC), thermogravimetric analysis (TGA), Fourier transform infrared spectroscopy (FT-IR), and solid-state nuclear magnetic resonance (SSNMR). Initial in vitro evaluations revealed that the EM-PIP cocrystal exhibited enhanced solubility and permeability. Further bioavailability assessments showed that cocrystal formation improved EM absorption, enhancing its effectiveness in vivo. Finally, using a murine sepsis model, we evaluated EM-PIP's efficacy and found that it alleviated lipopolysaccharide-induced sepsis and provided substantial protection against liver and kidney damage associated with sepsis.
First, given the potential of both cocrystals and salts to improve the properties of EM, selecting an appropriate multicomponent crystal former is crucial. Upon reviewing the available cocrystals of EM in the literature, we found that the number is relatively limited. In the CSD, EM has been reported to form cocrystals with five compounds: berberine, nicotinamide, pyrimethamine, 4, 4′-bipyridine, and carbamazepine [36,53–55]. Their scheme, refcodes and pKa values are listed in Fig. S2 and Table S1 (Supporting information). pKa values were predicted using DeepSynthesis (
|
|
(1) |
where E1, E2, and Ecc are the interaction site pairing energies of the pure solids 1 and 2 and a cocrystal of stoichiometry 1n2m respectively.
The powder of EM-PIP cocrystal was prepared by a suspension-stirring method as follows: 2 mmol EM and 1 mmol PIP at a stoichiometric ratio of 2:1, was stirred at room temperature (20 ± 5 ℃) for 24 h at 400 rpm with approximately 15 mL of methanol. The suspension was then filtered, and the solid substance was dried in a vacuum oven at 40 ℃ for approximately 12 h. The single crystals of EM-PIP cocrystal were prepared via a solution-slow evaporation method. A certain amount of obtained solid substance of EM-PIP cocrystal was dissolved in isopropanol. The solution was filtered to obtain a clear and transparent solution. The filtered solution was placed in a stable plane for crystallization for approximately 2 weeks at room temperature to obtain dark red block single crystals.
The instruments and methods used in this experiment are all in Supporting information. SCXRD can provide three-dimensional structure and basic information of cocrystal. Table S2 (Supporting information) lists the detailed crystallographic information of EM-PIP cocrystal. Hydrogen bond information is shown in Table S3 (Supporting information). The SCXRD results indicate that EM and PIP form cocrystal in the P21/c space group at a ratio of 2:1. The 3‑hydroxyl group and 10-carbonyl group of EM form O—H···N and N—H···O hydrogen bonds with the nitrogen atom of PIP, respectively, forming
DSC allows for the qualitative analysis of phase transitions via endothermic and exothermic peaks. As shown in Fig. S5e (Supporting information), the EM-PIP cocrystal exhibited two successive exothermic and endothermic peaks after 240 ℃, distinct from the DSC spectra of EM and PIP, indicating the formation of new substances. Simultaneously analyzing the TG spectrum in Fig. S5f (Supporting information), the weight loss of EM-PIP between 160–280 ℃ is 13.01%. Through calculation, we found that the theoretical weight loss of PIP in EM-PIP is 13.75%, thus inferring that the weight loss step and exothermic peak within this temperature range are due to the decomposition weight loss of PIP. Meanwhile, EM-PIP lost 1.44% weight between 40 ℃ and 150 ℃, indicating the presence of adsorption solvents or water.
EM exhibited a broad, weak absorption peak at 3382 cm-1 in Fig. S5g (Supporting information), attributed to the presence of hydroxyl groups. PIP showed a moderate intensity characteristic absorption peak at 3217 cm-1, corresponding to the N—H stretching vibration of the secondary amine. In the EM-PIP cocrystal, the hydroxyl stretching vibration peak shifted to 3276 cm-1 with reduced intensity, while the N—H vibration peak of PIP shifted to 3062 cm-1. These spectral shifts indicated an interaction between EM and PIP. Based on the single crystal structure of EM-PIP cocrystal, these infrared spectrum changes were inferred to result from the formation of O—H···N and N—H···O hydrogen bonding interactions between them.
Solid state 13C nuclear magnetic resonance spectra of newly formed substances with different starting materials can indicate the successful formation of cocrystal. The SSNMR of 13C is shown in Fig. S5h (Supporting information). 13C NMR spectroscopy provides a direct and intuitive method to determine the formation of new material forms. The displacement of 13C in EM-PIP mainly occurs in the C3—O2 and C2—N1 parts of EM and PIP, with resonances ranging from 166.01 ppm (pure EM) and 46.72 ppm (pure PIP) to 44.14 ppm and 169.35 ppm (EM-PIP), respectively. Based on the results of SCXRD, it can be concluded that EM and PIP can form O2—H2···N1P hydrogen bonds.
The distribution of extreme electrostatic potential values of EM and PIP analyzed by MEPS analysis is shown in Fig. 1a. It can be seen that the maximum electrostatic potential of EM occurs near the 3‑hydroxyl group, with a value of +62.18 kcal/mol, the minimum value is −31.67 kcal/mol near the 10-carbonyl group [61,62]. The structure of PIP is centrosymmetric, with its maximum value occurring near the hydrogen atom of the PIP nitrogen atom at +23.96 kcal/mol, and its minimum value is −36.08 kcal/mol near the nitrogen atom of PIP. From the distribution of electrostatic potential values, we can infer the interaction site of cocrystal between the two compounds, that is, the hydrogen bond of O—H···N type between the nitrogen of PIP and the 3‑hydroxyl group of EM, and the hydrogen bond of N—H···O type between the nitrogen of PIP and the 10-carbonyl group of EM. We can further infer that the hydrogen bond strength of the former is stronger than that of the latter. We intercepted the clusters between PIP and surrounding EM in the single crystal structure, and studied the interaction between them by independent gradient model based on Hirshfeld partition (IGMH) analysis [63]. The results are shown in Fig. 1b. It can be seen that the hydrogen bonding sites predicted by MEPS have been confirmed in the single crystal structure, and the center of the isovalue between hydrogen bonds formed by O2—H···N1P is blue, while the isovalue between hydrogen bonds formed by N1P—H···O5 is only green, which confirms that the hydrogen bonding intensity of the former is higher than that of the latter.
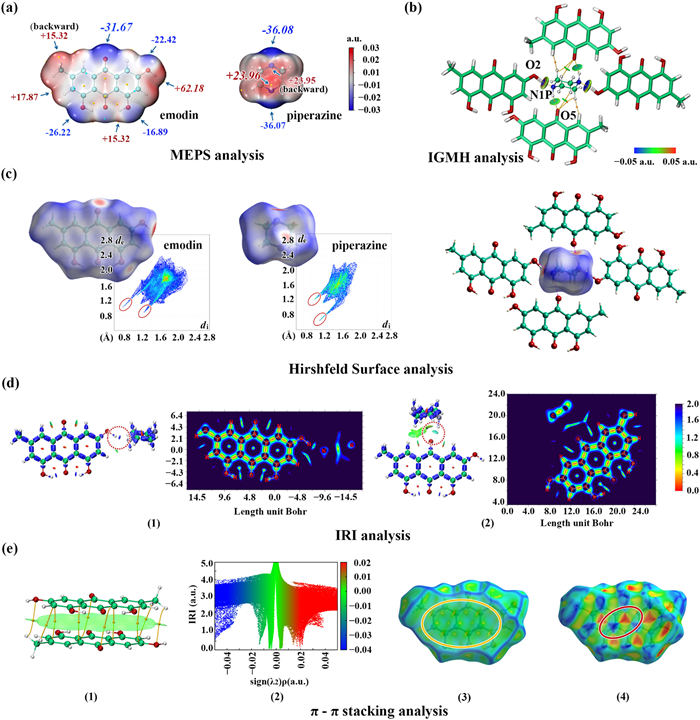
Hirshfeld surface binding molecular fingerprint maps [64–66] can also be used to determine hydrogen bonds and their strengths. Fig. 1c shows the results of Hirshfeld surface. The circular red domain indicated by Hirshfeld surface indicates the hydrogen bond interaction site, and the darker the color, the stronger the interaction. In the molecular fingerprint, the spikes labeled with red ellipse represent hydrogen bond donors above and hydrogen bond receptors below. It can be seen that both compounds can be used as hydrogen bond donors and receptors. Combined with MEPS, it can be seen that the length (sharpness) of spikes representing hydrogen bond donors and receptors is positively correlated with strength.
Similar to IGMH, interaction region indicator (IRI) analysis [67] is also a powerful tool for visualizing intermolecular interactions and it shows more types of interactions. Fig. 1d gives the results of IRI and its plane coloring map. Fig. 1d(1) shows that the nitrogen of PIP forms an O—H···N hydrogen bond with the hydroxyl group at position 3 of EM, and in Fig. 1d(2) the nitrogen of PIP forms an N—H···O hydrogen bond with the carbonyl group at position 10 of EM, indicated by a circular red dashed line. It can be seen that the interaction region of the former is blue indicating stronger interaction intensity while the latter is green indicating weaker interaction intensity. It can also be seen in the planar fill map that the highlighted areas between atoms represent interaction and increase with the orange and green areas in the highlighted areas.
Fig. 1e gives the results of π-π stacking in crystal structure. In Fig. 1e(1), the π-π stacking between two EM molecules using IRI is shown, and the orange spheres are shown as bond critical points (BCP) in green plane, which also confirms the existence of interaction from the perspective of atoms in molecules (AIM) theory. By comparing the colors of IRI isovalue and scatter plot, we can find the corresponding relationship between the peaks of scatter plot and isovalue. As shown in the Fig. 1e(2), the cyan peak of −0.01 ~ −0.02 a.u. corresponds to hydrogen bonding interactions, the green peak of about 0.005 a.u. corresponds to vdW interactions, and the red peak of about 0.01~0.025 a.u. corresponds to steric hindrance effects within the anthraquinone ring. In addition, the shape index attribute or curvedness attribute can be mapped to the Hirshfeld surface to visualize the π-π interaction. For example, in Fig. 1e(3) shape index is a way to judge the existence of π-π stack by the existence of adjacent red and blue triangular regions, and in Fig. 1e(4) curvedness is a way to judge the existence of π-π stack by showing the wide and relatively flat region characteristics of molecular plane stack. It can be seen that shape index surface and curvature surface of EM have the character of π-π stacking.
In equilibrium solubility experiment, EM and EM-PIP were undetected in pH 1.2 and pH 4.5 media, indicating they were not soluble under these conditions. The equilibrium solubility of EM and EM-PIP at pH 6.8 was 0.02 ± 0.03 µg/mL and 0.40 ± 0.07 µg/mL, respectively. At pH 7.0, only EM-PIP was detected, with an equilibrium solubility of 273.09 ± 26.67 µg/mL. They are shown in Table S4 (Supporting information). These results demonstrate that EM-PIP has greater solubility in pure water than EM. Upon analyzing the pH of the experimental media post-experiment, we found that only at pH 7.0 did the pH values of EM and EM-PIP differ by approximately 2, as shown in Table S5 (Supporting information). Additionally, observations of the substances after testing revealed that, in media with pH 1.2, 4.5, and 6.8, the EM-PIP cocrystal ultimately converted to EM, while in pH 7.0 medium, the EM-PIP cocrystal remained stable, as shown in Fig. S6a (Supporting information). Thus, under alkaline conditions, EM-PIP is more stable and can significantly enhance the solubility of EM.
Throughout the powder dissolution in vitro experiment, no EM was detected. And no EM-PIP was detected in the media of 1.2 and 4.5. As shown in Fig. 2a, EM-PIP was present throughout the experiment at pH 7.0, and the cumulative dissolution reached 8.88 ± 1.17 mg. Under the condition of pH 6.8, as shown in Fig. 2b, it can only be detected from 60 min onwards, with cumulative dissolution reaching 2.24 ± 0.07 mg. At the same time, the cumulative dissolution of EM-PIP under 7.0 is three times higher than that under 6.8. Post-experiment, we conducted solid-phase characterization of the remaining substances, revealing that they had all converted to EM, as shown in Fig. S6b (Supporting information). Additionally, pH measurements indicated that the remaining solution had become slightly acidic (Table S5), similar to the pH measurements of EM after the equilibrium solubility experiment, further indicating that EM-PIP had converted to EM during the dissolution experiment. In a pure water medium, there were notable differences in the residual substances and pH values of EM-PIP under the two experimental conditions. Based on phase characterization of the remaining materials, we hypothesize that EM-PIP may have decomposed into EM in the 900 mL dissolution medium, lowering the pH and resulting in a lower apparent dissolution of EM-PIP than initially anticipated.
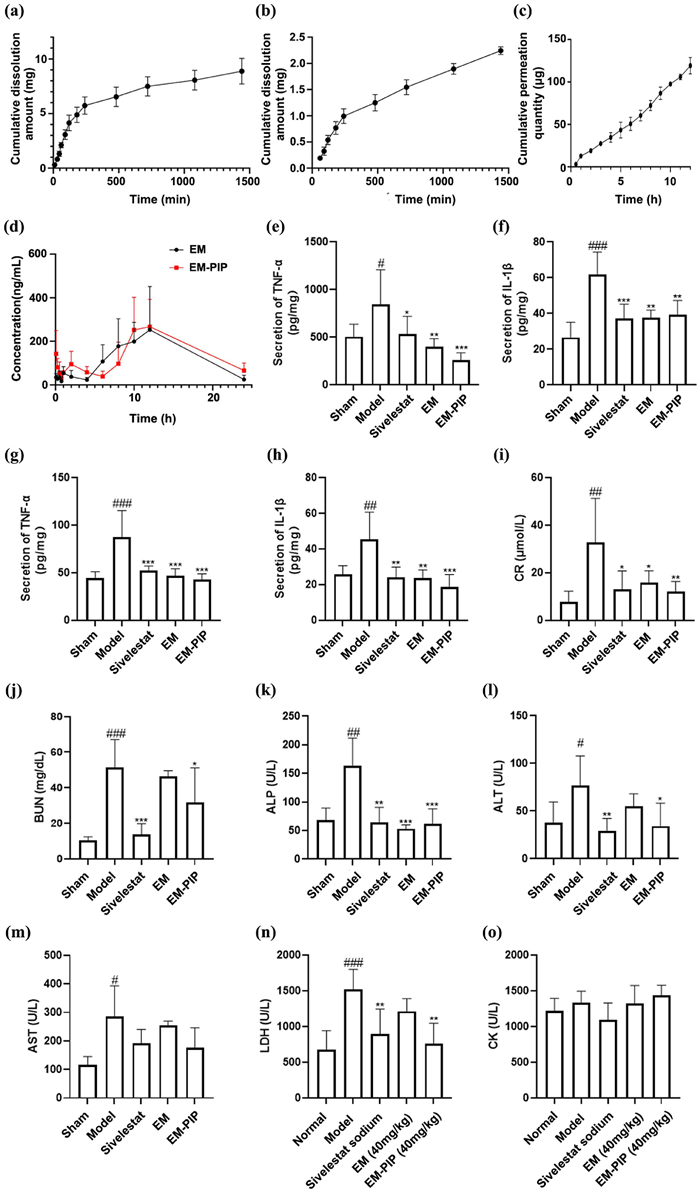
To evaluate whether the formation of cocrystal can enhance the permeability of EM, we conducted experiment by Franz diffusion cell method with buffer solution at pH 6.8 and 7.0. In this experiment, we found that EM was not detected under both conditions, and EM-PIP was not detected under pH 6.8. At pH 7.0, the cumulative permeation of EM in EM-PIP can reach 119.13 ± 9.67 µg in Fig. 2c. The apparent permeability coefficient (Papp) of EM-PIP can reach 9.02 × 10⁻⁶ cm/s by calculation and the Eq. 2 is shown below. According to previous studies, it can be judged that EM-PIP is a highly permeable substance [68]. It shows that the permeability of EM can be improved by co-crystallization technology.
|
|
(2) |
where Papp is in cm/s, dQ/dt is the drug transport per unit time (mol/s), A is the surface area of the membrane, and C is the initial concentration (mol/L).
The experimental methods for pharmacokinetics and pharmacodynamics can be found in the experimental section of supporting information. All procedures for animal experiments were strictly in accordance with the principles of the NIH Guide for the Care and Use of Laboratory Animals, and the protocols were approved by the Animal Ethics Committee of the Institute of Materials Medical, CAMS, and PUMC (Permit No. 00008390). High-performance liquid chromatography-mass spectrometry was used to determine the plasma concentration of EM, and the resulting plasma concentration-time curves for the EM-PIP cocrystal and pure EM after oral administration were shown in Fig. 2d. The calculated pharmacokinetic parameters were summarized in Table S6 (Supporting information). The pharmacokinetic data indicate that cocrystal formation altered the pharmacokinetic behavior of EM. The Cmax of EM-PIP reached 357.08 ± 71.80 µg/L, compared to 273.58 ± 159.62 µg/L for pure EM, showing that the cocrystal increased EM's Cmax. The bioavailability of EM-PIP, calculated by AUC(0-∞), was 215% of that of EM alone. Additionally, the significant decrease in CLz suggests that the cocrystal reduced the in vivo elimination rate of EM compared to pure EM. This study demonstrates that EM cocrystal formation enhances EM absorption and slows its elimination, which may facilitate EM's therapeutic effectiveness in vivo.
The pharmacological and behavioral scores of EM and EM-PIP on lipopolysaccharides (LPS) induced sepsis are shown in Table S7 (Supporting information). Compared to the control group, mice in the model group exhibited significant sepsis-related behavioral changes at various time points, which worsened over time. In contrast, the behavioral scores of mice in both the EM and EM-PIP groups were reduced at 24 h, with the EM-PIP group showing a more pronounced effect, suggesting that EM-PIP has a beneficial impact on LPS-induced sepsis.
Inflammatory factors and blood biochemical indicators were measured to assess the extent of organ damage caused by sepsis. The results of inflammatory factor detection are in Figs. 2e-h. Compared to the control group, levels of TNF-α and IL-1β in the hippocampus and lung tissues were significantly elevated in the model group mice. Treatment with EM and EM-PIP significantly reduced these levels, with the EM-PIP group demonstrating stronger therapeutic effects, indicating that EM-PIP effectively mitigates sepsis-associated encephalopathy (SAE) and lung injury.
Blood biochemical indicator analysis in Figs. 2i-o revealed that, compared to the model group, the EM-PIP group displayed varying degrees of reduction in all indicators, except for an increase in CK levels. This suggests that EM-PIP provided a protective effect against liver and kidney damage induced by sepsis.
In summary, emodin can be used in the treatment of sepsis, but defects in its solubility limit its clinical application. Piperazine is a co-crystalline former with high solubility and permeability. Our objective was to enhance the solubility of poorly soluble emodin through co-crystallization technology without altering the therapeutic effect. Prior to experimentation, we employed various computational chemistry and molecular modeling methods to assess whether emodin and piperazine could form a cocrystal or salt; however, the predictions were inconsistent, prompting experimental verification. Ultimately, we successfully synthesized the emodin-piperazine cocrystal. This finding underscores the robustness of machine learning models as demonstrated in prior research. This indicates that the accuracy of machine learning predictions based on high-quality data surpasses that of computational chemistry and molecular modeling methods. We characterized and evaluated the cocrystal through multiple methods and assessed its biological activity using a sepsis model. The experimental results demonstrated that the cocrystal improved emodin's solubility, permeability, and bioavailability. Additionally, biological evaluations indicated that the emodin-piperazine cocrystal alleviated lipopolysaccharide-induced sepsis, while blood biochemical indicators revealed a protective effect on liver and kidney function. These findings offer a reference method for natural products with broad biological activity, and limited clinical application due to physicochemical limitations.
The authors declare that they have no known competing financial interests or personal relationships that could have appeared to influence the work reported in this paper.
Shuang Li: Methodology, Investigation, Data curation. Penghui Yuan: Writing – review & editing, Methodology, Investigation. Xinyi Zhang: Writing – review & editing, Methodology, Investigation, Data curation. Meiru Liu: Software, Methodology, Formal analysis. Dezhi Yang: Writing – review & editing, Software, Funding acquisition, Formal analysis. Linglei Kong: Validation, Supervision. Li Zhang: Validation, Supervision, Funding acquisition. Yang Lu: Writing – review & editing, Funding acquisition. Guanhua Du: Supervision, Project administration.
This research was funded by the National Natural Science Foundation of China (No. 22278443), CAMS Innovation Fund for Medical Sciences (No. 2022-I2M-1–015), the Key R&D Program of Shandong Province (No. 2021ZDSYS26), Xinjiang Uygur Autonomous Region Innovation Environment Construction Special Fund and Technology Innovation Base Construction Key Laboratory Open Project (No. 2023D04065), 2023 Xinjiang Uygur Autonomous Region Innovation Tianchi Talent Introduction Program for financial support, and the Key Project of Natural Science of Bengbu Medical University (No. 2024byzd138).
Supplementary material associated with this article can be found, in the online version, at doi:
T. DoCarmo, S. Rea, E. Conaway, et al., Law Pol. 43 (2021) 170–199. doi: 10.1111/lapo.12164
G. Carleo, I. Cirac, K. Cranmer, et al., Rev. Mod. Phys. 91 (2019) 045002. doi: 10.1103/RevModPhys.91.045002
Q. Bi, K.E. Goodman, J. Kaminsky, et al., Am. J. Epidemiol. 188 (2019) 2222–2239.
G.R. Desiraju, Angew. Chem. Int. Ed. 34 (1995) 2311–2327. doi: 10.1002/anie.199523111
N.K. Duggirala, M.L. Perry, Ö. Almarsson, et al., Chem. Commun. 52 (2016) 640–655. doi: 10.1039/C5CC08216A
M. Karimi-Jafari, L. Padrela, G.M. Walker, et al., Cryst. Growth Des. 18 (2018) 6370–6387. doi: 10.1021/acs.cgd.8b00933
H.W. Jang, W.H. Hsu, M.J. Hengel, et al., Nat. Prod. Chem. Res. 6 (2018) 2. doi: 10.5213/inj.1836040.020
L. Li, X. Song, Z. Yin, et al., Microbiol. Res. 186 (2016) 139–145. doi: 10.4103/0972-9941.169953
X. Ji, X. Liu, Y. Peng, et al., Biochem. Biophys. Res. Commun. 494 (2017) 318–324. doi: 10.1016/j.bbrc.2017.10.033
M.R. de Oliveira, I.C.C. de Souza, F.B. Brasil, Neurochem. Res. 46 (2021) 482–493. doi: 10.1007/s11064-020-03181-1
Y. Ding, P. Liu, Z.L. Chen, et al., Front. Pharmacol. 9 (2018) 962. doi: 10.3389/fphar.2018.00962
T. Zhu, W. Zhang, S.J. Feng, H.P. Yu, Int. Immunopharmacol. 34 (2016) 16–24. doi: 10.1016/j.intimp.2016.02.014
S. Schwarz, K. Wang, W. Yu, B. Sun, W. Schwarz, Antiviral. Res. 90 (2011) 64–69. doi: 10.1016/j.antiviral.2011.02.008
Q. Shao, T. Liu, W. Wang, et al., Front. Pharmacol. 13 (2022) 902626. doi: 10.3389/fphar.2022.902626
A. Arvindekar, T. More, P.V. Payghan, et al., Food Funct. 6 (2015) 2693–2700. doi: 10.1039/C5FO00519A
Y. Wang, S. Huang, Y. Feng, et al., Acta Pharmacol. Sin. 33 (2012) 1195–1203. doi: 10.1038/aps.2012.87
J. Xue, W. Ding, Y. Liu, Fitoterapia 81 (2010) 173–177. doi: 10.1016/j.fitote.2009.08.020
C.M. Hsu, Y.A. Hsu, Y. Tsai, et al., Biochem. Biophys. Res. Commun. 392 (2010) 473–478. doi: 10.1016/j.bbrc.2009.10.153
Y. Wang, H. Yu, J. Zhang, et al., Cell Oncol. 38 (2015) 353–363. doi: 10.1007/s13402-015-0234-8
Y. Xing, M. Li, L. Tao, et al., J. Proteome Res. 17 (2018) 1943–1952. doi: 10.1021/acs.jproteome.8b00029
D. Wahi, D. Soni, A. Grover, J. Cancer. 12 (2021) 652–681. doi: 10.7150/jca.41160
C. Du, L. Shi, M. Wang, et al., Cell Mol. Biol. 65 (2019) 32–37. doi: 10.14715/cmb/2019.65.5.5
L. Wang, S. Liu, J. Xu, et al., J. Neurochem. 157 (2021) 1992–2007. doi: 10.1111/jnc.15156
P. Zeng, Y. Shi, X.M. Wang, et al., Int. J. Neuropsychopharmacol. 22 (2019) 57–70. doi: 10.1093/ijnp/pyy090
Z. Li, H. Bi, H. Jiang, et al., Mol. Med. Rep. 23 (2020) 108. doi: 10.18240/ier.2020.02.08
Y. Chen, Y. Xu, H. Zhang, et al., Biomed. Pharmacother. 84 (2016) 1001–1007. doi: 10.1016/j.biopha.2016.10.031
J. Yin, B. Wan, D. Liu, et al., J. Surg. Res. 202 (2016) 308–314. doi: 10.1016/j.jss.2015.12.049
F. Liu, T. Gu, D. Wei, Kaohsiung J. Med. Sci. 38 (2022) 253–260. doi: 10.1002/kjm2.12476
L. Gao, Z. Wang, Y. Mu, et al., Pathobiology 89 (2022) 135–145. doi: 10.1159/000520281
Z. Hua, Y. Wang, W. Chen, et al., Immun. Inflamm. Dis. 11 (2023) e942. doi: 10.1002/iid3.942
L. Shang, Y. Liu, J. Li, et al., Front. Pharmacol. 12 (2021) 724511. doi: 10.3389/fphar.2021.724511
Y. Li, R. Guo, M. Zhang, et al., Exp. Ther. Med. 19 (2020) 3521–3530. doi: 10.1080/23802359.2020.1827059
Y.C. Kuo, W.J. Tsai, H.C. Meng, et al., Life Sci. 68 (2001) 1271–1286. doi: 10.1016/S0024-3205(00)01033-X
S. Basu, A. Ghosh, B. Hazra, Phytother. Res. 19 (2005) 888–894. doi: 10.1002/ptr.1752
Z. Wang, S. Li, Q. Li, et al., Molecules 29 (2024) 1710. doi: 10.3390/molecules29081710
B. Park, W. Yoon, J. Yun, et al., Int. J. Pharm. 557 (2019) 26–35. doi: 10.1016/j.ijpharm.2018.12.027
Y. Li, L. Wang, Y. Tu, et al., J. Drug. Deliv. Sci. Technol. 29 (2015) 261–268. doi: 10.1016/j.jddst.2015.09.002
D. Singh, M.S.M. Rawa, A. Semalty, et al., J. Therm. Anal. Calorim. 108 (2012) 289–298. doi: 10.1007/s10973-011-1759-3
N. Qiu, X. Zhao, Q. Liu, et al., J. Mol. Liq. 289 (2019) 111151. doi: 10.1016/j.molliq.2019.111151
A. Oo, P. Mahalapbutr, K. Krusong, et al., J. Mol. Liq. 367 (2022) 120314. doi: 10.1016/j.molliq.2022.120314
N.R. Goud, K. Suresh, A. Nangia, Cryst. Growth Des. 13 (2013) 1590–1601. doi: 10.1021/cg301825u
A. Samie, G.R. Desiraju, M. Banik, Cryst. Growth Des. 17 (2017) 2406–2417. doi: 10.1021/acs.cgd.6b01804
R. Wang, P. Yuan, D. Yang, et al., J. Mol. Struct. 1229 (2021) 129596. doi: 10.1016/j.molstruc.2020.129596
M. Banik, S.P. Gop, S. Ganguly, et al., Cryst. Growth Des. 16 (2016) 5418–5428. doi: 10.1021/acs.cgd.6b00902
X. Wang, S. Xu, L. Jia, et al., CrystEngComm 21 (2019) 5284–5291. doi: 10.1039/c9ce00781d
L. Xu, J. Che, Y. Yan, et al., Cryst. Growth Des. 12 (2012) 6004–6011. doi: 10.1021/cg3010745
P. Sanphui, G. Bolla, A. Nangia, Cryst. Growth Des. 12 (2012) 2023–2036. doi: 10.1021/cg300002p
G. Bolla, P. Sanphui, A. Nangia, Cryst. Growth Des. 13 (2013) 1988–2003. doi: 10.1021/cg4000457
X. Dai, J. Yao, C. Wu, et al., Cryst. Growth Des. 20 (2020) 5160–5168. doi: 10.1021/acs.cgd.0c00326
M.J. Frisch, G.W. Trucks, H.B. Schlegel, et al., Gaussian 16, rev. A. 03, Gaussian, Inc., Wallingford CT, 2016.
T. Lu, F. Chen, J. Comput. Chem. 33 (2012) 580–592. doi: 10.1002/jcc.22885
D. Yang, L. Wang, P. Yuan, et al., Chin. Chem. Lett. 34 (2023) 107964. doi: 10.1016/j.cclet.2022.107964
Y. Deng, Y. Zhang, Y. Huang, et al., Cryst. Growth Des. 18 (2018) 7481–7488. doi: 10.1021/acs.cgd.8b01257
M. Li, Z. Li, Q. Zhang, et al., Cryst. Growth Des. 18 (2018) 6123–6132. doi: 10.1021/acs.cgd.8b01002
D. Huang, H.C.S. Chan, Y. Wu, et al., J. Mol. Liq. 329 (2021) 115604. doi: 10.1016/j.molliq.2021.115604
Q. Yang, Y. Li, J. Yang, et al., Angew. Chem. Int. Ed. 59 (2020) 19282–19291. doi: 10.1002/anie.202008528
D. Musumeci, C.A. Hunter, R. Prohens, et al., Chem. Sci. 2 (2011) 883–890. doi: 10.1039/c0sc00555j
T.L. Petrick, A. Grünwald, D.E. Braun, Cryst. Growth Des. 24 (2024) 4195–4212. doi: 10.1021/acs.cgd.4c00293
D. Yang, J. Cao, T. Heng, et al., Cryst. Growth Des. 21 (2021) 2292–2300. doi: 10.1021/acs.cgd.0c01706
C.F. Macrae, P.R. Edgington, P. McCabe, et al., J. Appl. Crystallogr. 39 (2006) 453–457. doi: 10.1107/S002188980600731X
H. Wang, D. Yang, W. Zhang, et al., Chin. Chem. Lett. 34 (2023) 107258. doi: 10.1016/j.cclet.2022.02.063
D. Yang, H. Wang, Q. Liu, et al., Chin. Chem. Lett. 33 (2022) 3207–3211. doi: 10.1016/j.cclet.2021.10.012
T. Lu, Q. Chen, J. Comput. Chem. 43 (2022) 539–555. doi: 10.1002/jcc.26812
S. Suda, A. Tateno, D. Nakane, et al., Int. J. Org. Chem. 13 (2023) 57–85. doi: 10.4236/ijoc.2023.132006
P.R. Spackman, M.J. Turner, J.J. McKinnon, et al., J. Appl. Crystallogr. 54 (2021) 1006–1011. doi: 10.1107/s1600576721002910
A. Aarva, V.L. Deringer, S. Sainio, et al., Chem. Mater. 31 (2019) 9243–9255. doi: 10.1021/acs.chemmater.9b02049
T. Lu, Q. Chen, Chem. Method 1 (2021) 231–239. doi: 10.1002/cmtd.202100007
L. de Souza Teixeira, T.V. Chagas, A. Alonso, et al., Pharmaceutics 12 (2020) 988. doi: 10.3390/pharmaceutics12100988

Figure 1 Theoretical calculation of EM, PIP and EM-PIP cocrystal: (a) MEPS analysis of EM and PIP, (b) IGMH analysis of EM-PIP cocrystal, (c) Hirshfeld surface analysis of EM and PIP, (d) IRI analysis of EM-PIP cocrystal, and (e) π-π stacking.

Figure 2 In vivo and in vitro evaluation results of EM and EM-PIP: (a) Powder dissolution in vitro results of EM-PIP at pH 7.0, (b) powder dissolution in vitro results of EM-PIP at pH 6.8, (c) penetration test in pH 7.0, (d) plasma concentration-time profiles, (e) secretion of TNF-α in lung tissue of sepsis mice, (f) secretion of IL-1β in lung tissue of sepsis mice, (g) secretion of TNF-α in hippocampal tissue of sepsis mice, (h) secretion of IL-1β in hippocampal tissue of sepsis mice, (i) creatinine (CR) concentration reflecting renal function, (j) blood urea nitrogen (BUN) concentration reflecting renal function, (k) alkaline phosphatase (ALP) concentration reflecting liver function, (l) alanine aminotransferase (ALT) concentration reflecting liver function, (m) aspartate aminotransferase (AST) concentration reflecting liver function, (n) lactate dehydrogenase (LDH) concentration reflecting the degree of myocardial injury, and (o) creatine kinase (CK) concentration reflecting the degree of myocardial injury.

 扫一扫看文章

扫一扫关注我们
 DownLoad:

 下载:
下载:
 下载:
下载: