
Figure 1.
Flowchart of the starch extraction process (A), SEM images at 1000× magnification (B), FT-IR spectra (C), X-ray diffraction patterns (D), CLD (E, F) of PMS and SGS.
Linking starch particle physicochemical properties to functionality in medicinal plants: Insights from Polygonum multiflorum and Smilax glabra
Nan Wang , Lingling Wu , Yaya Su , Haifeng Tang , Hailong Yuan

Starch is a natural polysaccharide widely distributed in plant tissues, primarily serving as an energy storage material essential for human nutrition. Due to variations in its physicochemical properties, starch from different plant sources exhibits distinct functional characteristics [1,2]. Among these, resistant starch (RS)—a type of starch that resists digestion in the small intestine and undergoes colonic fermentation—has garnered significant attention for its functional benefits, particularly its role in metabolic health [3]. RS is widely recognized as a key functional ingredient that confers beneficial physiological effects such as improved gut health, enhanced satiety, and reduced risk of metabolic diseases. Starches derived from food-medicinal plants, such as yam, kudzu, and Canna edulis, are particularly rich in RS, along with other functional components, making them promising candidates for innovative applications in medicinal fields [4].
Polygonum multiflorum is well-known for its broad pharmacological activities, including anti-aging, antioxidant, and neuroprotective effects [5]. Similarly, Smilax glabra tubers, traditionally used for their anti-inflammatory and antioxidant properties, serve as rich starch reservoirs [6]. Emerging evidence suggests that starches derived from these medicinal plants may possess unique functional characteristics, setting them apart from conventional starches. These starches may be particularly enriched with bioactive components, such as soluble dietary fiber and RS, which could further enhance their health benefits. Therefore, systematically investigating the particle property-function relationships of Polygonum multiflorum starch (PMS) and Smilax glabra starch (SGS) is crucial for understanding their potential as functional ingredients in various applications.
The functionality of starch is fundamentally determined by its physicochemical properties. Granule morphology, particle size distribution, amylose-to-amylopectin ratio, crystallinity, and internal porosity collectively influence starch behavior during digestion and fermentation processes [7]. These interrelated factors exhibit distinct correlations; for instance, starch granule size typically has an inverse relationship with enzymatic hydrolysis susceptibility [8,9]. Furthermore, A-type polymorphic starch primarily affects the initial hydrolysis rate, whereas B-type crystallinity usually influences the overall digestibility [10]. While significant research has established digestibility-property relationships for conventional starches, gaps remain in understanding how the physicochemical properties of starches from medicinal plants influence their dynamic changes during in vitro digestion and fermentation.
This study aims to explore how the physicochemical properties of PMS and SGS influence their functionality during digestion and fermentation. Through physicochemical characterization, the study will investigate the relationship between these properties and the starch degradation mechanisms. These findings will provide critical insights into the potential application of medicinal plants starches as functional ingredients and biopharmaceutical materials.
Starch extraction was performed following our previously established protocol, yielding PMS and SGS as homogeneous white powders (Fig. 1A). Detailed experimental procedures are available in Supporting information (Sections 2.2–2.4). Quantitative analysis, conducted according to Association of Official Analytical Chemists (AOAC) methods, revealed starch yields comparable to those from conventional tuber sources (Table 1). The moisture contents of PMS (11.28%) and SGS (7.47%) were within commercial starch specifications (< 13% w/w). Notably, a significant disparity in ash content was observed between PMS (0.49%) and SGS (0.02%) (P < 0.01), which could be attributed to the differential mineral absorption capacities of the source plants and the extraction process efficiencies [11]. While PMS exhibited moderately higher protein levels (0.32% vs. 0.18%), both starches demonstrated exceptionally low lipid contents (PMS: 0.22%; SGS: 0.15%), well below those of typical taro starches (< 0.4% benchmark) [12]. The minimal impurity profiles (ash/protein/lipid) confirm successful purification, with total starch contents reaching 88.81% (PMS) and 90.87% (SGS), satisfying stringent criteria for experimental-grade starches devoid of non-starch polysaccharides. The color parameters of the starches, including lightness (L*), a* (+red/-green), and b* (+yellow/-blue), were also assessed. The extraction method directly influenced the color, with both samples showing L* values above 90, indicating good brightness. This suggests that the ethanol extraction inhibited browning during the process.
 DownLoad:
CSV
DownLoad:
CSV
| Sample | PMS | SGS |
| Yield (%) | 10.32 | 13.11 |
| Moisture (%) | 11.28 ± 0.34 | 7.47 ± 0.16| |
| Ash (%) | 0.49 ± 0.05 | 0.02 ± 0.01| |
| Protein (%) | 1.31 ± 0.07 | 0.06 ± 0.01| |
| Fat (%) | 0.03 ± 0.01 | 0.05 ± 0.01| |
| Starch (%) | 88.81 ± 0.53 | 90.87 ± 0.46| |
| Amylose ratio (%) | 14.63 ± 0.49 | 21.54 ± 0.73| |
| Color L* | 96.17 ± 0.02 | 93.76 ± 0.24| |
| Color a* | 0.48 ± 0.02 | 0.07 ± 0.02| |
| Color b* | 1.90 ± 0.02 | 2.02 ± 0.02| |
| Color ΔE | 96.19 ± 0.02 | 93.78 ± 0.24| |
As a critical structural determinant, amylose content profoundly influences starch's physicochemical behavior, modulating gelatinization thermodynamics, gel optical properties, retrogradation kinetics, and RS formation. SGS exhibited a significantly higher amylose content (21.54%) compared to PMS (14.63%). This divergence predicts contrasting functional performances. Elevated amylose content in SGS suggests an enhanced retrogradation propensity and greater gel mechanical strength, making it suitable for structured matrices that require dimensional stability. In contrast, the lower amylose levels in PMS contribute to improved paste translucency and delayed syneresis, making it ideal for transparent sauce formulations and freeze-thaw stable thickeners.
The morphology and size of starch granules are closely related to their biological origin. PMS exhibits an oval or irregular polygonal shape with a rough surface, characterized by prominent grooves and numerous fragmented small particles (Fig. 1B). In contrast, SGS displays a near-spherical or irregular oval shape with a relatively smooth surface. This morphological difference may influence functional properties such as solubility, viscosity, and water absorption. The particle size distribution of PMS and SGS demonstrates notable differences (Table 2). The average particle size of PMS is 13.68 µm, significantly smaller than that of SGS, which is 31.75 µm, highlighting the distinct difference in particle morphology between the two. The smaller particle size of PMS may confer advantages in certain applications, as a reduced particle size typically enhances starch solubility and water absorption, thus improving its suitability under various processing conditions [13]. Additionally, differences in particle size could impact the digestion rate of starch within biological systems, influencing its potential applications in nutrition science and functional ingredients.
DownLoad:
CSV
| Sample | PMS | SGS | |
| RC (%) | 41.71 ± 0.26 | 50.66 ± 0.34| | |
| Crystal pattern | A | B | |
| Particle size | D10 (µm) | 7.08 ± 0.05 | 19.4 ± 0.29| |
| D50 (µm) | 13.38 ± 0.07 | 29.98 ± 0.1| | |
| D90 (µm) | 21.54 ± 0.12 | 46.59 ± 1.11| | |
| D4,3 (µm) | 13.68 ± 0.07 | 31.75 ± 0.27| | |
| D3,2 (µm) | 7.09 ± 0.02 | 28.42 ± 0.02| | |
| R1047/1022 | 0.616 ± 0.003 | 0.777 ± 0.005| | |
| R995/1022 | 0.392 ± 0.004 | 0.475 ± 0.003| | |
| Total oil absorption (%) | 51.17 ± 1.75 | 46.33 ± 1.15| | |
| Total water absorption (%) | 62.67 ± 2.31 | 77.33 ± 1.53| | |
| To (℃) | 61.47 ± 0.25 | 57.93 ± 0.06| | |
| Tp (℃) | 65.33 ± 0.23 | 61.40 ± 0.17| | |
| Tc (℃) | 71.53 ± 0.84 | 66.70 ± 0.26| | |
| ΔH (J/g) | 13.19 ± 0.12 | 13.26 ± 0.16 | |
| ΔT (℃) | 10.07 ± 0.64 | 8.77 ± 0.25| | |
Fourier transform infrared spectroscopy (FT-IR) analysis shows the spectra of starch (Fig. 1C), where the broad peak around 3373 cm−1 is associated with the O—H stretching vibration of hydroxyl groups, with its broadness primarily due to hydrogen bonding. The characteristic absorption peak at 2925 cm−1 is attributed to the C—H stretching vibration, while the absorption peak at 1646 cm−1 corresponds to the bending vibration of O—H in water molecules within the starch. The band at 1162 cm−1 is related to the asymmetric vibration of C—O—C bonds, and the characteristic peak near 1085 cm−1 is associated with C—O stretching vibrations [14,15]. Among these peaks, different types of starch exhibit significant intensity differences. Fourier deconvolution was performed in the range of 1200–800 cm−1 to enhance the identification of distinct structural features. The peaks at 1047 and 1022 cm−1 correspond to the ordered and amorphous structures of starch, respectively, while the peak at 995 cm−1 is related to intramolecular hydrogen bonding. The R1047/1022 ratio serves as an indicator of short-range order within starch granules, while the R995/1022 ratio reflects the amorphous content [16]. As shown in Table 2, SGS has higher R1047/1022 and R995/1022 values compared to PMS, indicating a more ordered double-helical structure in SGS.
X-ray diffraction (XRD) analysis shows that patterns and relative crystallinity (RC) of the starches reveal distinct crystalline features (Fig. 1D and Table 2). PMS starch exhibits prominent diffraction peaks at 2θ values of 15.18°, 17.12°, 18.08°, and 23.02°, reflecting its A-type crystalline structure. In contrast, SGS starch shows characteristic peaks of the B-type crystalline structure at 2θ values of 5.68°, 17.16°, 22.18°, and 24.02°, a structure commonly found in tuber and root starches such as potato starch and typically associated with high enzyme resistance [17]. Additionally, the RC of PMS and SGS are 41.71% and 50.66%, respectively, indicating a greater crystalline region in SGS compared to PMS, consistent with the FT-IR results (Table 2). The observed RC differences may be related to factors such as particle size, moisture content, amylose content, and crystal structure. PMS has smaller particles with a larger specific surface area, which may contribute to an increase in amorphous regions and consequently reduce crystallinity; higher moisture content might also interfere with structural stability. Furthermore, research has shown a generally negative correlation between starch RC and amylose content [18], yet in this study, despite SGS having a higher amylose content than PMS (Table 1), it still exhibits higher crystallinity. The tightly packed molecular arrangement and high density of the B-type structure may confer higher crystallinity characteristics on SGS to some extent.
A high-performance anion-exchange chromatography system was to analysis chain length (CL) distribution (CLD), which is a critical parameter influencing starch gelatinization, retrogradation, crystallinity, and other physicochemical and functional properties. Based on the degree of polymerization (DP), CLD is generally divided into four categories: fa (DP 6–12), fb1 (DP 13–24), fb2 (DP 25–36), and fb3 (DP ≥ 37). Among these, fa chains represent the outermost chains of fb1-chains, which are relatively short and connected mainly by α−1,6 glycosidic bonds. In contrast, fb2 and fb3 chains are longer and prone to forming double-helical structures, significantly contributing to the crystalline properties of starch [19]. As shown in Figs. 1E and F, SGS has a higher proportion of long-chain amylopectin, correlating with increased crystallinity, as confirmed by XRD results. The average CL of PMS and SGS were 20.21 and 20.58, respectively. This suggests greater molecular order and structural stability in PMS and SGS, enhancing their potential applications. The short-to-long chain (S/L) ratio, indicating the degree of amylopectin branching, is another important parameter. Higher S/L ratios reflect greater branching. PMS and SGS have S/L ratios of 0.39 and 0.37, respectively, suggesting a higher degree of branching. This higher branching may influence their functional properties, including gelatinization and retrogradation resistance.
Swelling power (SP) represents the water-holding capacity of starch, while water solubility (WS) indicates the degree of starch dissolution during the swelling process. Figs. 2A and B illustrate the SP and WS of the two starches at different temperatures. As shown, both SP and WS increase with rising temperature. At 55 ℃, both SP and WS are relatively low; however, after 65 ℃, both parameters increase significantly with further temperature elevation, reaching their maximum values at 95 ℃. A similar trend was observed by Guo et al. [20] in sweet potato starch, which could be attributed to the disruption of crystalline regions in starch during heating. This disruption breaks hydrogen bonds, allowing water molecules to bind to free hydroxyl groups through hydrogen bonding, thereby increasing the swelling capacity of starch granules. Apart from heating temperature, SP and WS are also influenced by other factors, such as amylose content, crystalline structure, and molecular weight distribution. PMS exhibits significantly higher WS than SGS, possibly due to its lower amylose content and reduced crystallinity. Lower amylose content diminishes the restriction on starch swelling, allowing greater dissociation of amylopectin double helices and facilitating the expansion of starch granules [21]. Starch granules with lower crystallinity tend to absorb more water and swell to a greater extent. Additionally, PMS exhibits higher SP than SGS, which may be due to differences in CLD.
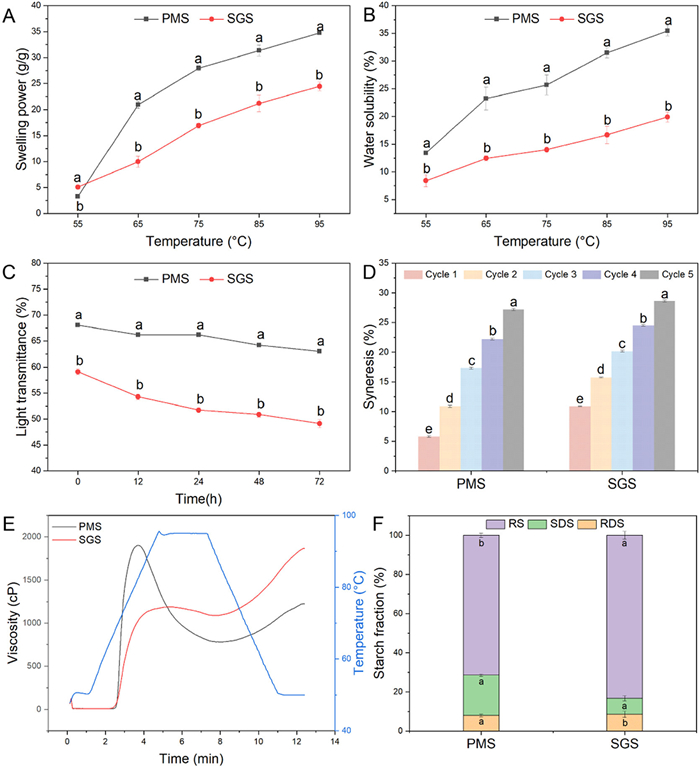
Light transmittance reflects the transparency of starch pastes. As shown in Fig. 2C, both starch pastes showed decreased transmittance with increased storage time, likely due to starch retrogradation. SGS exhibited lower transmittance than PMS, likely due to its higher amylose content, which negatively correlates with transmittance. Additionally, the smaller granule size of PMS leads to a more uniform suspension, reducing light scattering and slowing the decrease in transmittance during storage. The smaller granules also facilitate amylose leaching, further slowing transmittance reduction.
Freeze-thaw stability refers to the ability of a starch paste to maintain its structure and functional properties after repeated cycles of freezing and thawing, with water separation (syneresis) as the evaluation criterion. Lower syneresis indicates better freeze-thaw stability. As shown in Fig. 2D, syneresis in both PMS and SGS significantly increased with the number of freeze-thaw cycles, indicating a gradual decline in freeze-thaw stability. During the freeze-thaw process, the gel structure of the starch is disrupted, causing water to separate and resulting in a loose paste consistency. This occurs because starch molecules are primarily linked through hydrogen bonds, and as freeze-thaw cycles progress, intermolecular interactions strengthen. Starch chains gradually align in parallel, forming gel bundles that expel water from the gel matrix [22]. These results indicate that with each freeze-thaw cycle, retrogradation and water loss in starch intensify. Fig. 2D also shows that PMS exhibits better freeze-thaw stability, likely due to its lower amylose content. Amylose, with its minimal spatial hindrance in chain structure, readily undergoes rearrangement and association, leading to water separation and precipitation, which in turn reduces the freeze-thaw stability of the starch paste.
The total oil and water absorption properties of the starches are shown in Table 2. The higher oil absorption of PMS (51.17%) compared to SGS (46.33%) is likely due to its lower amylose content. Amylose's double-helical structure may expose hydrophobic sites, facilitating interactions with non-polar substances like oils. Additionally, the larger D50 value of SGS could contribute to this difference, suggesting that limited expansion of starch granules strengthens hydration in the amorphous layer on the granule surface, leading to an inverse relationship between D50 and oil absorption [23]. Furthermore, water absorption in these starch samples is negatively correlated with oil absorption, consistent with previous findings [24].
Differential scanning calorimetry (DSC) analysis was used to evaluate the gelatinization properties of the starch samples (Table 2). Compared to SGS, PMS exhibits higher onset (To), peak (Tp), and conclusion (Tc) temperatures. Smaller granules typically have higher gelatinization temperatures due to increased resistance to rupture and greater stability against molecular degradation [25]. Additionally, B-type starch gelatinizes faster than A-type starch, and a higher protein content forms a barrier, reducing water absorption and increasing gelatinization temperatures [26]. The gelatinization enthalpy (ΔH) reflects starch crystallinity loss during gelatinization. The higher ΔH of SGS indicates greater crystallinity and more structured starch granules, as shown by the XRD results. The gelatinization temperature range (ΔT) reflects crystalline integrity; a higher ΔT value suggests greater heterogeneity in crystalline structures, with less interaction between amylopectin and amylose. PMS and SGS differ in their crystalline stability, with PMS showing lower ΔT values, indicating more stable crystalline structures.
The pasting curves and parameters of the starch samples are shown in Fig. 2E and Table 3. The pasting temperatures (PTs) of PMS (68.48 ℃) and SGS (68.43 ℃), measured by rapid visco analyser (RVA), are slightly higher than the Tp values from DSC analysis. This discrepancy may result from differences in detection methods: DSC measures thermal transitions under sealed conditions, while RVA monitors changes during heating and stirring in a hydrated system. Peak viscosity (PV) reflects maximum water absorption. PMS shows higher PV than SGS, likely due to SGS's higher amylose content, which forms a tighter gel network, limiting granule swelling and water uptake. This may also be influenced by SGS's lower proportion of fa chains, as pasting properties depend on CLD [5]. Trough viscosity (TV) indicates paste stability after breakdown, and breakdown viscosity (BV) measures resistance to heat and shear. SGS demonstrates greater heat and shear resistance, suggesting better high-temperature performance. Higher BV also correlates with lower enzymatic resistance [27], consistent with SGS's higher RS content (Fig. 2E). Final viscosity (FV) represents viscosity increase during cooling, while setback viscosity (SV) assesses retrogradation potential. PMS shows lower SV, indicating stronger anti-retrogradation properties, which are beneficial for applications in refrigerated or frozen products.
DownLoad:
CSV
| Samples | PT (℃) | PV (cP) | TV (cP) | BV (cP) | FV (cP) | SV (cP) |
| PMS | 68.48 ± 0.03a | 1982 ± 87a | 801 ± 19b | 1181 ± 69a | 1261 ± 37b | 460 ± 18b |
| SGS | 68.43 ± 0.03a | 1195 ± 14b | 1097 ± 9a | 98 ± 6b | 1886 ± 25a | 789 ± 16a |
| Note: Value with different superscripts (a, b) within the same column differ significantly at P < 0.05. | ||||||
To further evaluate their functional potential, in vitro digestion and anaerobic fermentation were performed according to established protocols (Supporting information, Sections 2.7 and 2.8). Starch can be classified into rapidly digestible starch (RDS), slowly digestible starch (SDS), and RS, based on digestion speed and extent. RDS causes rapid glucose spikes, while SDS provides slow, sustained glucose release. RS reaches the colon, where it is fermented by gut microbiota, producing short-chain fatty acids and acting similarly to dietary fiber. The in vitro digestibility of starch is influenced by factors such as source, particle size, amylose content, crystallinity, and molecular structure. The RDS, SDS, and RS contents of PMS and SGS are shown in Fig. 2F. The difference in RS content between PMS (71.45%) and SGS (83.28%) highlights SGS's lower digestibility, likely due to its B-type crystallinity and higher RC. RS content is positively correlated with amylose content, and the smaller particle size of PMS enhances enzyme interaction and digestion [28]. The higher RS content in SGS compared to PMS indicates slower enzymatic digestibility, potentially enhancing colonic fermentation. This property suggests that SGS could be a promising candidate for developing functional ingredients.
Studies suggest that digestive enzymes can penetrate A-type crystalline starch through "inside-out" and "side-by-side" patterns, while B-type starch lacks surface pores, leading to an "outside-in" digestion mode, where enzymes must attach to the surface and diffuse inward [5]. Consequently, A-type starch is digested faster. Scanning electron microscope (SEM) results (Fig. 3A) confirmed these findings, showing that after in vitro digestion and fermentation, A-type starch formed a layered hollow structure, while the surface of B-type starch exhibited signs of corrosion. No new diffraction peaks were observed in the spectra of any sample group (Fig. 3B), indicating the absence of newly formed functional groups during the process. After in vitro digestion and fermentation, the intensity of the broad absorption peak at 3391 cm−1 (corresponding to O–H stretching vibrations in starch molecules) and the peak at 1640 cm−1 (associated with adsorbed water in amorphous regions) decreased significantly, reflecting reduced moisture content and loosened molecular packing. Additionally, the marked attenuation of the absorption peak at 1000 cm−1 (attributed to C–OH vibrations of glycosidic bonds) further confirmed a decline in starch molecular order. These changes originated from the disruption of intermolecular hydrogen bonds in PMS and SGS by thermal treatment, enzymatic hydrolysis, and gut microbiota decomposition, leading to a transition from tightly packed to disordered molecular configurations, consistent with findings by Lu et al. [29].
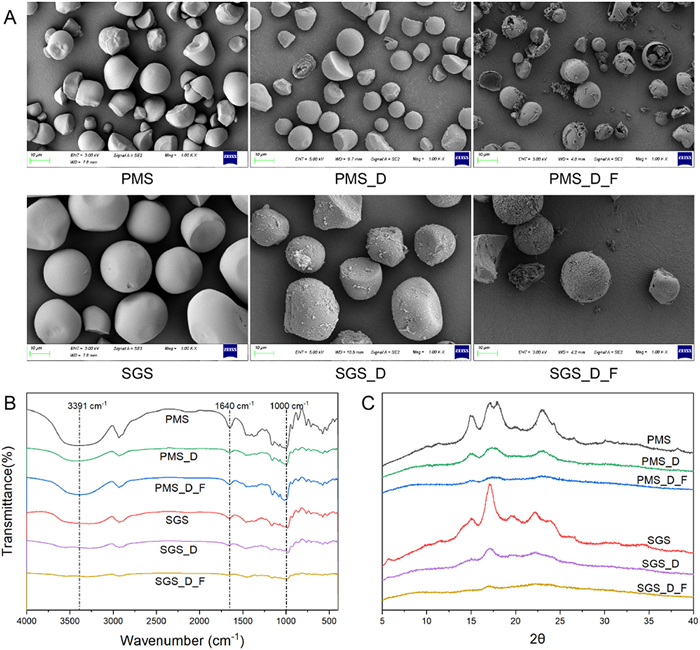
As shown in Fig. 3C, all samples exhibited a significant reduction in crystallinity post-digestion-fermentation, aligning with the decreased molecular order observed in FT-IR analysis. This phenomenon primarily stems from the non-selective degradation of both crystalline and amorphous regions by digestive enzymes, which progressively unravel and cleave molecular chains, ultimately collapsing the crystalline structure. Notably, SGS_D_F retained higher crystallinity (9.64%) compared to PMS_D_F (5.63%), likely due to the denser surface-ordered architecture of B-type starch granules in SGS, which partially resists enzymatic degradation and preserves crystalline integrity. Wang et al. [30] demonstrated that local density, rather than molecular orientation (e.g., amorphous vs. crystalline regions), governs enzymatic hydrolysis efficiency. A-type starch granules, characterized by thin shells and numerous micropores, offer increased surface area and enzyme-binding sites, thus accelerating catalytic rates. In contrast, the smooth and dense outer layer of B-type starch granules acts as a barrier, impeding enzyme accessibility and slowing degradation. Additionally, the smaller particle size of PMS enhances enzyme interaction and digestion and fermentation by providing a larger surface area for enzymes to bind, leading to faster breakdown. In contrast, SGS's denser and smoother granule surface restricts enzyme access, slowing the digestion and fermentation process.
This study reveals that the crystallinity and particle morphology of PMS and SGS starch granules are key factors determining their performance during digestion and fermentation. SGS is rich in RS, making it a promising functional ingredient capable of effectively regulating hyperglycemia and improving blood glucose management. Due to its smaller particle size and ease of degradation, PMS shows great potential for application in biodegradable materials and pharmaceutical excipients. These findings highlight the close relationship between the physicochemical properties and functionality of medicinal plant starches, providing valuable insights into their potential applications in functional ingredients and the biopharmaceutical field.
The authors declare that they have no known competing financial interests or personal relationships that could have appeared to influence the work reported in this paper.
Nan Wang: Writing – review & editing, Writing – original draft, Software, Resources, Methodology, Data curation. Lingling Wu: Software, Resources, Methodology, Formal analysis. Yaya Su: Validation, Software, Resources, Methodology. Haifeng Tang: Writing – review & editing, Validation, Resources, Conceptualization. Hailong Yuan: Writing – review & editing, Project administration, Funding acquisition, Conceptualization.
This work was supported by the National Natural Science Foundation of China (No. 82174074). The authors would like to thank Zhang San from Shiyanjia Lab (
Supplementary material associated with this article can be found, in the online version, at doi:
C.D. Chi, X.X. Li, Y.P. Zhang, et al., Food Hydrocoll. 113 (2021) 106447. doi: 10.1016/j.foodhyd.2020.106447
J.X. Ma, J.Z. He, X.T. Kong, et al., Chin. Chem. Lett. 34 (2023) 107407. doi: 10.1016/j.cclet.2022.04.005
H.H. Huang, Y.P. Wang, X. Li, et al., Starch 68 (2016) 909–918. doi: 10.1002/star.201500218
N. Wang, C. Zhang, H.X. Li, et al., Int. J. Biol. Macromol. 258 (2024) 128993. doi: 10.1016/j.ijbiomac.2023.128993
J.W. Aaps PharmscitechQian, C.H. Feng, Z.Y. Wu, et al., Front. Pharmacol. 15 (2024) 1427019. doi: 10.3389/fphar.2024.1427019
H. Wu, Y. Wang, B. Zhang, et al., Drug Des. Devel. Ther. 16 (2022) 3621–3643. doi: 10.2147/DDDT.S374439
Y.Z. Wang, J.P. Ral, L. Saulnier, et al., Foods 11 (2022) 1223. doi: 10.3390/foods11091223
S. Dhital, A.K. Shrestha, M.J. Gidley, Carbohydr. Polym. 82 (2010) 480–488. doi: 10.1016/j.carbpol.2010.05.018
R. Tahir, P.R. Ellis, P.J. Butterworth, Carbohydr. Polym. 81 (2010) 57–62. doi: 10.1016/j.carbpol.2010.01.055
K. Kansou, A. Buléon, C. Gérard, et al., Carbohydr. Polym. 133 (2015) 497–506. doi: 10.1016/j.carbpol.2015.07.042
M. Milkias, S.A. Emire, W. Abebe, et al., Molecules 28 (2023) 7260. doi: 10.3390/molecules28217260
C.K. Nagar, S.K. Dash, K. Rayaguru, et al., Int. J. Biol. Macromol. 192 (2021) 574–589. doi: 10.1016/j.ijbiomac.2021.10.041
F. Jiang, C.W. Du, Y. Guo, et al., Food Hydrocoll. 101 (2020) 105515. doi: 10.1016/j.foodhyd.2019.105515
R.B. Li, H.T. Tao, C.P. Tan, et al., Food Hydrocoll. 148 (2024) 109448. doi: 10.1016/j.foodhyd.2023.109448
U.S. Malik, Q.X. Duan, M.B.K. Niazi, et al., Chin. Chem. Lett. 34 (2023) 108071. doi: 10.1016/j.cclet.2022.108071
M.S. Dorneles, E.S.D. Azevedo, C.P.Z. Norena, Food Hydrocoll. 150 (2024) 109639. doi: 10.1016/j.foodhyd.2023.109639
J. Xia, D. Zhu, R.M. Wang, et al., Theor. Appl. Genet. 131 (2018) 2495–2511. doi: 10.1007/s00122-018-3221-4
Y. Li, K.I. Shabani, H.B. Liu, et al., Food Struct. Neth. 25 (2020) 100148. doi: 10.1016/j.foostr.2020.100148
S. Li, Q.Y. Li, F.B. Zhu, et al., Food Hydrocoll. 124 (2022) 107198. doi: 10.1016/j.foodhyd.2021.107198
M. Gou, H. Wu, A.S.M. Saleh, et al., Int. J. Biol. Macromol. 129 (2019) 869–877. doi: 10.1016/j.ijbiomac.2019.01.225
B.B. Zhao, S.W. Sun, H. Lin, et al., Ultrason. Sonochem. 52 (2019) 50–61. doi: 10.1016/j.ultsonch.2018.11.001
J.H. Liu, B. Wang, L. Lin, et al., Food Hydrocoll. 36 (2014) 45–52. doi: 10.1016/j.foodhyd.2013.08.013
S.M. Xie, Z.H. Li, Q.F. Duan, et al., Food Hydrocoll. 150 (2024) 109701. doi: 10.1016/j.foodhyd.2023.109701
S.Y. Zhang, Q. Li, Y. Zhao, et al., Food Chem. X 15 (2022) 100410. doi: 10.1016/j.fochx.2022.100410
K.O. Falade, C.A. Okafor, Food Hydrocoll. 30 (2013) 173–181. doi: 10.1016/j.foodhyd.2012.05.006
B.P. Costa, D. Carpine, F.E. da Silva Bambirra Alves, et al., J. Therm. Anal. Calorim. 147 (2022) 6721–6737. doi: 10.1007/s10973-021-10965-2
Z. Zhang, A.S.M. Saleh, H. Wu, et al., Starch 72 (2020) 1900122. doi: 10.1002/star.201900122
X.L. Wu, M.Y. Wang, R. Liu, et al., J. Food Sci. 89 (2024) 4123–4135. doi: 10.1111/1750-3841.17171
X.X. Lu, R.R. Ma, J.L. Zhan, et al., Food Hydrocoll. 149 (2024) 109576. doi: 10.1016/j.foodhyd.2023.109576
S.K. Wang, S. Dhital, K. Wang, et al., Carbohydr. Polym. 263 (2021) 118003. doi: 10.1016/j.carbpol.2021.118003

Figure 1 Flowchart of the starch extraction process (A), SEM images at 1000× magnification (B), FT-IR spectra (C), X-ray diffraction patterns (D), CLD (E, F) of PMS and SGS.

Figure 2 The SP (A), WS (B), light transmittance (C), and syneresis (D) Pasting properties (E) and in vitro digestibility (F) of PMS and SGS.

Figure 3 Structural evolution of PMS and SGS during in vitro digestion-fermentation: (A) SEM images at 1000×, (B) FT-IR, and (C) XRD.
Table 1. Yield, chemical composition and color of PMS and SGS. L*-(lightness/whiteness); a*-(greenness/redness); b*-(blueness/yellowness); ΔE-(total color difference).
| Sample | PMS | SGS |
| Yield (%) | 10.32 | 13.11 |
| Moisture (%) | 11.28 ± 0.34 | 7.47 ± 0.16| |
| Ash (%) | 0.49 ± 0.05 | 0.02 ± 0.01| |
| Protein (%) | 1.31 ± 0.07 | 0.06 ± 0.01| |
| Fat (%) | 0.03 ± 0.01 | 0.05 ± 0.01| |
| Starch (%) | 88.81 ± 0.53 | 90.87 ± 0.46| |
| Amylose ratio (%) | 14.63 ± 0.49 | 21.54 ± 0.73| |
| Color L* | 96.17 ± 0.02 | 93.76 ± 0.24| |
| Color a* | 0.48 ± 0.02 | 0.07 ± 0.02| |
| Color b* | 1.90 ± 0.02 | 2.02 ± 0.02| |
| Color ΔE | 96.19 ± 0.02 | 93.78 ± 0.24| |
 下载: 导出CSV
Table 2. Structural and thermal properties of starch samples.
| Sample | PMS | SGS | |
| RC (%) | 41.71 ± 0.26 | 50.66 ± 0.34| | |
| Crystal pattern | A | B | |
| Particle size | D10 (µm) | 7.08 ± 0.05 | 19.4 ± 0.29| |
| D50 (µm) | 13.38 ± 0.07 | 29.98 ± 0.1| | |
| D90 (µm) | 21.54 ± 0.12 | 46.59 ± 1.11| | |
| D4,3 (µm) | 13.68 ± 0.07 | 31.75 ± 0.27| | |
| D3,2 (µm) | 7.09 ± 0.02 | 28.42 ± 0.02| | |
| R1047/1022 | 0.616 ± 0.003 | 0.777 ± 0.005| | |
| R995/1022 | 0.392 ± 0.004 | 0.475 ± 0.003| | |
| Total oil absorption (%) | 51.17 ± 1.75 | 46.33 ± 1.15| | |
| Total water absorption (%) | 62.67 ± 2.31 | 77.33 ± 1.53| | |
| To (℃) | 61.47 ± 0.25 | 57.93 ± 0.06| | |
| Tp (℃) | 65.33 ± 0.23 | 61.40 ± 0.17| | |
| Tc (℃) | 71.53 ± 0.84 | 66.70 ± 0.26| | |
| ΔH (J/g) | 13.19 ± 0.12 | 13.26 ± 0.16 | |
| ΔT (℃) | 10.07 ± 0.64 | 8.77 ± 0.25| | |
下载: 导出CSV
Table 3. The pasting properties of starches.
| Samples | PT (℃) | PV (cP) | TV (cP) | BV (cP) | FV (cP) | SV (cP) |
| PMS | 68.48 ± 0.03a | 1982 ± 87a | 801 ± 19b | 1181 ± 69a | 1261 ± 37b | 460 ± 18b |
| SGS | 68.43 ± 0.03a | 1195 ± 14b | 1097 ± 9a | 98 ± 6b | 1886 ± 25a | 789 ± 16a |
| Note: Value with different superscripts (a, b) within the same column differ significantly at P < 0.05. | ||||||
下载: 导出CSV

 扫一扫看文章

扫一扫关注我们
 下载:
下载: