Citation:
Mengyu Cao, Yiyan Yin, Jingyi Qin, Jin Ouyang, Na Na. Unconventional application of a fluorescent probe for MS-based detection of multiple sulfur species in ferroptosis[J]. Chinese Chemical Letters,
2026, 37(1): 111260.
doi:
10.1016/j.cclet.2025.111260
Unconventional application of a fluorescent probe for MS-based detection of multiple sulfur species in ferroptosis
English
Unconventional application of a fluorescent probe for MS-based detection of multiple sulfur species in ferroptosis
Country Key Laboratory of Radiopharmaceuticals, Ministry of Education, College of Chemistry, Beijing Normal University, Beijing 100875, China
b.
Department of Chemistry, Faculty of Arts and Sciences, Beijing Normal University, Zhuhai 519087, China
* Corresponding author. E-mail address: nana@bnu.edu.cn (N. Na).
Received Date:
01 February 2025 Accepted Date:
25 April 2025 Revised Date:
15 April 2025 Available Online:
15 January 2026
Abstract:
Ferroptosis has exhibited great potential in therapies and intracellular reducing agents of sulfur species (RSSs) in the thiol-dependent redox systems are crucial in ferroptosis. This makes the simultaneous detection of multiple RSSs significant for evaluating ferroptosis therapy. However, the traditional techniques, including fluorescent (FL) imaging and electrospray ionization-based mass spectrometry (MS) detection, cannot achieve the discrimination of different RSSs. Herein, simultaneous MS detection of multiple RSSs, including cysteine (Cys), homocysteine (Hcy), glutathione (GSH) and hydrogen sulfide (H2S), was obtained upon enhancing ionization efficiency by a fluorescent probe (NBD-O-1). Based on the interaction between NBD-O-1 and RSSs, the complex of RSSs with a fragment of NBD-O-1 can be generated, which can be easily ionized for MS detection in the negative mode. Therefore, the intracellular RSSs can be well detected upon the incubation of HeLa cells with the probe of NBD-O-1, exhibiting the total RSS levels by the FL imaging and further providing expression of each RSS by enhanced MS detection. Furthermore, the RSSs during ferroptosis in HeLa cells have been evaluated using the present strategy, demonstrating the potential for ferroptosis examinations. This work has made an unconventional application of a fluorescent probe to enhance the detection of multiple RSSs by MS, providing significant molecular information for addressing the ferroptosis mechanism.
As a distinctive form of iron-dependent and non-apoptotic cell death, ferroptosis has attracted great interest within the fields of life sciences and medicine [1–3]. Involving various diseases (particularly cancer, neurological disorders and conditions linked to ischemia-reperfusion injury) [4–9], ferroptosis has exhibited great potential in therapies [10–16] and a comprehensive understanding of ferroptosis is crucial for ferroptosis-based applications [17]. Normally, ferroptosis is recognized as a complex oxidative-reductive imbalance, involving iron regulation, mitochondrial function, and metabolisms of amino acids, lipids and glucose [18–20]. Especially, intracellular reducing agents of sulfur species (RSSs) in the thiol-dependent redox systems are crucial in ferroptosis, including hydrogen sulfide (H2S) and biothiols, including cysteine (Cys), homocysteine (Hcy), and glutathione (GSH) [21,22]. For instance, the depletion of Cys can lead to ferroptosis in pancreatic tumors, and the GSH level in pancreatic ductal adenocarcinoma cells decreases rapidly [23]. Besides, ferroptosis can also inhibit the cystine/glutamate transporter (system xc−) to reduce Cys uptake, thereby leading to the consumption of H2S [24] due to the generation of endogenous H2S from Cys, catalyzed by cys-tathionine γ lyase or cystathionine β synthase [25]. Therefore, the simultaneous detection of multiple sulfur species in ferroptosis is significant not only for evaluating ferroptosis therapy but also for exploring regulating mechanisms involved in ferroptosis.
However, the simultaneous detection of multiple sulfur species in a complex biological system is still challenging. Fluorescence (FL) imaging is a common strategy for investigating molecular-level changes in RSSs within cells [26–29]. With high sensitivity, real-time monitoring capabilities and non-destructive imaging properties [30–33], FL imaging has been applied to evaluate ferroptosis-related RSSs, such as Cys and GSH [34–38]. However, the selective detection of Cys, Hcy and GSH is still a challenge due to their similarity in the structures and activities [37]. Taking the traditional fluorescent detection as an example, the multi-channel fluorescent detection of RSSs encounter difficulties due to their broad emission bands and inevitable spectral cross-interference that occurs during imaging. Alternatively, electrospray ionization mass spectrometry (ESI-MS) is highly effective for acquiring structural information of multiple species simultaneously [39–41]. However, RSSs are normally detected in the negative mode and the traditional ionization efficiency is not satisfied enough for RSS detections in intricate cellular environments. Consequently, the enhancement of MS-based simultaneous detections of multiple intracellular RSSs in negative mode is pursued.
Herein, simultaneous MS detection of multiple RSSs, including H2S, Cys, Hcy and GSH, was obtained upon enhancing ionization efficiency by a fluorescent probe. The fluorescent probe of NBD-O-1 [42], showing similar emissions for Hcy/Cys and GSH/H2S, was selected to enhance the selective and sensitive detection of four RSSs by MS in the negative mode. Although NBD-O-1 cannot discriminate Hcy/Cys and GSH/H2S by FL imaging, it can facilitate ionization for the simultaneous detection of four RSSs by ESI-MS. Thereby, the model of ferroptosis was constructed by incubating a ferroptosis inducer with HeLa cells. The total levels of RSSs in the cells were evaluated through FL imaging, and each RSS was detected simultaneously using MS upon enhanced ionization with NBD-O-1. Therefore, this work has made an unconventional application of a fluorescent probe to enhance the detection of multiple RSSs by MS detections, providing significant information for understanding RSS-based mechanisms in ferroptosis.
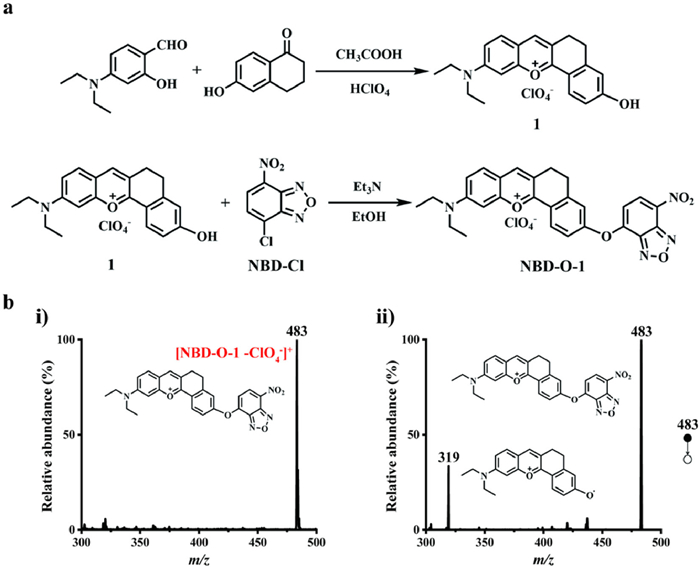
To facilitate the detection of RSSs, the recognition site of nitro benzoxadiazol chromophore (NBD) was selected to construct a fluorescent probe [42] for evaluating total RSSs and the subsequent enhanced detections by ESI-MS in the negative mode. Briefly (Fig. 1a), a red lipophilic cationic dye of compound 1 was prepared by a simple one-step reaction. Subsequently, NBD was connected with compound 1 to obtain the probe of NBD-O-1, ensuring the amphiphilic properties to facilitate its interaction with live cells for biological applications. This preparation of the fluorescent probe was confirmed by ESI-MS detections. For the detection of NBD-O-1 by ESI-MS (Fig. 1b-i), a significant ion of [NBD-O-1-ClO4−]+ at m/z 483 was recorded in positive ion mode. The structure was further verified through collision-induced dissociation (CID) experiments (Fig. 1b-ii). Besides, the structures of compound 1 and NBD-O-1 were also confirmed through 1H NMR and 13C NMR characterizations (Fig. S1 in Supporting information).
Figure 1
Figure 1.
The preparation and characterization of the fluorescent probe of NBD-O-1. (a) The illustration on the synthesis of NBD-O-1. (b) ESI-MS characterizations. (i) MS spectrum of NBD-O-1 at positive ion mode. (ii) MS/MS spectrum of the ion [NBD-O-1-ClO4−]+ at m/z 483.
To evaluate the performance of the fluorescent probe for detecting RSSs, the UV–vis spectra of NBD-O-1 with the addition of different RSSs were first investigated. When Cys and Hcy were added to the NBD-O-1 solution, there was a similar significant increase in absorption at 580 nm, along with the appearance of new peaks at 470 nm (Fig. S2 in Supporting information). While the addition of GSH and H2S to the NBD-O-1 solution only resulted in an increase in absorption at 580 nm. Consequently, similar absorptions for Cys/Hcy or GSH/H2S were exhibited, which would facilitate the RSSs detection upon the excitation at ~580 nm or 470 nm.
Subsequently, the fluorescent spectra of the probe of NBD-O-1 with adding four RSSs respectively were collected using a fluorescence spectrometer. Under the irradiation at 480 nm (Fig. 2a), the significantly increased FL emission at 550 nm was observed with Cys and Hcy added. In addition, the increases of FL peaks at 625 nm were also observed for the four RSSs in different degrees. Similarly, under the excitation at 585 nm, the increased FL responses were also recorded for the four RSSs (Fig. 2b). Besides, the response selectivity for the four RSSs was evaluated by comparing the FL signals with adding different cell coexisting anions and amino acids into the NBD-O-1 solution. Under the irradiation at 480 nm (Fig. 2c), significant FL responses were recorded after adding RSSs, while no obvious signal was collected for other species. Similarly, irritated at 585 nm, the FL responses of four RSSs were much higher than other species (Fig. 2d). Therefore, the probe of NBD-O-1 exhibits excellent selectivity for RSSs. Furthermore, the pH-dependence (Fig. S3 in Supporting information) and kinetics of FL responses (Figs. 2e and f) were also examined, revealing the possibility of the probe for RSSs detection. However, the discrimination of each RSS cannot be determined based on these similar FL responses, which show analogous emissions for Cys/Hcy and GSH/H2S. Consequently, further strategies for distinguishing and detecting each RSS are being pursued.
Figure 2
Figure 2.
The detection of RSSs by NBD-O-1 probe. Fluorescence spectra of NBD-O-1 with adding different RSSs, under the irradiation at λex = 480 nm (a) and λex = 585 nm (b), respectively. Selectivity of NBD-O-1 to various species, under the irradiation at λex = 480 nm (c) and λex = 585 nm (d), respectively. (e) Time-dependent fluorescence intensity of NBD-O-1 at 550 nm in the presence of Cys and Hcy, λex=480 nm. (f) Time-dependent fluorescence intensity of NBD-O-1 at 625 nm in the presence of GSH and H2S, λex = 585 nm.
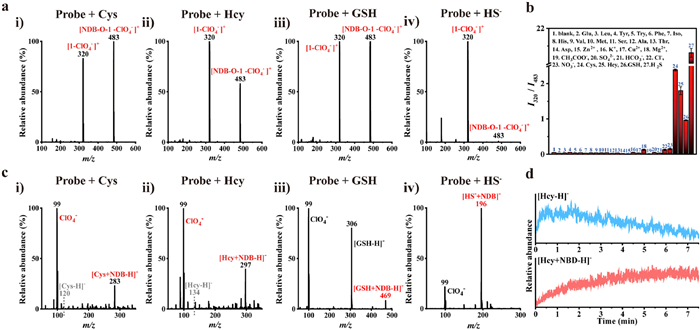
Since FL-based detection cannot realize the discrimination of four RSSs, the four RSSs including Cys, Hcy, GSH and H2S were further detected by MS. The detection was initially carried out in the positive ion mode. Considering no obvious ion was observed for detecting four RSSs in the positive ion mode, the probe was added to further evaluate the detection performance. However, only the probe characteristic ions of [NBD-O-ClO4−]+ at m/z 483 and [1-ClO4−]+ at m/z 320 were recorded for all the RSSs with NBD-O-1 added (Fig. 3a). Interestingly, the intensity ratios of the ions at m/z 320 to m/z 483 exhibited good selectivity for RSSs compared to other species (Fig. 3b). This was generated from the cleavage of the probe of NBD-O-1 at the ether bond site upon the interactions with RSSs. However, different RSSs still cannot be obtained by MS detection in the positive mode.
Figure 3
Figure 3.
The detection of RSSs by ESI-MS with NBD-O-1 added. (a) The mass spectra of Cys (i), Hcy (ii), GSH (iii), and HS− (iv) with NBD-O-1 added in the positive mode. (b) The intensity ratios of the characteristic ions of [1-ClO4−]+ (at m/z 320) to [NBD-O-1-ClO4−]+ (at m/z 483) for different species with NBD-O-1 added. (c) The mass spectra of Cys (i), Hcy (ii), GSH (iii), and HS− (iv) with NBD-O-1 added in the negative mode. (d) Online monitoring of the ion signals of Hcy with NBD-O-1 added in the negative mode.
Subsequently, the detection of four RSSs was carried out in the negative ion mode. For the detection, the mixture of four RSSs was prepared to reach the concentration of 10 µmol/L for each species, which was subjected for the detection by the present method in the negative mode. Without any additive added, the detection performance was not satisfied, which only exhibited the significant ion of GSH at m/z 306, and no obvious signals of [Cys-H]− (at m/z 120) and [Hcy-H]− (at m/z 134) were observed (Fig. S4 in Supporting information). Thereafter, the fluorescent probe of NBD-O-1 (10 µmol/L) was added for the detection. As demonstrated in Fig. 3c, the significant characteristic ions of four RSSs can all be recorded upon the interaction with NBD-O-1. Briefly, the characteristic ions of [Cys+NBD-H]− at m/z 283 (Fig. 3c-i), [Hcy+NBD-H]− at m/z 297 (Fig. 3c-ii), [GSH+NBD-H]− at m/z 469 (Fig. 3c-iii) and [HS−+NBD]− at m/z 196 (Fig. 3c-iv) were well recorded with adding NBD-O-1 into RSS solutions of Cys, Hcy, GSH and H2S, respectively. The corresponding ion structures were confirmed by the CID experiments (Fig. S5 in Supporting information). Besides, the dynamic changes of the ions of the RSS complex were also collected by the MS online monitoring (Fig. 3d and Fig. S6 in Supporting information), demonstrating the enhancement of MS signals is attributed to the interaction between RSSs and NBD-O-1. As deduced, these ions were generated from ion-molecule reactions between RSSs and −NBD-H, which were obtained from the decomposition of NBD-O-1 upon interaction with RSSs. Besides, the product of the decomposition of the probe was also recorded during the detection of four RSSs, showing the significant ion of ClO4− at m/z 99. In fact, another important product of 1 was also generated, which was in accordance with observing of the characteristic ion of [1-ClO4−]+ at m/z 320 in the positive mode (Fig. 3a).
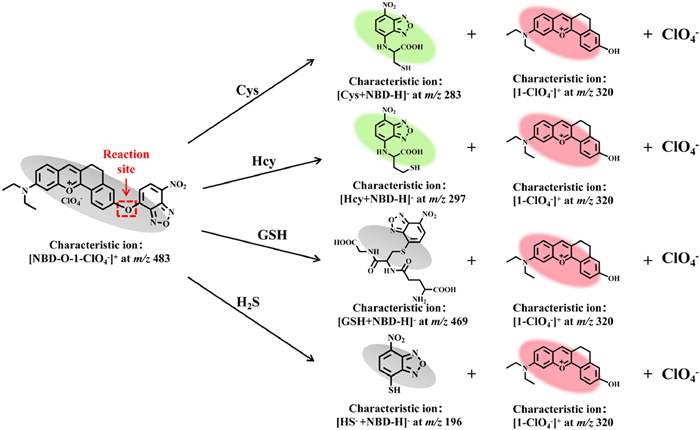
Consequently, the enhanced detection of RSSs by ESI-MS in the negative mode was generated from the interaction between RSSs and the probe of NBD-O-1. As illustrated in Fig. 4, upon the interaction between the probe of NBD-O-1 and RSSs, the NBD-O-1 is decomposed into 1 and −NBD-H. Thereafter, the complex of RSSs and −NBD-H was generated for the enhancement of RSS detections by recording the corresponding adduct ions. For the ESI-MS detections in the positive mode, only the probe ion of [NBD-O-1-ClO4−]+ at m/z 483 and the fragment ion of [1-ClO4−]+ at m/z 320 can be recorded with adding the probe into different RSSs. Therefore, the discrimination of RSSs cannot be obtained by ESI-MS detection in the positive mode. While in the negative mode, the different adduct ions of −NBD-H with RSSs are detected, successfully achieving the discrimination of different RSSs. In addition, along with the interaction between the probe with RSSs for MS detections, the turn-on green fluorescent emissions (at 550 nm) are also exhibited for the RSSs of Cys and Hcy and red emission (at 625 nm) for all four RSSs. This is also in accordance with the failure of discriminating four RSSs by the probe of NBD-O-1 via FL imaging.
Figure 4
Figure 4.
The mechanism for FL emission and obtaining characteristic ions of RSSs with adding NBD-O-1. The different colored backgrounds indicated the different emissions upon the interaction between RSSs and NBD-O-1. Grey, no emission; Green, FL emission at 550 nm; Pink, FL emission at 625 nm.
To further evaluate the feasibility of applying the present enhanced ESI-MS strategy to the detection of RSSs during ferroptosis, HeLa cells were selected as the mode for the evaluations. Initially, the cytotoxicity of the NBD-O-1 probe was evaluated by using the methylthiazolyl tetrazolium (MTT) assay. As a result, the cell viability of HeLa cells was higher than 90% after incubating with the probe (0–10 µmol/L) for 12 h. This indicated the satisfied biocompatibility and suitability for intracellular detections (Fig. S7 in Supporting information). Subsequently, the imaging of RSSs in HeLa cells by the probe was carried out. As exhibited (Fig. S8 in Supporting information), significant green and red emissions were recorded after incubating with 10 µmol/L of NBD-O-1 for 30 min, preliminarily confirming the FL imaging of RSSs in HeLa cells. Furthermore, the feasibility of detecting RSSs in HeLa cells by the present method was evaluated after incubating cells with NBD-O-1 (10 µmol/L, 30 min). In the positive mode (Fig. S9a in Supporting information), the ion of [NBD-O-1-ClO4−]+ at m/z 483 and the fragment ion of [1-ClO4−]+ at m/z 320 were observed, indicating the successful uptaking of NBD-O-1 by cells to undergo the RSS detections. This was confirmed by recording a series of characteristic RSS ions (m/z 196, m/z 283, m/z 297 and m/z 469) in the negative mode (Fig. S9b in Supporting information). Therefore, the detection of RSSs in cells can be realized by the present method.
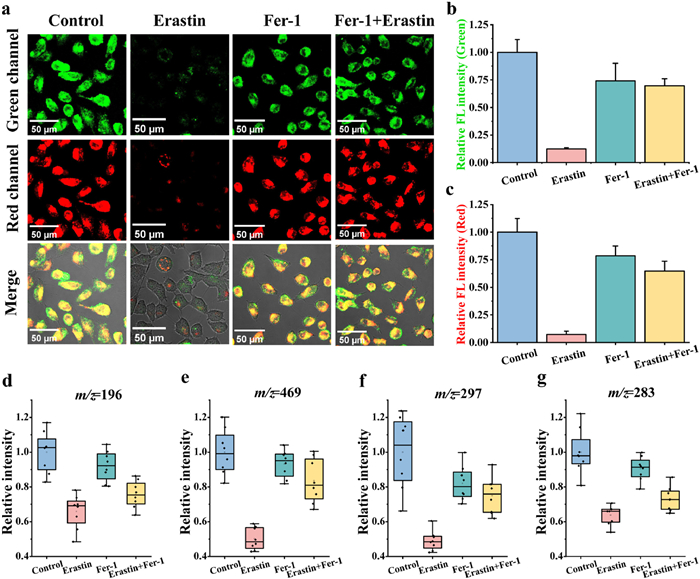
Thereafter, the imaging of RSSs during ferroptosis in living cells was employed in HeLa cells with the ferroptosis. For inducing ferroptosis in HeLa cells, the ferroptosis inducer of Erastin was selected for constructing the ferroptosis cell models. Comparably, the ferroptosis-inhibited group was constructed by the pre-treatment with Ferrostatin-1 (Fer-1). In the experiment, the FL imaging of different groups, including the control, the ferroptosis HeLa cells incubated with Erastin, the HeLa cells incubated with Fer-1, and the ferroptosis-inhibited HeLa cells treated with Erastin and Fer-1, was carried out for comparison. As shown in Fig. 5a, compared with the control group, the FL emission in the red and green channels was dramatically decreased in the Erastin-induced ferroptosis group (Erastin). While no obvious change was observed in the Fer-1-treated group (Fer-1) and the ferroptosis-inhibited group (Fer-1 + Erastin). The corresponding FL intensities in both green and red channels are illustrated in Figs. 5b and c. Consequently, it can be deduced that the expression of RSSs in the ferroptosis group dramatically decreased while can be recovered with ferroptosis-inhibited. However, only the summary expression of Cys and Hcy (green channel) or the total expression of four RSSs (red channel) can be indicated by the FL imaging, it is still difficult to discriminate different RSSs.
Figure 5
Figure 5.
The detection of four RSSs in living cells by both FL imaging and ESI-MS. (a) Fluorescence images of NBD-O-1 in HeLa cells under different treatments. Relative fluorescence intensities of images in (b) Green channel and (c) Red channel. (d-g) MS relative intensities of m/z 196, m/z 469, m/z 297, and m/z 283 under different treatments.
Thus, the RSSs were detected by the NBD-O-1-enhanced ESI-MS strategy. As demonstrated in Figs. 5d-g, the levels of the four RSSs in the group of ferroptosis induced by Erastin decreased to differing degrees (Erastin) compared to the control group and the Fer-1 group. While in the ferroptosis-inhibited group (Fer-1 + Erastin), the expression of four RSSs increased obviously. This is in accordance with the results of the FL imaging (Figs. 5a-c), exhibiting the increased FL signals in the ferroptosis-inhibited group (due to the increased RSSs) and the decreased FL responses in the ferroptosis group (with the decreased RSSs). Therefore, the NBD-O-1- enhanced ESI-MS strategy is reliable for identifying different expressions of RSSs, including Cys, Hcy, GSH and H2S, to evaluate the ferroptosis process in living cells. This could be desirable for providing direct RSS information in biological studies.
In summary, we have presented an unconventional application of a fluorescent probe for the ESI-MS-based detection of RSSs in Ferroptosis. Taking a FL probe of NBD-O-1 as an example, the discrimination of different RSSs cannot be obtained based on the similar FL emission in both red and green channels generated from the interaction between RSSs and the probe of NBD-O-1. Nevertheless, the normal detection of RSSs by ESI-MS is unsatisfactory due to the failure to obtain RSS ions in the positive mode and the quite low sensitivity in the negative mode. While interestingly the interaction between RSSs and the probe does have enhanced the RSS detection by ESI-MS in the negative mode. Consequently, the discrimination and evaluation of four RSSs including Cys, Hcy, GSH and H2S can be obtained, which has shown potential for the examination in the ferroptosis mode of the HeLa cells. Upon overcoming the similar FL emission for Cys/Hcy and GSH/H2S, this probe-enhanced ESI-MS detection has provided a potential pathway for evaluating RSSs levels, which would address the mechanism examinations of ferroptosis for targeted therapeutic strategies and drug developments.
Declaration of competing interest
The authors declare that they have no known competing financial interests or personal relationships that could have appeared to influence the work reported in this paper.
CRediT authorship contribution statement
Mengyu Cao: Writing – original draft, Investigation, Data curation. Yiyan Yin: Writing – review & editing. Jingyi Qin: Data curation. Jin Ouyang: Writing – review & editing. Na Na: Writing – review & editing, Project administration, Funding acquisition.
Acknowledgments
This study was supported by the National Key Research and Development Program of China (No. 2024YFA1509600), National Natural Science Foundation of China (Nos. 22474010 and 22274012), and the Fundamental Research Funds for the Central Universities (No. 2233300007).
Supplementary materials
Supplementary material associated with this article can be found, in the online version, at doi:10.1016/j.cclet.2025.111260.
C. Iacobucci, S. Reale, F. De Angelis, Angew. Chem. Int. Ed. 55 (2016) 2980–2993. doi: 10.1002/anie.201507088
[42]
Y. Huang, Y. Zhang, F.G. Huo, Y. Liu, C. Yin, Sens. Actuators B: Chem. 301 (2019) 127123–127130. doi: 10.1016/j.snb.2019.127123
Figure 1
The preparation and characterization of the fluorescent probe of NBD-O-1. (a) The illustration on the synthesis of NBD-O-1. (b) ESI-MS characterizations. (i) MS spectrum of NBD-O-1 at positive ion mode. (ii) MS/MS spectrum of the ion [NBD-O-1-ClO4−]+ at m/z 483.
Figure 2
The detection of RSSs by NBD-O-1 probe. Fluorescence spectra of NBD-O-1 with adding different RSSs, under the irradiation at λex = 480 nm (a) and λex = 585 nm (b), respectively. Selectivity of NBD-O-1 to various species, under the irradiation at λex = 480 nm (c) and λex = 585 nm (d), respectively. (e) Time-dependent fluorescence intensity of NBD-O-1 at 550 nm in the presence of Cys and Hcy, λex=480 nm. (f) Time-dependent fluorescence intensity of NBD-O-1 at 625 nm in the presence of GSH and H2S, λex = 585 nm.
Figure 3
The detection of RSSs by ESI-MS with NBD-O-1 added. (a) The mass spectra of Cys (i), Hcy (ii), GSH (iii), and HS− (iv) with NBD-O-1 added in the positive mode. (b) The intensity ratios of the characteristic ions of [1-ClO4−]+ (at m/z 320) to [NBD-O-1-ClO4−]+ (at m/z 483) for different species with NBD-O-1 added. (c) The mass spectra of Cys (i), Hcy (ii), GSH (iii), and HS− (iv) with NBD-O-1 added in the negative mode. (d) Online monitoring of the ion signals of Hcy with NBD-O-1 added in the negative mode.
Figure 4
The mechanism for FL emission and obtaining characteristic ions of RSSs with adding NBD-O-1. The different colored backgrounds indicated the different emissions upon the interaction between RSSs and NBD-O-1. Grey, no emission; Green, FL emission at 550 nm; Pink, FL emission at 625 nm.
Figure 5
The detection of four RSSs in living cells by both FL imaging and ESI-MS. (a) Fluorescence images of NBD-O-1 in HeLa cells under different treatments. Relative fluorescence intensities of images in (b) Green channel and (c) Red channel. (d-g) MS relative intensities of m/z 196, m/z 469, m/z 297, and m/z 283 under different treatments.

 DownLoad:


 下载:
下载:


 下载:
下载:
