State Key Laboratory of Pollution Control and Resource Reuse, Shanghai Institute of Pollution Control and Ecological Security, School of Environmental Science and Engineering, Tongji University, Shanghai 200092, China
Received Date:
11 November 2024 Accepted Date:
22 April 2025 Revised Date:
21 February 2025 Available Online:
15 January 2026
Abstract:
Nanofiltration (NF) technology, with its capacity for nanoscale filtration and controllable selectivity, holds significant promise in diverse applications. However, the current upper bound of permeance and selectivity of NF membranes is intrinsically constrained by the morphology and structure of the polyamide (PA) selective layer. This issue arises because NF membranes typically exhibit relatively smooth nodular structures, which theoretically impede efficient water transport. In this study, we enhanced the formation of nanobubbles by synergistically regulating with surfactant and low temperatures, resulting in the fabrication of PA NF membranes with a crumpled morphology. We observed that lower temperatures promote enhanced gas solubility in the aqueous phase, facilitating increased nanobubble formation through the foaming effect of surfactant sodium dodecylbenzene sulfonate (SDBS). Consequently, this resulted in the creation of PA NF membranes with more crumpled structures and superior performance, with pure water permeance reaching 36.25 ± 0.42 L m-2 h-1 bar-1, representing an improvement of 14.47 L m-2 h-1 bar-1 compared to the control group. Additionally, it maintains a high Na2SO4 rejection rate of 97.00% ± 0.58%. The PA NF membranes produced by eliminating nanobubbles and free interfaces exhibited a smooth structure, whereas introducing nanobubbles (through NaHCO3 addition, N2 pressurization, and ultrasonication) resulted in the formation of crumpled membranes. This emphasized that the large amount of nanobubbles generated by SDBS and low temperature in the interfacial process played a critical role in shaping crumpled PA NF membranes and enhancing membrane performance. This approach has the potential to provide valuable insights into customizing the structural design of TFC PA NF membranes, contributing to further advancements in this field.
Membrane-based wastewater treatment and reuse have become vital strategies to address the global water resource crisis [1]. Nanofiltration (NF) membranes are particularly notable for their nanometer-scale sieving capabilities and controllable selectivity, enabling efficient removal of small molecular pollutants and salts [2–4]. Commercial NF membranes typically use a polyamide (PA) thin-film composite (TFC) structure, formed via interfacial polymerization (IP) between amine monomers piperazine (PIP) and acyl chloride monomers trimesoyl chloride (TMC) on a porous substrate, resulting in a relatively smooth nodular PA selective layer [5,6]. The smooth PA layer theoretically hinders water transport, thereby constraining the overall separation performance of TFC PA membranes [7–9].
Our previous research [10] has demonstrated that, for NF membranes, the introduction of sodium dodecylbenzene sulfonate (SDBS) into the PIP/TMC system resulted in the generation of nanobubbles through the foaming effect. These bubbles shaped the structure of the PA NF membrane, increasing water flux without compromising salt rejection. The foaming mechanism of surfactants relies on the dissolution of gas in the solution, prompting us to explore whether increasing the solubility of gases in the solution can amplify the crumpling degree of NF membranes and improve their performance [11–13].
It was well-established that the solubility of air (primarily CO2 and O2; with the negligible solubility of N2) in water decreased with rising temperatures [14,15]. Although SDBS increased the solubility of nanobubbles in PIP/water, the quantity of nanobubbles remained insufficient for fabricating crumpled NF membranes [16]. Given that the solubility of gases in water is significantly influenced by temperature (i.e., lower temperatures result in higher solubility), reducing the temperature of the SDBS/PIP aqueous solution could further increase the effective amount of nanobubbles. However, the precise impact of temperature on the abundance of nanobubbles and the crumpled morphology of the polyamide membrane surface remained unclear. We hypothesized that precise temperature control could regulate the solubility of gases in the aqueous phase, thereby controlling the quantity of nanobubbles generated by SDBS. This manipulation could lead to PA NF membranes with distinct crumpling intensities and varied performance characteristics.
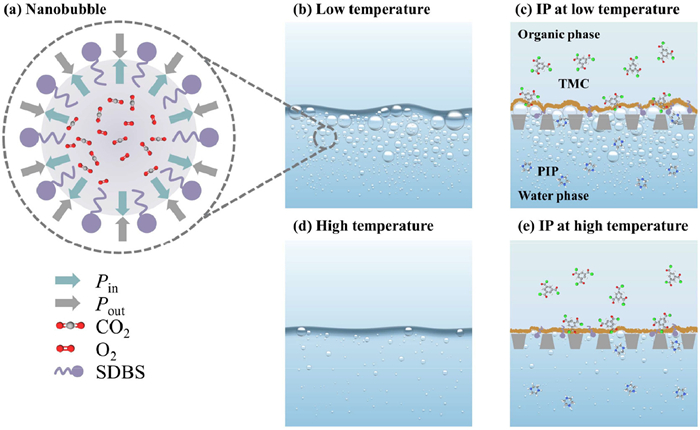
In this study, we achieved a more pronounced bubble-like crumpled structure in the NF membrane through meticulous temperature control of the SDBS/PIP aqueous solution, ensuring it was maintained at a sufficiently low temperature (near 0 ℃, ≤ 0.3 ℃). This approach increased gas solubility and enhanced the abundance of nanobubbles, facilitating the shaping of the PA layer and promoting the encapsulation of nanobubbles between the PA layer and the substrate (Fig. 1). The resulting NF membrane exhibited outstanding separation performance, providing new insights into customizing the structure of TFC PA NF membranes.
Figure 1
Figure 1.
Schematics of IP processes for SDBS/PIP/TMC system at different temperatures for the formation of the crumpled TFC PA NF membrane. (a) Microscopic structure of a single nanobubble. (b) Nanobubbles in SDBS/PIP aqueous solution at low temperature. (c) Interfacial polymerization reaction at low temperature. (d) Nanobubbles in SDBS/PIP aqueous solution at high temperature. (e) Interfacial polymerization reaction at high temperature.
We first calculated the enhanced solubility of nanobubbles in the SDBS/PIP aqueous solution. When calculating the gas solubility in SDBS/PIP aqueous solution, the concentrations of PIP and SDBS were relatively low. Therefore, their impact on gas solubility was considered negligible, focusing only on the solubility in pure water. Given that the major soluble components in air are CO2 and O2, their solubility at different temperatures was calculated using established solubility-temperature relationship formulas [14]. This allowed us to determine the gas content in the solution at various experimental temperatures, reflecting the number of nanobubbles. The detailed calculation process is provided in Section S1 (Supporting information).
The solubility of CO2 and O2 at 0, 5, 10, and 20 ℃ were as follows: 3388.06, 2754.50, 2289.22, and 1662.65 mg/L for CO2; and 14.74, 12.92, 11.46, and 9.33 mg/L for O2. Additionally, the size distribution of nanobubbles was also temperature-dependent. As the temperature increased (0–45 ℃), the bubble size distribution narrowed, and the average bubble radius decreased [17].
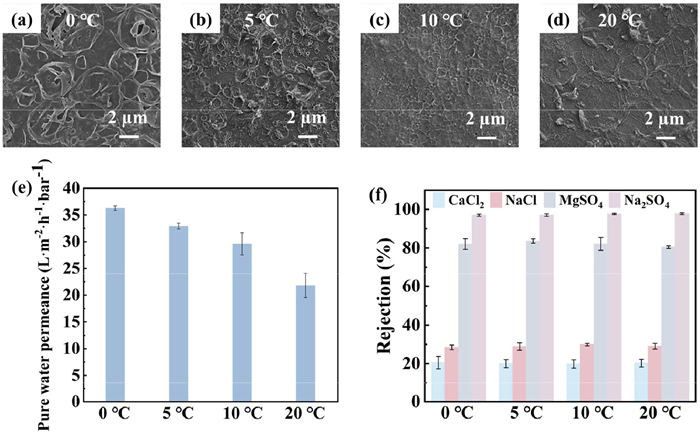
We initially characterized the surface morphology of temperature-tuned crumpled NF membranes to investigate whether lower temperatures could enhance the template effect of nanobubbles to form a more crumpled PA layer. We observed that at 0, 5, 10, and 20 ℃, the membrane surfaces exhibited crumpled morphologies resembling bubbles (Fig. 2), with these features being more pronounced at lower temperatures.
Figure 2
Figure 2.
Effect of different temperatures of SDBS/PIP aqueous solution on the surface morphologies and separation performance of NF membranes. (a-d) The surface morphologies of NF membranes formed in PIP/SDBS aqueous solution at 0, 5, 10 and 20 ℃, respectively. (e) Pure water permeance of temperature-tuned crumpled NF membranes formed in PIP/SDBS aqueous solution at 0, 5, 10 and 20 ℃, respectively (salt concentration: 10 mmol/L, applied pressure: 6 bar). (f) Rejection of CaCl2, NaCl, MgSO4, and Na2SO4 by temperature-tuned crumpled NF membranes formed in PIP/SDBS aqueous solution at 0, 5, 10 and 20 ℃, respectively (salt concentration: 10 mmol/L, applied pressure: 6 bar).
This phenomenon could be attributed to the higher gas solubility at lower temperatures (Fig. S1 in Supporting information) in the PIP/water solution, which promotes the foaming effect of SDBS, resulting in an increased generation of bubbles during the IP process. Consequently, this enhanced the template effect of nanobubbles (arising from the SDBS nanofoaming effect) [10,14].
In particular, the addition of SDBS to the PIP/water solution at lower temperatures facilitated the generation of additional nanobubbles (primarily CO2) through the foaming effect. This process concurrently reduced the interfacial tension between PIP and TMC, stabilizing the nanobubbles and prolonging their presence at the interface. This interaction, coupled with the relatively slow reaction rate of PIP and TMC, facilitated the entrapment of nanobubbles between the PA layer and the substrate. Consequently, this fostered the formation of bubble-like crumpled structures within the PA layer. Moreover, as the temperature decreased, the crumpled morphology became more pronounced, further enhancing the gutter effect and consequently boosting permeance [18].
The cross-sectional analysis of the NF membrane (Fig. S2 in Supporting information) revealed the hollow configuration of the crumpled structure, mirroring the bubble-like morphology depicted in Fig. 2. This observation further corroborated the existence of entrapped nanobubbles between the PA layer and the substrate. Additionally, the bubble-like structure resulted in elevated surface roughness, with values increasing from ~41.1 nm at 20 ℃ to ~62.2 nm at 0 ℃ (Fig. S3 in Supporting information). Consequently, this enhanced the effective water transport area of the NF membrane [19,20].
We conducted further tests to evaluate the separation performance of the temperature-tuned crumpled NF membranes (Fig. 2, Fig. S4 in Supporting information). While the NF membrane tuned at a low temperature exhibited the highest water permeance (36.25 ± 0.42 L m-2 h-1 bar-1) (Fig. 2e), salt rejection (97.00% ± 0.58%) (Fig. 2f) remained relatively consistent compared to membranes tuned at other temperatures. Although the 0 ℃ NF membrane exhibited the highest degree of cross-linking (Fig. S5 in Supporting information), the more pronounced crumpled structure on its surface (resulting in increased water permeance area) had a promoting effect on water permeance that outweighed the adverse effects of increased cross-linking. Consequently, the 0 ℃ NF membrane demonstrated a higher degree of crumpling. Furthermore, salt rejection was influenced by both the Donnan and size sieving effect [21–23]. Although increased cross-linking aided in enhancing size sieving, it concurrently reduced the surface charge of the membrane (Table S1 in Supporting information), thereby lowering the Donnan effect [24–26]. These two effects counteracted each other, resulting in no significant change in salt rejection.
Reaction temperature significantly impacts the interfacial polymerization process for fabricating NF membranes. Firstly, an increase in temperature typically accelerates the chemical reaction rate, resulting in a thicker and denser PA layer [27–29]. However, excessively rapid reactions may cause uneven polymerization and defects. Secondly, temperature critically influences the membrane's microstructure. Lower temperatures can slow the reaction rate, allowing for more uniform membrane formation and aiding in the generation of fine nanobubbles, which contribute to a more pronounced crumpled structure. This crumpled structure increases the membrane's specific surface area, thereby enhancing water permeability. Thirdly, gas solubility is affected by temperature, with lower temperatures generally increasing gas solubility, promoting the formation and encapsulation of nanobubbles within the PA layer, which improves water permeability [30]. Additionally, during IP, temperature also impacts interfacial stability and surface tension. An appropriate temperature can maintain interfacial stability, preventing interfacial rupture and facilitating the formation of a uniform and continuous PA layer [31].
In conclusion, reaction temperature has multifaceted effects on the IP process for NF membrane fabrication. Proper temperature control is crucial for producing high-performance NF membranes. By optimizing temperature conditions, NF membranes with excellent water permeability and salt rejection rates can be achieved.
To further understand these effects, we investigated the role of nanovoids in enhancing water transport efficiency. The conventional TFC membranes relied on a funnel effect from the substrate, creating a water transport path resembling a streamline (Fig. S6a in Supporting information) [32–34]. Nanovoids between the PA layer and the substrate, however, introduced a gutter effect, significantly reducing the water transport path and improving transport efficiency (Fig. S6b in Supporting information) [18,20,35]. This work used a nanovoid computational model to evaluate temperature-dependent effects on nanovoids and their impact on NF membrane performance [36]. With parameters derived from experimental data, the crumpled PA surface was modeled with semicircular features. The model demonstrated that while void permeance exceeded the PA layer, the water transport behavior primarily benefited from the shortened path. Detailed calculations were provided in Section S7 (Supporting information).
As the temperature increased, both EA (enhancement in water permeance) and 1/η (benefits of the gutter effect of nanovoids) (Fig. S7 in Supporting information) exhibited a decreasing trend. The former indicated that membranes prepared at lower temperatures had higher water permeance than those prepared at higher temperatures. The latter suggested that membranes prepared at lower temperatures exhibited a stronger gutter effect than those prepared at higher temperatures, implying shorter water transport pathways. Both trends indicated that membranes prepared at lower temperatures had higher water transport efficiency, consistent with the experimentally observed changes in pure water permeance values.
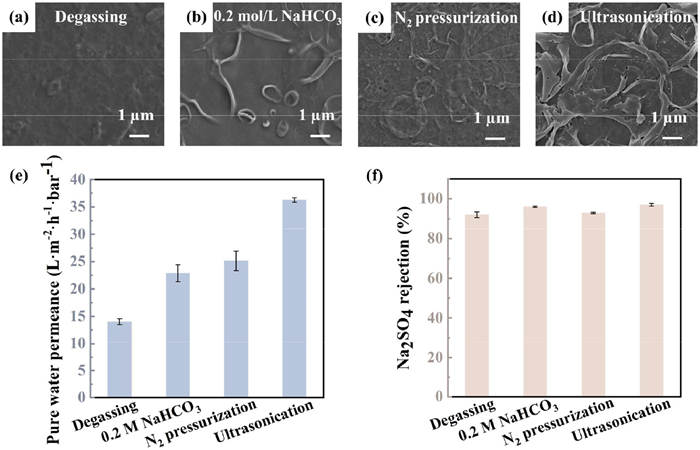
The NF membrane surface, post-degassing, exhibited relative smoothness, while the additional introduction of nanobubbles resulted in the formation of a more crumpled NF membrane (Fig. 3). Essentially, the crumpled structure of the NF membrane formed in situ by nanobubble generation was notably weaker than that formed by the introduction of additional nanobubbles. This suggests that the PIP/TMC system failed to generate sufficient heat and H+ to facilitate the production of CO2 nanobubbles, as observed in the MPD/TMC system [37,38]. The supplemental introduction of nanobubbles maintained a critical quantity of nanobubbles at the PIP/TMC interface, proving essential for the formation of crumpled NF membranes. Additionally, the augmentation by nanobubbles contributed to the enhancement of membrane performance; for instance, ultrasound could generate more nanobubbles [39], resulting in the creation of a more crumpled NF membrane with the highest water permeance (36.25 ± 0.42 L m-2 h-1 bar-1) and salt rejection (97.00% ± 0.58%). This underscores that sustaining an ample number of nanobubbles at the PIP/TMC interface not only influenced the structure of the PA layer but also led to the development of high-performance NF membranes.
Figure 3
Figure 3.
Effect of nanobubbles elimination and enhancement on the morphology and separation performance of NF membranes formed in PIP/SDBS aqueous solution at 0 ℃. (a) Morphology of NF membrane after nanobubbles elimination. (b) Morphology of 0 ℃ NF membrane formed after 0.2 mol/L NaHCO3 added (addition of NaHCO3 after degassing, the concentration of SDBS was 4 critical micelle concentrations (CMC)). (c) Morphology of NF membrane after nanobubbles enhancement (30 min of N2 pressurization). (d) Morphology of NF membrane after nanobubbles enhancement (30 min of ultrasonication). Pure water permeance and Na2SO4 rejection of NF membranes after nanobubble elimination and enhancement. (e) Pure water permeance. (f) Na2SO4 rejection (salt concentration: 10 mmol/L, applied pressure: 6 bar, temperature: 0 ℃).
The rationale behind adding NaHCO3 to the PIP aqueous solution after degassing was to introduce nanobubbles during the IP process. This was because nanobubbles could react with H+ (a byproduct of the reaction between PIP and TMC), generating CO2 while releasing heat [19,40]. This heat promoted the release of the generated CO2 in the form of nanobubbles, which were then trapped between the PA layer and the substrate, resulting in the formation of a crumpled morphology in the PA layer. The principles behind ultrasonication and N2 pressurization were similar. Both methods utilized the foaming effect of SDBS to introduce CO2 before the IP reaction [41]. These results indicated that both the foaming effect of SDBS and the addition of NaHCO3 to react with H+ could generate CO2 nanobubbles, leading to the formation of a crumpled structure in the PA layer [10,42].
Additionally, we conducted free IP experiments and compared them with conventional IP (Fig. 4). We conducted a meticulous examination of the morphology of NF membranes formed at the free interface to elucidate the mechanism by which nanobubbles shaped the PA layer. NF membranes prepared through FIP exhibited a nodular structure (Fig. S8 in Supporting information), primarily attributed to the diffusion of nanobubbles generated by temperature-tuned SDBS foaming from the solution [43,44]. These nanobubbles were unable to stabilize in the oil-water/interface-forming structure of NF membranes [45]. Furthermore, the performance of NF membranes prepared through FIP was markedly inferior to that of the 0 ℃ NF membrane (Figs. 4c and d). This further confirmed that the presence of a sufficient and stable quantity of nanobubbles at the PIP/TMC interface was the key mechanism for forming high-performance NF membranes with a crumpled structure.
Figure 4
Figure 4.
Schematic illustration of free IP for preparation of TFC PA NF membranes and the separation performance of free IP. (a) Conventional IP. (b) Free IP. (c, d) Pure water permeance and Na2SO4 rejection of NF membranes via FIP (salt concentration: 10 mmol/L, applied pressure: 6 bar).
Therefore, we proposed the mechanism for crumple NF membrane formation by temperature-tuned nanobubble formation: Lower temperatures increased gas solubility in the aqueous phase, promoting nanobubble formation facilitated by the foaming action of SDBS. This process entailed the encapsulation of nanobubbles between the PA layer and the substrate, thus resulting in the formation of crumpled NF membranes with superior performance.
In this study, we meticulously tuned low-temperature conditions and leveraged the foaming capacity of SDBS to amplify the abundance of nanobubbles, resulting in a crumpled PA layer with a bubble-like appearance characterized by increased surface area and abundant nanoscale voids. This structural modification played a crucial role in enhancing membrane permeance. Notably, compared to conventional NF membranes, the augmented crumpled structure significantly improved water permeance while maintaining a commendable desalination level of salt rejection. This paper presents a strategy for nanobubble-controlled NF membrane morphology and separation performance, providing new insights into the formation mechanism of the PA layer in TFC PA NF membranes and opening new possibilities for tailoring membrane structures and enhancing separation performance. A prospective avenue for future exploration lies in determining whether alternative surfactants could exhibit superior efficiency in fostering nanobubble generation under carefully regulated low-temperature conditions, thereby potentially advancing the crumpled morphology and separation efficiency of NF membranes.
Declaration of competing interest
The authors declare that they have no known competing financial interests or personal relationships that could have appeared to influence the work reported in this paper.
S. Karan, Z. Jiang, A.G. Livingston, Science 348 (2015) 1347–1351. doi: 10.1126/science.aaa5058
[44]
X. Song, B. Gan, S. Qi, et al., Environ. Sci. Technol. 54 (2020) 3559–3569. doi: 10.1021/acs.est.9b05892
[45]
L.E. Peng, Z. Yao, Z. Yang, H. Guo, C.Y. Tang, Environ. Sci. Technol. 54 (2020) 6978–6986. doi: 10.1021/acs.est.0c01427
Figure 1
Schematics of IP processes for SDBS/PIP/TMC system at different temperatures for the formation of the crumpled TFC PA NF membrane. (a) Microscopic structure of a single nanobubble. (b) Nanobubbles in SDBS/PIP aqueous solution at low temperature. (c) Interfacial polymerization reaction at low temperature. (d) Nanobubbles in SDBS/PIP aqueous solution at high temperature. (e) Interfacial polymerization reaction at high temperature.
Figure 2
Effect of different temperatures of SDBS/PIP aqueous solution on the surface morphologies and separation performance of NF membranes. (a-d) The surface morphologies of NF membranes formed in PIP/SDBS aqueous solution at 0, 5, 10 and 20 ℃, respectively. (e) Pure water permeance of temperature-tuned crumpled NF membranes formed in PIP/SDBS aqueous solution at 0, 5, 10 and 20 ℃, respectively (salt concentration: 10 mmol/L, applied pressure: 6 bar). (f) Rejection of CaCl2, NaCl, MgSO4, and Na2SO4 by temperature-tuned crumpled NF membranes formed in PIP/SDBS aqueous solution at 0, 5, 10 and 20 ℃, respectively (salt concentration: 10 mmol/L, applied pressure: 6 bar).
Figure 3
Effect of nanobubbles elimination and enhancement on the morphology and separation performance of NF membranes formed in PIP/SDBS aqueous solution at 0 ℃. (a) Morphology of NF membrane after nanobubbles elimination. (b) Morphology of 0 ℃ NF membrane formed after 0.2 mol/L NaHCO3 added (addition of NaHCO3 after degassing, the concentration of SDBS was 4 critical micelle concentrations (CMC)). (c) Morphology of NF membrane after nanobubbles enhancement (30 min of N2 pressurization). (d) Morphology of NF membrane after nanobubbles enhancement (30 min of ultrasonication). Pure water permeance and Na2SO4 rejection of NF membranes after nanobubble elimination and enhancement. (e) Pure water permeance. (f) Na2SO4 rejection (salt concentration: 10 mmol/L, applied pressure: 6 bar, temperature: 0 ℃).
Figure 4
Schematic illustration of free IP for preparation of TFC PA NF membranes and the separation performance of free IP. (a) Conventional IP. (b) Free IP. (c, d) Pure water permeance and Na2SO4 rejection of NF membranes via FIP (salt concentration: 10 mmol/L, applied pressure: 6 bar).

 DownLoad:


 下载:
下载:


 下载:
下载:
