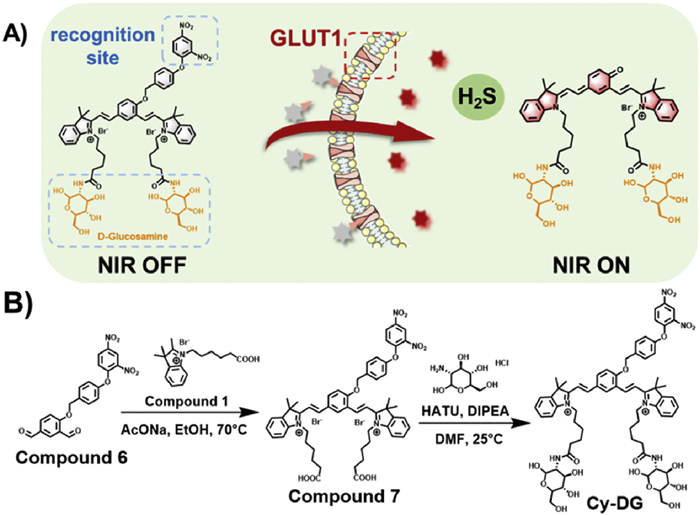
Figure 1.
(A) Design and (B) synthesis of NIR FL probe Cy-DG toward H2S.
H2S-activated near-infrared fluorescent probe for detecting colon cancer and rapid fecal analysis
Kairong Yang , Bingbing Zheng , Fapu Wu , Bijia Zhou , Lijun Li , Hu Xiong

Colon cancer is one of the most common malignant tumors of the digestive tract, originating from the colonic mucosal epithelium [1,2]. At the time of diagnosis, about 80% of colorectal cancer patients have already developed to middle and advanced stages, and 44% of patients have liver and lung metastases [3,4]. Early detection of colon cancer is important, with a 90% cure rate in the clinic [5]. However, precise delineation of tiny intestinal tumors in the early stage is still challenging [6,7]. To date, conventional ultrasonography, colonoscopy, and X-ray computed tomography are commonly used in the diagnosis of colorectal cancer [8,9]. Nevertheless, 15%–32% of concealed bowel adenomas cannot be detected by routine colonoscopy, and these methods only provide anatomical and pathological images, which are limited in sensitivity and spatiotemporal resolution [10]. Recently, fluorescence imaging, relying on stimuli-responsive fluorescent (FL) probes, has received extensive attention in the diagnosis of colorectal cancer [11–16]. However, targeted FL probes that can sensitively and rapidly differentiate tiny colon tumors from adjacent normal tissues are still scarce. There remains a need to develop stimuli-responsive FL probes with high tumor tropism for colon cancer diagnosis.
Hydrogen sulfide (H2S), an important endogenous gasotransmitter in living systems, plays a crucial role in many physiological and pathological processes [17–21]. Recent investigations have verified that upregulation of cystathionine β-synthase (CBS) in colorectal cancer cells could significantly stimulate overproduction of H2S in mitochondria, resulting in much higher levels of H2S than that in normal tissues (0.3–3.4 mmol/L) [22–25]. In addition, excess H2S could increase the glycolytic activity of cancer cells and stimulate angiogenesis, thereby promoting tumor growth and proliferation [26]. Therefore, real-time monitoring of endogenous H2S levels in vivo is of great significance to understand its roles in the progression of colon cancer. By virtue of the high-expression endogenous H2S, a large number of H2S-activated small molecular NIR FL probes have been developed for cancer detection [27–31]. Despite great advances being made, significant challenges such as poor water solubility and limited tumor-targeting efficiency continue to hinder their application in the accurate diagnosis of colorectal cancer. Moreover, owing to intestinal flora disorders (e.g., sulfate-reducing bacteria) [32], the concentration of H2S in the stool of bowel cancer patients is also increased, presenting a promising diagnostic biomarker. However, the rapid and effective analysis of fecal samples using H2S-activated NIR probes remains an unmet need. It is crucial to create new H2S-activated NIR FL probes for simultaneous diagnosis of colon cancer in vivo and stool samples ex vivo.
In this study, we developed an H2S-responsive NIR FL probe (Cy-DG) for sensitively detecting colon cancer in vivo and rapidly screening stool samples simultaneously (Fig. 1). Cy-DG was rationally constructed by installing an H2S-recognition group (2,4-dinitrophenyl ether) and anchoring two tumor-targeting fragments (D-glucosamine) as well on the skeleton of the QCy7 fluorophore. In the absence of H2S, Cy-DG is in the non-fluorescent state. After reacting with H2S, the recognition group would be removed, followed by 1,6 intramolecular self-elimination and π-electron rearrangement, thereby turning on its intense NIR fluorescence due to the enhanced intramolecular charge transfer (ICT) mechanism. The probe Cy-DG exhibited peak absorption/emission at 585/703 nm, with a large Stokes shift of 118 nm. Moreover, it was able to sensitively and selectively detect exogenous and endogenous H2S in vitro, showing the limit of detection (LOD) of 0.48 µmol/L. Taking advantage of the two D-glucosamine fragments, Cy-DG could be preferentially taken up by cancer cells via the overexpressed glucose transporter 1 (GLUT1) pathway and accurately light up colon tumors (< 5 mm) in vivo. More importantly, it was successfully applied in the rapid analysis (~5 min) of feces samples from colon cancer-bearing mice, showing a potential for preliminary clinical stool testing.
To design an H2S-activated NIR FL probe for colon cancer detection, we selected QCy7 fluorophore as the probe skeleton due to its intrinsic NIR fluorescence emission beyond 700 nm and facile structure modification characteristic [33]. As depicted in Fig. 1A, the QCy7 fluorophore was installed with one 2,4-dinitrophenyl ether group and two D-glucosamine fragments for responding to H2S and promoting colon cancer cell uptake, respectively, thereby generating the targeted probe Cy-DG. Because of the overexpressed GLUT1 on the membrane of cancer cells, Cy-DG possesses excellent intrinsic tumor tropism and could be preferentially taken up by colon tumors in vivo. The synthesis of probe Cy-DG was described in Fig. 1B and Scheme S1 (Supporting information), with relevant characterization data provided in Supporting information.
First, the absorption spectra of Cy-DG with or without Na2S were measured in an aqueous solution. In the absence of Na2S, the maximum absorption of Cy-DG was located at 430 nm (Fig. 2A). After adding different concentrations of Na2S, the absorption peak at 430 nm decreased, and the absorption band at 554/608 nm gradually increased. Next, the fluorescence spectra of Cy-DG reacted with Na2S were measured. As the concentration of Na2S increased, the fluorescence intensity of Cy-DG was gradually enhanced, showing a peak emission value at 703 nm (Fig. 2B). In addition, there was a good linear relationship between the fluorescence intensity at 703 nm and the concentration of Na2S in the range of 0–160 µmol/L (R2 = 0.9948), and the LOD of Cy-DG was calculated to be 0.48 µmol/L (Fig. 2C). To further evaluate the response kinetics of Cy-DG toward H2S, the time-dependent fluorescence intensity of Cy-DG with varied concentrations of Na2S was measured. As shown in Fig. 2D, the fluorescence intensity of Cy-DG gradually increased in the presence of 10 equiv. of Na2S and reached its plateau within 12 min.
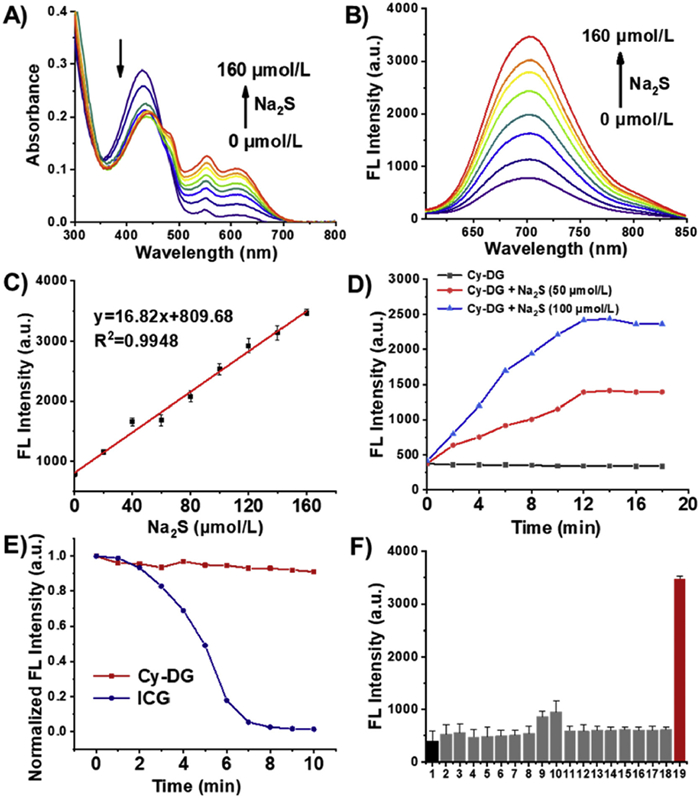
To assess its photostability, we monitored the fluorescence intensity changes of Cy-DG and indocyanine green (ICG). Upon continuous laser irradiation for 10 min, the fluorescence intensity of Cy-DG in phosphate buffered saline (PBS) was only decreased by 9%, while the fluorescence intensity of ICG dramatically decreased up to 99% within 10 min (Fig. 2E). Then, we examined the pH effect on the reactivity of Cy-DG toward H2S. Through monitoring the reaction between Cy-DG and Na2S in different pH buffers, higher fluorescence intensity in neutral or slightly basic pH conditions (pH 7.0–8.0) was observed, indicating that it is favorable for Cy-DG to detect H2S under physiological conditions (Fig. S1 in Supporting information). To further evaluate the selectivity of probe Cy-DG to H2S, the potential analytes were tested, including different metal cations (Na+, K+, Ca2+, Mg2+, Fe2+, Cu2+), reactive sulfur species (S2O32−, glutathione (GSH), cysteine), amino acids (L-Arg, L-Tyr, L-Lys), and reactive oxygen species (NO2−, H2O2, •OH, O2−, ONOO−). As depicted in Fig. 2F, only Na2S could trigger its intense NIR fluorescence, suggesting that Cy-DG possesses good selectivity toward H2S. Besides, after the response of Cy-DG to H2S, other potential analytes were added into the solution, and the results demonstrated that Cy-DG has a great anti-interference capability (Fig. S2 in Supporting information).
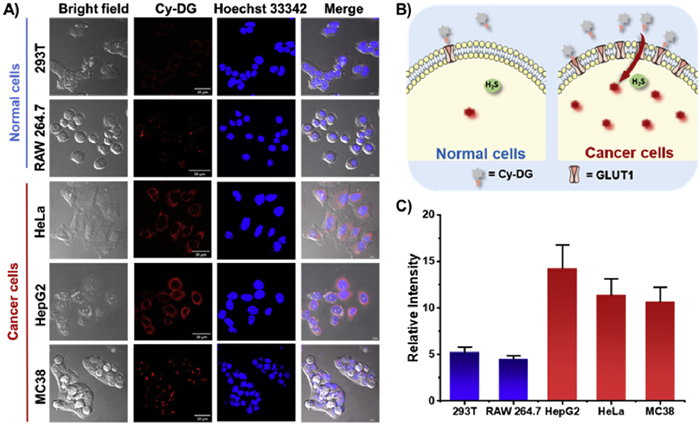
In order to explore the application of probe Cy-DG in bioimaging, the cytotoxicity of Cy-DG was first evaluated by cell counting kit-8 (CCK-8) assay in HepG2 (hepatocellular carcinoma cell line) and MC38 (colon carcinoma cell line) cells. As displayed in Fig. S3 (Supporting information), Cy-DG exhibited good biocompatibility, showing low influence on the survival of cells. To further investigate its organelle-targeting ability, HeLa cells (cervical cancer cell line) were first incubated with Cy-DG and then stained by Lyso-Tracker Green. As shown in Fig. S4 (Supporting information), remarkable NIR fluorescence signals were observed when cells were pretreated with excess L-cysteine hydrochloride monohydrate (Cys) to stimulate the production of H2S (Fig. S4A [34]. The green and red channels merged well, showing good colocalization with a high Pearson's coefficient of 0.86 (Fig. S4). Additionally, a good correlation was observed in both the intensity profile and the intensity scattering plot of the region of interest (ROI) between the red and green channels (Figs. S4E and F), suggesting that Cy-DG was able to selectively image H2S in lysosomes. Considering the overexpressed GLUT1 on the membrane surface of colon cancer cells [35-37], we next examined the competitive cellular uptake experiments between normal cells and cancer cells (Figs. 3A and B). Compared to normal cells (293T and RAW 264.7), cancer cells, including HepG2, HeLa, and MC38, exhibited faster cellular uptake of probe Cy-DG and stronger NIR fluorescence. Fig. 3C showed that the fluorescence intensity of cancer cells was significantly increased by 2–3 times. These results confirmed that Cy-DG bearing two glucose terminals has excellent tumor tropism.
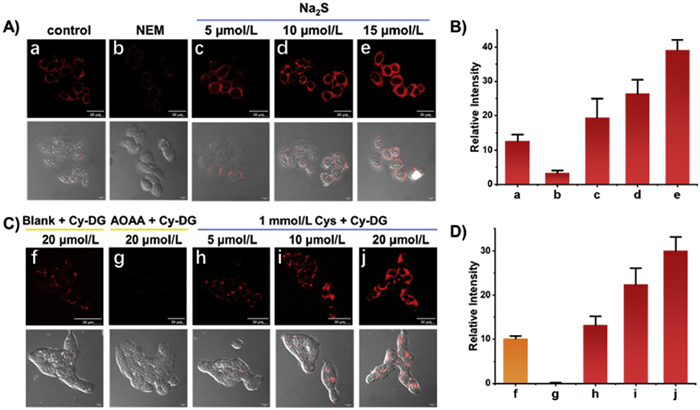
To further investigate its performance in live cell imaging, we examined the capability of Cy-DG to detect exogenous H2S in HepG2 cells and endogenous H2S in MC38 cells. Generally, endogenous H2S is produced by cysteine under the catalysis of CBS, cystathionine-γ-lyase (CSE), and 3-mercaptopyruvate sulfur-transferase (3-MST) [25]. As shown in Fig. 4A, the cells displayed weak fluorescent signals after incubation with the probe, which was ascribed to the existence of a small amount of H2S in HepG2 cells. When the cells were pretreated with N-ethylmaleimide (NEM, a scavenger of cysteine) [31] and then incubated with Cy-DG, the intracellular NIR fluorescence signals dramatically decreased. After treatment with exogenous Na2S, the cells showed gradually enhanced fluorescence intensity as the concentration of Na2S increased (Figs. 4A and B). Next, Cy-DG was used to monitor the subtle changes in endogenous H2S in MC38 cells. As shown in Figs. 4C and D, the MC38 cells exhibited weak NIR fluorescence after incubation with the probe, which was consistent with the results of HepG2 cells. If the cells were pretreated with aminooxyacetic acid (AOAA, CBS inhibitor) to eliminate endogenous H2S [23], the intracellular fluorescent signals almost disappeared. After pretreatment with cysteine to raise endogenous H2S, significant NIR fluorescence signals were found, resulting in a 3.0-fold increase in fluorescence intensity. These results demonstrated that Cy-DG can sensitively detect exogenous and endogenous H2S in vitro.
After confirming that Cy-DG was particularly taken up by tumor cells and could image exogenous and endogenous H2S in living cells, the feasibility of Cy-DG as a sensitive probe to detect endogenous H2S generation in a colon cancer-bearing mouse model was investigated. All animal experiments were approved by the Ethical Committee of Nankai University and were conducted in accordance with the guidelines for animal experiments. Previous studies have demonstrated that the levels of intracellular H2S is upregulated in the progression of colon cancer [38]. However, only a few H2S-activated NIR FL probes have been used for colorectal cancer diagnosis [33,39-41]. A colon cancer-bearing mouse model was then established by intraperitoneally implanting MC38 cells into BALB/c female mice (Fig. 5A). For the control group, mice were intraperitoneally injected with 200 µL PBS solution. For the bowel cancer group, MC38 cells were injected intraperitoneally. For the third group, MC38 cells were intraperitoneally injected, and 10 days later, treated with AOAA prior to imaging. Subsequently, all mice were intravenously injected with the probe Cy-DG, and the whole-body NIR fluorescence imaging was performed using a Cy5.5 filter. As shown in Figs. 5B and C, the control group showed faint fluorescence after injection of Cy-DG, implying a low H2S production level under normal circumstances. By contrast, stronger fluorescence signals were detected in the belly of colon cancer group, exhibiting 5.94-fold higher fluorescence intensity. After treatment with AOAA, reduced fluorescence signals were observed. To further examine the biodistribution, the above mice were sacrificed and their major organs were harvested. The colon tumors, including small tumors < 5 mm, could be clearly distinguished from the surrounding normal tissues (Figs. 5D and E). Moreover, only intense NIR fluorescence signals were observed in the intestines of colon tumor-bearing mice, and the intestinal fluorescent intensity was much stronger than that in the normal group (Fig. S5 in Supporting information). These results highlight the potential of Cy-DG for future diagnosis of colorectal cancer in vivo.
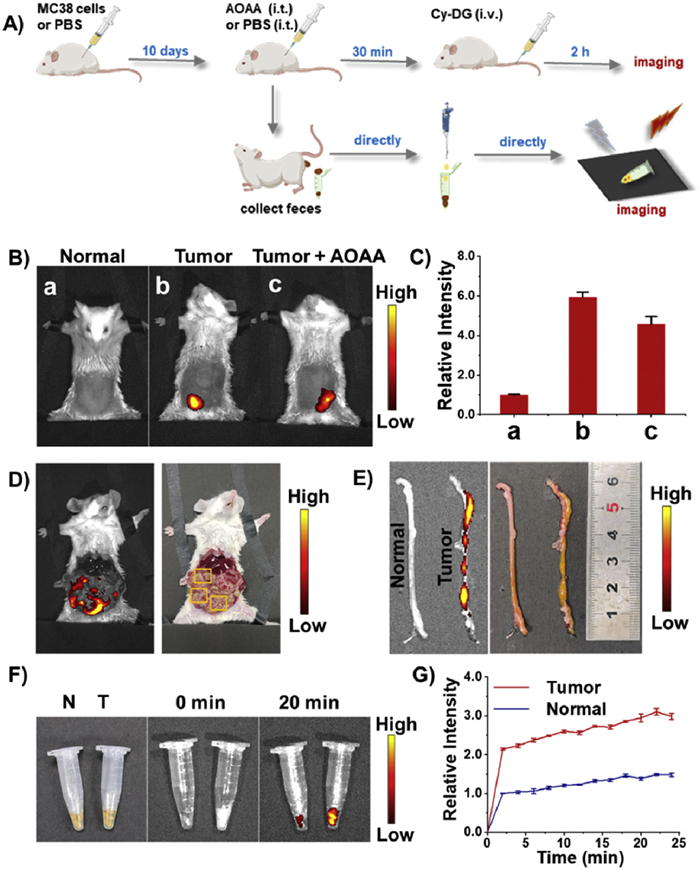
Because of the disturbance of sulfur-metabolizing bacterial communities, the levels of H2S in the stools of patients with colorectal cancer were also increased [42]. To further evaluate its capability for H2S detection in stools, Cy-DG was next applied to optical fecal examination. Prior to intravenous injection of Cy-DG, the feces from normal mice and the bowel cancer group were collected for real-time fluorescence analysis after adding the aqueous solution of Cy-DG (Fig. 5A). Compared to the feces from the control group, the feces from the bowel cancer group exhibited much stronger NIR fluorescence up to 2.5-fold and could be rapidly distinguished within 5 min (Figs. 5F and G). In addition, the stool samples were also collected from mice treated with Cy-DG for fluorescence imaging. As shown in Fig. S6 (Supporting information), the feces of the tumor-bearing mice showed 2.8-fold higher fluorescence intensity, indicating that Cy-DG could be excreted through feces for colon cancer diagnosis. Overall, these results suggest that Cy-DG is promising as a new diagnostic reagent in stool examinations, further improving the screening of colon cancer in the future.
In conclusion, we have successfully developed an H2S-activated NIR fluorescence probe (Cy-DG) for diagnosis of colon cancer. The probe Cy-DG could detect exogenous and endogenous H2S sensitively and selectively with an LOD of 0.48 µmol/L. Because of the modification with two D-glucosamine groups, water-soluble Cy-DG could be preferentially taken up by cancer cells and activated by H2S to turn on NIR fluorescence at 703 nm. Notably, Cy-DG was able to monitor the endogenous H2S generation in a mouse model of colon cancer and screen the stool samples simultaneously. We expect that Cy-DG holds high promise for the diagnosis of various H2S-related diseases.
The authors declare that they have no known competing financial interests or personal relationships that could have appeared to influence the work reported in this paper.
Kairong Yang: Writing – original draft, Methodology, Investigation, Formal analysis, Data curation. Bingbing Zheng: Validation, Investigation. Fapu Wu: Validation, Methodology. Bijia Zhou: Validation. Lijun Li: Writing – review & editing, Supervision. Hu Xiong: Writing – review & editing, Supervision, Funding acquisition, Formal analysis, Conceptualization.
H. Xiong acknowledges financial support from the National Natural Science Foundation of China (Nos. 22422407, 22174078) and the Fundamental Research Funds for the Central Universities, Nankai University (No. 020-63253156). L. Li acknowledges support from the Doctoral Foundation Program of Henan University of Technology (No. 2021BS035).
Supplementary material associated with this article can be found, in the online version, at doi:
Z. Hu, R.H. Li, X.Y. Cui, Z.L. Chen, ACS Appl. Mater. Interfaces 15 (2023) 33890–33902. doi: 10.1021/acsami.3c05926
M.M. Zhu, T. Wang, Y.T. Zhang, et al., Sensor. Actuat. B: Chem. 391 (2023) 134039. doi: 10.1016/j.snb.2023.134039
S.Y. Chen, G. Li, R.B. Pan, et al., Anal. Chem. 96 (2024) 9016–9025. doi: 10.1021/acs.analchem.4c00350
W. Chen, K. Shi, Y. Yu, et al., Chin. Chem. Lett. 35 (2024) 109159. doi: 10.1016/j.cclet.2023.109159
W.J. Wang, X.Y. He, X.J. Wang, et al., Chin. Chem. Lett. 35 (2024) 108656. doi: 10.1016/j.cclet.2023.108656
P. Luo, K.C. Zhou, G. Li, et al., Anal. Chem. 95 (2023) 7344–7353. doi: 10.1021/acs.analchem.3c00580
Y.Q. Zheng, P.C. Yang, J.Y. Chen, et al., Int. J. Surg. 101 (2022) 106644. doi: 10.1016/j.ijsu.2022.106644
C. Eng, T. Yoshino, E. Ruíz García, et al., Lancet 404 (2024) 294–310. doi: 10.1016/S0140-6736(24)00360-X
F. Wu, S. Liu, B. Zheng, et al., Nano Today 55 (2024) 102218. doi: 10.1016/j.nantod.2024.102218
J.W. Martin, B. Scaglioni, J.C. Norton, et al., Nat. Mach. Intell. 2 (2020) 595–606. doi: 10.1038/s42256-020-00231-9
C.S. Li, Q. Lin, F.R. Hu, et al., Biosens. Bioelectron. 214 (2022) 114503. doi: 10.1016/j.bios.2022.114503
K.Q. Ma, H. Yang, X.K. Wu, et al., Angew. Chem. Int. Ed. 62 (2023) e202301518. doi: 10.1002/anie.202301518
M. Ma, S.Q. Zhang, J.K. Li, et al., Sensor. Actuat. B: Chem. 426 (2025) 137057. doi: 10.1016/j.snb.2024.137057
K. Wang, X. Yang, M.Y. Guo, et al., Sensor. Actuat. B: Chem. 369 (2022) 132285. doi: 10.1016/j.snb.2022.132285
K. Zhang, J. Zhang, Z. Xi, et al., Chem. Sci. 8 (2017) 2776–2781. doi: 10.1039/C6SC05646F
F. Zheng, R.S. Xiao, S. Huang, et al., Chin. Chem. Lett. 36 (2025) 109876. doi: 10.1016/j.cclet.2024.109876
S.Y. Gong, Z.P. Zheng, X.G. Guan, et al., Anal. Chem. 93 (2021) 5700–5708. doi: 10.1021/acs.analchem.0c04639
S.Y. Gong, E.B. Zhou, J.X. Hong, G.Q. Feng, Anal. Chem. 91 (2019) 13136–13142. doi: 10.1021/acs.analchem.9b03383
W. Li, Y. Shen, X. Gong, et al., Anal. Chem. 93 (2021) 16673–16682. doi: 10.1021/acs.analchem.1c04246
C.K. Qin, L. Yan, Z.Q. Wang, et al., Analyst 148 (2023) 5724–5730. doi: 10.1039/d3an01442h
L.L. Zhang, H.K. Zhu, C.C. Zhao, X.F. Gu, Chin. Chem. Lett. 28 (2017) 218–221. doi: 10.1016/j.cclet.2016.07.008
J.F. Chen, F.F. Xue, W.X. Du, et al., Nano Lett 22 (2022) 6156–6165. doi: 10.1021/acs.nanolett.2c01346
Z.M. Chen, Y.X. Yang, Y. Tian, et al., Anal. Chem. 96 (2024) 9236–9243. doi: 10.1021/acs.analchem.4c01462
P.P. Oza, K. Kashfi, Pharmacol. Ther. 249 (2023) 108502. doi: 10.1016/j.pharmthera.2023.108502
Z.P. She, W.X. Wang, W.L. Jiang, et al., Anal. Chem. 93 (2021) 11826–11835. doi: 10.1021/acs.analchem.1c02449
C. Szabo, C. Coletta, C. Chao, et al., Proc. Nat. Acad. Sci. U. S. A. 110 (2013) 12474–12479. doi: 10.1073/pnas.1306241110
S.J. Li, Y. Liu, T. Yang, et al., Sensor. Actuat. B: Chem. 426 (2025) 137109. doi: 10.1016/j.snb.2024.137109
Y. Ma, L. Xu, M. Xu, et al., Chin. Chem. Lett. 36 (2025) 110850. doi: 10.1016/j.cclet.2025.110850
J.C. Qin, F. Kong, J. Huang, et al., Anal. Chim. Acta 1337 (2025) 343558. doi: 10.1016/j.aca.2024.343558
Y. Cha, Y. Song, C. Jung, et al., Sensor. Actuat. B: Chem. 436 (2025) 137682. doi: 10.1016/j.snb.2025.137682
L. Yan, Q.S. Gu, W.L. Jiang, et al., Anal. Chem. 94 (2022) 5514–5520. doi: 10.1021/acs.analchem.1c04169
D.A. Muniz Pedrogo, C.L. Sears, J.M.P. Melia, J. Crohns Colitis 18 (2024) 1713–1725. doi: 10.1093/ecco-jcc/jjae061
O. Redy Keisar, E. Kisin Finfer, S. Ferber, et al., Nat. Protoc. 9 (2014) 27–36. doi: 10.1038/nprot.2013.166
V.S. Lin, W. Chen, M. Xian, C.J. Chang, Chem. Soc. Rev. 44 (2015) 4596–4618. doi: 10.1039/C4CS00298A
T.P. Gibson, A.K. Tiwari, D. Kunte, et al., Gastroenterology 140 (2011) S185. doi: 10.1097/01.ede.0000392247.59778.16
Y. Tian, Z.M. Chen, S.Y. Liu, et al., Angew. Chem. Int. Ed. 62 (2023) e202309768. doi: 10.1002/anie.202309768
J.Y. Wang, M.X. Zhu, J.H. Zhu, et al., Cell Death Discov. 9 (2023) 411. doi: 10.3390/agronomy13020411
T.H. Yue, J.C. Li, J. Zhu, et al., Cancer Res. 83 (2023) 595–612. doi: 10.1158/0008-5472.can-22-1837
Q.Y. Li, Z.C. Wang, M. Zhao, et al., Sensor. Actuat. B: Chem. 298 (2019) 126898. doi: 10.1016/j.snb.2019.126898
Y.Y. Quan, L.N. Fan, H.Y. Shen, et al., Dyes Pigm. 197 (2022) 109897. doi: 10.1016/j.dyepig.2021.109897
Z. Wang, X. Li, X.J. Sun, et al., Sensor. Actuat. B: Chem. 384 (2023) 133627. doi: 10.1016/j.snb.2023.133627
L.H. Nguyen, W.J. Ma, D.D. Wang, et al., Gastroenterology 158 (2020) 1313–1325. doi: 10.1053/j.gastro.2019.12.029

Figure 2 Absorption (A) and fluorescence emission (B) spectra of Cy-DG (10 µmol/L) in the absence and presence of different concentrations of Na2S in an aqueous solution (PBS/N,N-dimethylformamide, 1/1, v/v, pH 7.4, 10 mmol/L), λex = 585 nm. (C) Linear relationship of fluorescence intensity at 703 nm with varied concentrations of Na2S. (D) Time-dependent fluorescence intensity of Cy-DG (10 µmol/L) upon the addition of Na2S (50, 100 µmol/L) at 37 ℃, λex = 585 nm. (E) Photostability of Cy-DG (10 µmol/L) vs. ICG (10 µmol/L) in PBS buffer (pH 7.4) upon continuous laser irradiation at 650 nm or 808 nm (0.5 W/cm2), respectively. (F) Fluorescence intensity of Cy-DG (10 µmol/L) in the presence of various analytes: 1, blank; 2, Na+; 3, K+; 4, Ca2+; 5, Mg2+; 6, Fe2+; 7, Cu2+; 8, S2O32−; 9, GSH; 10, Cys; 11, L-Arg; 12, L-Tyr; 13, L-Lys; 14, NO2−; 15, H2O2; 16, •OH; 17, O2−; 18, ONOO−, 19, Na2S, λex = 585 nm. Data are presented as mean ± standard deviation (SD) (n = 3).

Figure 3 (A) Confocal fluorescence images of normal and cancer cells incubated with Cy-DG (20 µmol/L) after pretreated with Cys (500 µmol/L) for 1 h. The cells were also stained with Hoechst 33,342, showing a merged image. Red channel: 663–738 nm (λex = 561 nm) and blue channel: 425–475 nm (λex = 409 nm). Scale bar: 30 µm. (B) Diagram of cellular uptake of Cy-DG by normal and cancer cells. (C) Relative fluorescence intensity of images in (A). Data are presented as mean ± SD (n = 3).

Figure 4 (A) Fluorescence imaging of exogenous H2S in HepG2 cells. Control group: the cells were incubated with Cy-DG (20 µmol/L). NEM group: the cells were incubated with NEM (1 mmol/L) and Cy-DG (20 µmol/L). Na2S groups: the cells were pretreated with Cy-DG (20 µmol/L) for 3 h and then incubated with different concentration of Na2S (5, 10 and 15 µmol/L) for 30 min. (B) Relative fluorescence intensity of images in (A). (C) Fluorescence imaging of endogenous H2S in MC38 cells. Blank group: the cells were incubated with Cy-DG (20 µmol/L). AOAA group: the cells were incubated with AOAA (200 µmol/L) and Cy-DG (20 µmol/L). Cys groups: the cells were incubated with Cys (1 mmol/L) for 1 h and then incubated with different concentration of Cy-DG (5, 10 and 20 µmol/L) for 3 h. (D) Relative fluorescence intensity of images in (C). Red channel: 663–738 nm (λex = 561 nm). Scale bar: 30 µm. Data are presented as mean ± SD (n = 3).

Figure 5 (A) Schematic illustration of H2S imaging in colon cancer-tearing mice and their feces. (B) Fluorescence imaging of mice from different groups after intravenous injection of Cy-DG (n = 3). (C) Relative fluorescent intensity of (B). (D) Fluorescence imaging of colon tumors after abdominal section. Left: fluorescent image. Right: white-light photo. Yellow square: visible MC38 tumors. (E) Images of isolated normal intestine and tumor-bearing intestine. (F) Photographs and NIR fluorescence images of the feces excreted by normal (left) or tumor-bearing (right) mice. The feces were incubated with Cy-DG in PBS. N: normal, T: tumor. (G) Real-time NIR fluorescence intensity of the feces of (F). Excitation: 600 nm, emission: Cy5.5 filter. Data are presented as mean ± SD (n = 3).

 扫一扫看文章

扫一扫关注我们
 DownLoad:

 下载:
下载:
 下载:
下载: