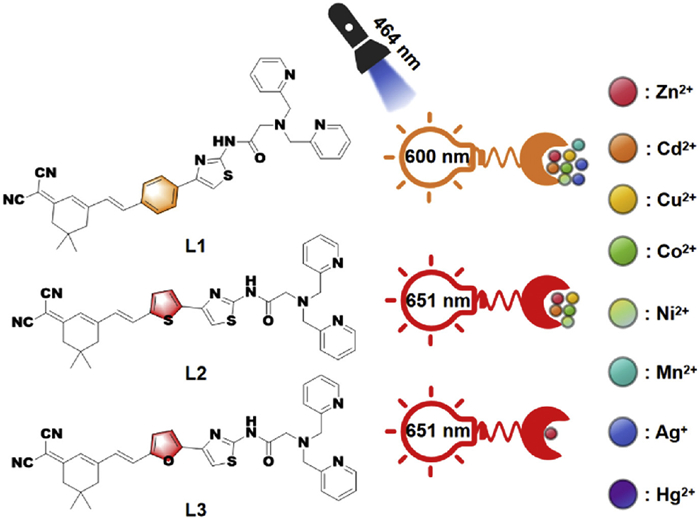
Scheme 1.
The structure of L1, L2 and L3, and their selectivity for Zn2+ detection.
High efficiency detection of Zn2+ through the improved electron density of aromatic π-conjugated bridges
Xindi Yang , Cunli Wang , Dongdong Wang , Haijuan Qin , Kuoxi Xu , Guangyan Qing

Zinc ions (Zn2+) play important roles in various biological processes in the human body [1]. For instance, Zn2+ is a co-factor for various physiological responses, including gene expression, apoptosis, neurotransmission, enzyme regulation, and metabolic function [2-4]. The extent of Zn2+ deficiency is also associated with physical growth retardation and neurological disorders, such as Alzheimer's disease [5-7], Parkinson's disease [8,9], and depression [10,11]. In modern industry, Zn2+ pollution in soil and water has become a widespread problem [12-14].
To date, several methods including fluorescent probes [15], electrochemical methods [16], atomic absorption spectrometry [17], atomic emission spectrometry [18], and mass spectrometry [19], have been developed for Zn2+ analysis. Compared to other methods, fluorescent probes have emerged as a promising tool for detecting Zn2+ due to their low cost, high sensitivity, and real-time detection capability [20,21]. Numerous fluorescent probes for Zn2+ detection have been developed, however, they have some limitations such as short emission wavelengths, narrow Stokes shifts, and the poor selectivity, which limit their practical applications [22-27]. Therefore, developing Zn2+ fluorescent probes that can avoid these limitations is of great significance.
A typical fluorescent probe for metal ion recognition must contain a receptor (the recognition site) linked to a fluorophore (the signal source), which translates the recognition event into the fluorescence signal [28]. Among various fluorophores, dicyanoisophorone (DCI) based fluorophores have the advantage of near-infrared (NIR) emission, a large Stokes shift, and excellent photostability, making it one of the most popular signal groups for fluorescent probes [29-32]. To achieve longer emission wavelengths and larger Stokes shifts based on DCI, an effective approach is to increase the electron density of π-conjugated linkers (π-conjugated bridge) linked with DCI [33-35]. However, achieving excellent ion selectivity of the fluorescent probes for metal ions, especially Zn2+, remains a critical challenge [22,26,27]. The receptor, which serves as the central processing unit of the probe, must exhibit the strongest affinity with Zn2+. Di-2-picolylamine (DPA) unit is commonly used for Zn2+ detection, but it also has similar affinities for other transition metal ions such as Co2+, Ni2+, Cu2+, Cd2+, and Hg2+ [36]. Commonly, Zn2+ selectivity can be enhanced by optimizing the DPA structure [37]. Xu et al. reported a probe named ZTRS for Zn2+ detection, which was comprised of amide-DPA receptor and a naphthalimide fluorophore. Consequently, ZTRS showed excellent selectivity for Zn2+ over other transition metal ions [38]. Liu et al. introduced the amide-DPA receptor to a nitrobenzofurazan fluorophore, and this probe displayed unexpected high selectivity for Cd2+ rather than Zn2+ [39]. These findings suggest that a probe containing a specialized fluorophore with an amide-DPA-based receptor may achieve the desired selectivity for Zn2+. As mentioned above, we aimed to improve the electron density of the π-conjugated bridge to achieve longer emission wavelengths and larger Stokes shifts in the DCI-based fluorophore. However, it remains unclear whether this modification will improve the ion selectivity of the amide-DPA based receptor for Zn2+.
We addressed the issues here. In this study, various aromatic rings, including benzene, thiophene, and furan rings, are selected as the aromatic π-conjugated bridges. Additionally, thiazole, a widely recognized biocompatible structural unit, is used to modify the amide-DPA receptor to reduce the toxicity of the whole fluorescent probe [40-42]. As shown in Scheme 1, the structures of three fluorescent probes (abbreviated as L1, L2, L3) are presented. Among the three probes, L1, containing the benzene ring with the lowest electron density, exhibited the shortest emission wavelength (600 nm) and poorest ion selectivity. In contrast, L2 and L3 with higher electron density bridges (thiophene and furan, respectively) demonstrated red-shifted emission at 651 nm with a large Stokes shift of 187 nm, and enhanced Zn2+ selectivity. Notably, probe L3, which incorporates a furan ring (exhibiting the highest electron density among the three aromatic systems investigated), achieved optimal performance, demonstrating superior Zn2+ selectivity with a detection limit of 31 nmol/L. In addition, we demonstrated the binding mode of L3 with Zn2+. Furthermore, fluorescence images demonstrated the outstanding capability of L3 for Zn2+ cellular imaging. Importantly, we developed a smart strategy by regulating the electron density of the aromatic π-conjugated bridge to improve the Zn2+ selectivity of the probe, which could be expected to apply to various metal ions detection in future.
L1, L2 and L3 were synthesized following Scheme S1 (Supporting information), and all the structures were confirmed by 1H nuclear magnetic resonance spectra (NMR), 13C NMR, and mass spectrometry (MS) (Figs. S1–S29 in Supporting information). The molecular formulas of L1, L2 and L3 were shown in Scheme 1. Initially, we measured the UV–vis and fluorescence spectra of L1, L2, and L3 (Fig. 1A) and evaluated their selectivity toward metal ions through fluorescence spectra experiment (Fig. 1B and Fig. S30 in Supporting information). As shown in Fig. 1A, the emission wavelength of L1 was observed at 600 nm, with a Stokes shift of 152 nm. In Fig. 1B, the fluorescence intensity at 600 nm of L1 was quenched obviously after the stock solutions of Zn2+, Cd2+, Ag+, Ni2+, Co2+, Hg2+, Cu2+ and Mn2+ treatment, indicating the poor selectivity of L1. Due to the unsatisfactory performance of L1, we aimed to enhance the electron density of the aromatic π-conjugated bridge to achieve longer emission wavelengths and higher metal ion selectivity. It is well known that thiophene ring has a higher electron density than the benzene ring, and thus it was applied in this event [35,43]. As anticipated, compared with L1, L2 exhibited a NIR emission wavelength at 651 nm and an increased Stokes shift raising from 152 nm to 187 nm (Fig. 1A). And the metal ion selectivity of L2 for Zn2+ was improved a lot as indicated by the fluorescence intensity increased 4 times upon the addition of Zn2+ (Fig. 1B). However, Cu2+, Ni2+, and Co2+ were found to quench the fluorescence of L2. Based on this, in order to further enhance Zn2+ selectivity, we replaced the benzene ring with a furan ring, which has an even higher electron density [35]. As a result, L3 showed the same NIR emission and large Stokes shift as L2 (Fig. 1A). Astonishingly, the selectivity of L3 for Zn2+ was significantly improved showed by the fluorescence intensity increased 3 times (Fig. 1B). Among the eleven metal ions investigated, Cu2+ exhibited exclusive capability to induce complete fluorescence quenching of L3, demonstrated by a significant decrease in fluorescence intensity at 651 nm.
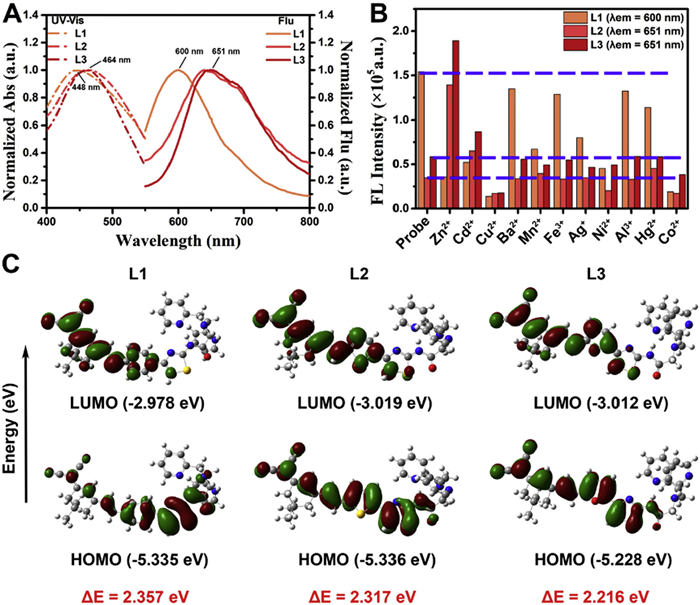
To better understand the relationship between molecular structure and the photophysical properties, time-dependent density functional theory (TDDFT) calculations were performed to calculate the highest occupied molecular orbital (HOMO) and the lowest unoccupied molecular orbital (LUMO) [44]. As shown in Fig. 1C, the band gap energies (ΔE) of L2 and L3 were 2.317 and 2.216 eV, respectively, which is smaller than that of L1 (2.357 eV). As previously reported, a reduced bandgap results in a red-shift in the optical range [45,46]. This outcome demonstrates that enhancing the electron density of aromatic π-conjugated bridges effectively amplifies both the extended emission wavelengths and the larger Stokes shifts. Additionally, the HOMO of these probes is primarily delocalized over the DCI-π-conjugated bridge-thiazole, while the LUMO is largely confined to the DCI and π-conjugated bridge, leading to charge separation (Fig. 1C). In the case of L1 containing a benzene bridge, the HOMO distribution across the DCI-π-conjugated bridge is relatively localized. In contrast, L2 and L3, featuring thiophene and furan bridges respectively, demonstrate enhanced electron delocalization within their π-conjugated bridge systems. This suggests that the strategy of increasing electron density in aromatic π-conjugated bridges enhances HOMO-LUMO orbital overlap through improved electron delocalization. Collectively, aromatic π-conjugated bridges with higher electron density synergistically promote frontier molecular orbital (FMO) overlap and reduce the bandgap, thereby facilitating intramolecular charge transfer and triggering a selective fluorescent response of the probe toward Zn2+ [35,47,48].
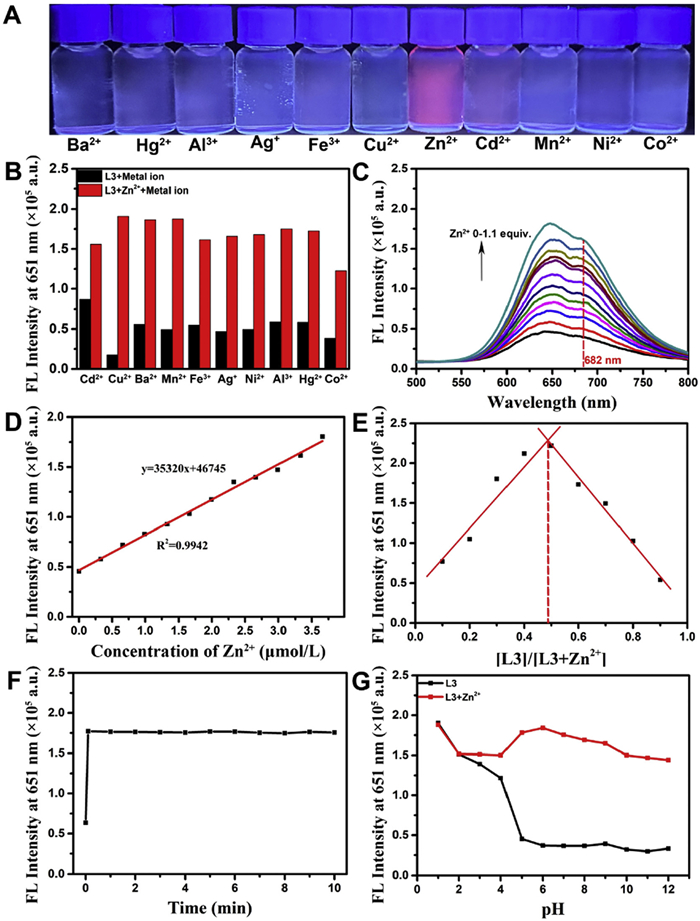
Owing to the strong emission of L3 in the NIR region when combined with Zn2+, the fluorescence could be directly observed by naked eyes. Fig. 2A depicted a photo of L3 solutions containing various metal ions (10.0 equiv.) including Zn2+, Ba2+, Hg2+, Al3+, Ag+, Fe3+, Cu2+, Cd2+, Mn2+, Ni2+ and Co2+ through the UV–vis light. After being irradiated by a bright light with a single wavelength of 365 nm, only the solution with Zn2+ emitted strong red fluorescence, highlighting the exceptional specificity of L3 for Zn2+. To further investigate its ability to recognize Zn2+ in various interference, a series of competitive experiments were performed in the presence of the above metal ions. As shown in Fig. 2B, first, 10.0 equiv. of other metal ions were added to a series of L3 solutions (3.33 × 10⁻⁵ mol/L), and no evident changes in the fluorescence intensity were observed for these metal ions (blank columns). Then, 10.0 equiv. of Zn2+ was added to these mixtures, and all the fluorescence intensity of L3 sharply increased from approximately 0.5 × 10⁵ to 1.7 × 10⁵ (red columns), which indicated that L3 could specifically bind to Zn2+ even under the strong interference of other metal ions. To determine the limit of detection (LOD), varying amounts (0–1.1 equiv.) of Zn2+ were added to L3 solution and the fluorescence intensity was recorded (Fig. 2C). Fig. 2D showed a linear relationship between the fluorescence intensity at 651 nm and the concentration of Zn2+ ranging from 0 to 3.66 × 10⁻⁵ mol/L. And the LOD was determined to be 31 nmol/L [49]. In addition, to ascertain the stoichiometry of L3 and Zn2+, a Job's plot was conducted [50]. Shown as in Fig. 2E, the maximum change in the fluorescence intensity (I0 − I) was found to be at about 0.5 of the molar fraction ([L3]/[L3+Zn2+]), suggesting a 1:1 coordinative stoichiometry. The formation of a 1:1 complex was further confirmed by high-resolution mass spectrometry (HRMS), with a distinct peak at m/z 664.1365 corresponding to [L3+Zn2+−H+]+ (calcd. m/z 664.1468) (Fig. S31 in Supporting information). As shown in Fig. 2F, time-dependent fluorescence changes at 651 nm indicated that L3 responded rapidly to Zn2+, suggesting its potential as an effective probe for real-time monitoring of Zn2+. To expand the applicability of L3 across a wide pH range, the fluorescence response of L3 to Zn2+ was examined at pH values ranging from 1 to 12. In the pH range of 5–12, L3 alone displayed weak fluorescence but showed a dramatic enhancement upon the addition of Zn2+, indicating its ability to detect Zn2+ in a variety of physiological and basic environments. However, L3 displayed strong fluorescence at more acidic conditions (pH < 5), and the further addition of Zn2+ did not result in further improvement (Fig. 2G). This pH-dependent fluorescence changes at low pH may be attributed to the inhibited photoinduced electron transfer (PET) process by protonation of the tertiary amine in DPA [38]. To further verify the stability of L3, we measured L3's fluorescence spectra in different solvents (including DMSO, DMF, MeCN, THF, MeOH, EtOH, Tris, EAC, 1,4-dioxane, DCM and PE) and at varying temperatures (ranging from 10 ℃ to 60 ℃). As shown in Fig. S32A (Supporting information), L3 exhibited stable luminescent properties across various solvents. Additionally, the negligible changes in fluorescence spectra observed at different temperatures further confirm L3's excellent stability (Fig. S32B in Supporting information).
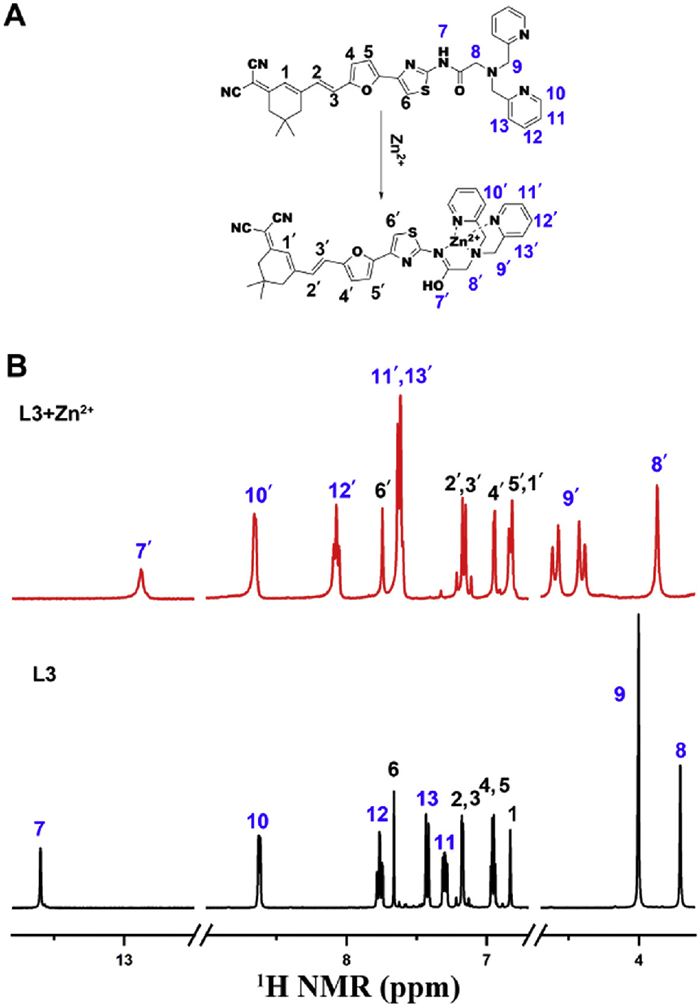
As mentioned above, we have measured the changes of the fluorescence spectra of L3 upon the addition of 10.0 equiv. of Zn2+ in DMSO/Tris–HCl buffer solution, and demonstrated that the fluorescence intensity increased at 651 and 682 nm (Fig. 2C). The same phenomenon was observed when the buffer solution changed into DMSO (Fig. S33 in Supporting information), which proved that the binding mode of L3 with Zn2+ in the DMSO/Tris–HCl buffer solution was similar to that in DMSO. We proposed that the emission spectra observed in DMSO resulted from the transformable ability of L3, where Zn2+ induced a transformation of chelation from an amide to an imidic acid tautomeric form (Fig. 3A). To confirm this form with Zn2+, we conducted 1H NMR experiments of L3 in the presence and absence of Zn2+ in DMSO–d6. As depicted in Fig. 3B, the resonances of protons H8-H13 experienced down-field shifts upon the addition of 1.0 equiv. of Zn2+, indicating the coordination of Zn2+ with the two pyridyl nitrogen atoms and the aliphatic amine nitrogen atom. In addition, the amide moiety binding to Zn2+ resulted in a small up-field shift of H7 from 13.60 ppm to 12.88 ppm, suggesting the formation of an imidic acid tautomeric [38]. Therefore, we proposed that L3 binding to Zn2+ was also in an imidic acid tautomeric form in the DMSO/Tris–HCl buffer solution (Fig. 3A).
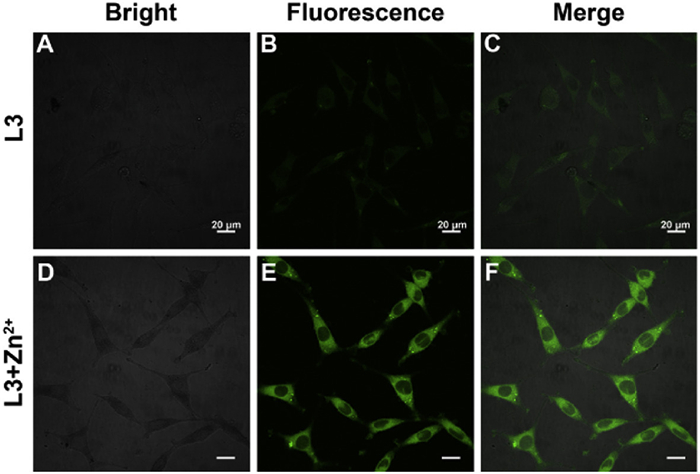
Compared with L1 and L2, L3 exhibited NIR emission, a large Stokes shift and superior anti-interference capability at physiological pH, rendering it an excellent probe for Zn2+ cellular imaging. Initially, we assessed the cytotoxicity of L3 in SHSY5Y cells using the cell counting kit-8 (CCK-8) assay [51,52]. After SHSY5Y cells treated with different concentration of L3 for 24 h, cell viability all remained above 80%, indicating that L3 possessed low cytotoxicity toward SHSY5Y cells (Fig. S34 in Supporting information). For Zn2+ cellular imaging, SHSY5Y cells were incubated with 10 µmol/L L3 for 30 min at 37 ℃ and then washed three times with phosphate buffer saline (PBS). As depicted in Figs. 4A–C, the laser scanning confocal microscopy (LSCM) images revealed extremely weak fluorescence after treated with L3 alone. Differently, a significant increase in fluorescence intensity was observed when cells were co-incubated with both L3 and Zn2+ (Figs. 4D–F). The successful internalization of L3 into SHSY5Y cells highlighted its biocompatibility and suitability for biological applications. The distinct fluorescence signal observed upon Zn2+ adding further confirmed the selectivity and sensitivity of L3 toward Zn2+.
In this study, we developed three fluorescent probes L1, L2 and L3, and demonstrated that enhancing the electron density of the aromatic π-conjugated bridge can effectively improve the emission wavelength, Stokes shift, and ion selectivity of the probes. Among the three probes, L3 achieved NIR emission at 651 nm, a Stokes shift of 187 nm, and superior Zn2+ selectivity with a detection limit of 31 nmol/L. And we also revealed that the amide of L3 bound to Zn2+ was in the form of an imidic acid tautomer through fluorescence and 1H NMR spectra. Furthermore, we successfully applied L3 in live-cell Zn2+ imaging, demonstrating its potential to detect Zn2+ in vivo. This discovery provides valuable insights for optimizing probe performance through the simple introduction of the aromatic π-conjugated bridge.
The authors declare that they have no known competing financial interests or personal relationships that could have appeared to influence the work reported in this paper.
Xindi Yang: Writing – original draft, Software, Methodology, Formal analysis, Data curation. Cunli Wang: Writing – review & editing, Writing – original draft, Validation, Supervision. Dongdong Wang: Software, Methodology, Formal analysis. Haijuan Qin: Formal analysis. Kuoxi Xu: Supervision, Resources, Project administration, Funding acquisition, Conceptualization. Guangyan Qing: Supervision, Resources, Project administration, Funding acquisition.
This work was supported by the National Key R & D Program of China (No. 2022YFC3400800), the National Natural Science Foundation of China (Nos. 21922411 and 22174138), DICP Innovation Funding (Nos. DICP-I202243 and I202229), and the Dalian Outstanding Young Scientific Talent (No. 2020RJ01).
Supplementary material associated with this article can be found in the online version, at doi:
C.J. Frederickson, J.Y. Koh, A.I. Bush, Nat. Rev. Neurosci. 6 (2005) 449–462. doi: 10.1038/nrn1671
J.M. Berg, Y.G. Shi, Science 271 (1996) 1081–1085. doi: 10.1126/science.271.5252.1081
H. Tapiero, K.D. Tew, Biomed. Pharmacother. 57 (2003) 399–411. doi: 10.1016/S0753-3322(03)00081-7
B.L. Vallee, K.H. Falchuk, Physiol. Rev. 73 (1993) 79–118. doi: 10.1152/physrev.1993.73.1.79
J.H. Weiss, S.L. Sensi, J.Y. Koh, Trends Pharmacol. Sci. 21 (2000) 395–401. doi: 10.1016/S0165-6147(00)01541-8
A.I. Bush, Trends Neurosci. 26 (2003) 207–214. doi: 10.1016/S0166-2236(03)00067-5
P. Faller, C. Hureau, G. La Penna, Acc. Chem. Res. 47 (2014) 2252–2259. doi: 10.1021/ar400293h
H. Kozlowski, M. Luczkowski, M. Remelli, D. Valensin, Coord. Chem. Rev. 256 (2012) 2129–2141. doi: 10.1016/j.ccr.2012.03.013
J.H. Viles, Coord. Chem. Rev. 256 (2012) 2271–2284. doi: 10.1016/j.ccr.2012.05.003
M. Siwek, B. Szewczyk, D. Dudek, et al., Pharmacol. Rep. 65 (2013) 1512–1518. doi: 10.1016/s1734-1140(13)71512-3
M.T. Gong, Y.L. Fang, K.J. Yang, et al., Adv. Sci. 11 (2024) 2403405. doi: 10.1002/advs.202403405
C. Dewey, F. Juillot, S. Fendorf, J.R. Bargar, Environ. Sci. Technol. 57 (2023) 4841–4851. doi: 10.1021/acs.est.2c08764
J. Helser, E. Vassilieva, V. Cappuyns, J. Hazard. Mater. 424 (2022) 127313. doi: 10.1016/j.jhazmat.2021.127313
J. Xu, Y.Y. Li, S.L. Wang, et al., J. Hazard. Mater. 441 (2023) 129863. doi: 10.1016/j.jhazmat.2022.129863
F. Wang, K.J. Wang, Q. Kong, et al., Coord. Chem. Rev. 429 (2021) 213636. doi: 10.1016/j.ccr.2020.213636
R.Z. Ouyang, Z.Q. Zhu, C.E. Tatum, J.Q. Chambers, Z.L. Xue, J. Electroanal. Chem. 656 (2011) 78–84. doi: 10.1016/j.jelechem.2011.01.006
K.K. Nielson, A.W. Mahoney, V.C. Rogers, J. Agric. Food Chem. 36 (1988) 1211–1216. doi: 10.1021/jf00084a021
S.V. Smirnova, T.O. Samarina, D.V. Ilin, I.V. Pletnev, Anal. Chem. 90 (2018) 6323–6331. doi: 10.1021/acs.analchem.8b01136
H. Wang, B.B. Chen, M. He, B. Hu, Anal. Chem. 89 (2017) 4931–4938. doi: 10.1021/acs.analchem.7b00134
Y.Y. Wang, H.N. Duan, H.Y. Shi, et al., Chin. Chem. Lett. 31 (2020) 2933–2936. doi: 10.1016/j.cclet.2020.05.028
S.A. Garwin, M.S. Kelley, A.C. Sue, et al., J. Am. Chem. Soc. 141 (2019) 16696–16705. doi: 10.1021/jacs.9b06442
L.Q. Yan, D.Q. Lu, H. Yang, X.Z. Wu, Spectrochim. Acta A: Mol. Biomol. Spectrosc. 290 (2023) 122243. doi: 10.1016/j.saa.2022.122243
F.J. Huo, Q. Wu, J. Kang, Y.B. Zhang, C.X. Yin, Sens. Actuators B: Chem. 262 (2018) 263–269. doi: 10.1016/j.snb.2018.01.185
Z.Q. Mao, L. Hu, X.H. Dong, et al., Anal. Chem. 86 (2014) 6548–6554. doi: 10.1021/ac501947v
W.Y. Li, B.Q. Fang, M. Jin, Y. Tian, Anal. Chem. 89 (2017) 2553–2560. doi: 10.1021/acs.analchem.6b04781
H.N. Duan, Y. Ding, C.S. Huang, et al., Chin. Chem. Lett. 30 (2019) 55–57. doi: 10.1016/j.cclet.2018.03.016
X.D. Wei, Q. Wang, W.Q. Tang, S.L. Zhao, Y.S. Xie, Dyes Pigm. 140 (2017) 320–327. doi: 10.1016/j.dyepig.2017.01.064
J.F. Callan, A.P. de Silva, D.C. Magri, Tetrahedron 61 (2005) 8551–8588. doi: 10.1016/j.tet.2005.05.043
X.Z. Luo, F.F. Yu, R. Wang, et al., Chin. Chem. Lett. 36 (2025) 110531. doi: 10.1016/j.cclet.2024.110531
L. Sheng, H.M. Liu, M. Jin, et al., Chin. Chem. Lett. 35 (2024) 109572. doi: 10.1016/j.cclet.2024.109572
L.X. Dai, Q. Zhang, Q.Q. Ma, W.Y. Lin, Coord. Chem. Rev. 489 (2023) 215193. doi: 10.1016/j.ccr.2023.215193
L.X. Fu, Y.Y. Tan, Y. Ding, W.X. Qing, Y. Wang, Chin. Chem. Lett. 35 (2024) 108886. doi: 10.1016/j.cclet.2023.108886
W.Q. Chen, X.X. Yue, W.X. Li, et al., Sens. Actuators B: Chem. 245 (2017) 702–710. doi: 10.1016/j.snb.2017.01.167
X. Luo, J. Li, J. Zhao, et al., Chin. Chem. Lett. 30 (2019) 839–846. doi: 10.1016/j.cclet.2019.03.012
H.W. Chen, H.W. Cao, J.Z. Li, et al., Spectrochim. Acta A: Mol. Biomol. Spectrosc. 323 (2024) 124901. doi: 10.1016/j.saa.2024.124901
B. Das, P. Gupta, Coord. Chem. Rev. 522 (2025) 216209. doi: 10.1016/j.ccr.2024.216209
Z.C. Xu, J. Yoon, D.R. Spring, Chem. Soc. Rev. 39 (2010) 1996–2006. doi: 10.1039/b916287a
Z.C. Xu, K.H. Baek, H.N. Kim, et al., J. Am. Chem. Soc. 132 (2010) 601–610. doi: 10.1021/ja907334j
Y. Liu, Q.L. Qiao, M. Zhao, et al., Dyes Pigm. 133 (2016) 339–344. doi: 10.1016/j.dyepig.2016.06.017
H.B. Yang, H.T. Qi, Z.S. Hao, et al., Chin. Chem. Lett. 31 (2020) 1271–1275. doi: 10.1016/j.cclet.2019.11.035
M.T. Chhabria, S. Patel, P. Modi, P.S. Brahmkshatriya, Curr. Top. Med. Chem. 16 (2016) 2841–2862. doi: 10.2174/1568026616666160506130731
A.K. Datusalia, G.L. Khatik, Curr. Drug Discov. Technol. 15 (2018) 162. doi: 10.2174/157016381503180620153423
R. Ali, R. Siddiqui, RSC Adv. 12 (2022) 36073–36102. doi: 10.1039/d2ra05768a
S. Sumiya, Y. Shiraishi, T. Hirai, J. Phys. Chem. A 117 (2013) 1474–1482. doi: 10.1021/jp3111315
S.D. Xu, Y.K. Duan, B. Liu, Adv. Mater. 32 (2020) 1903530. doi: 10.1002/adma.201903530
A. Ajayaghosh, Chem. Soc. Rev. 32 (2003) 181–191. doi: 10.1039/B204251G
H.H. Zhangsrt, C.X. Yan, H. Li, et al., ACS Appl. Bio Mater. 4 (2020) 2001–2008.
T. Ye, M. Li, Y. Liu, Molecules 25 (2020) 4465. doi: 10.1021/acscatal.9b05477
Y.X. Chang, H.J. Qin, X. Wang, et al., ACS Sens. 5 (2020) 2438–2447. doi: 10.1021/acssensors.0c00619
F. Ulatowski, K. Dabrowa, T. Bałakier, J. Jurczak, J. Org. Chem. 81 (2016) 1746–1756. doi: 10.1021/acs.joc.5b02909
X.J. Zhao, X.Y. Chen, Y. Wu, et al., Spectrochim. Acta A: Mol. Biomol. Spectrosc. 309 (2024) 123806. doi: 10.1016/j.saa.2023.123806
C.Y. Li, X.K. Wang, X.F. Zhu, J.F. Liu, Y. Ye, Anal. Chim. Acta 1330 (2024) 343265. doi: 10.1016/j.aca.2024.343265

Figure 1 (A) UV–vis and fluorescence spectra of L1, L2 and L3 (3.33 × 10⁻⁵ mol/L) in a DMSO/Tris–HCl buffer solution (v:v = 1:2, 0.01 mol/L, pH 7.30) at room temperature. Spectra were normalized to the maximum emission intensity of each probe. (B) Fluorescence intensity of L1, L2 and L3 upon the addition of various metal ions (10.0 equiv.) in a DMSO/Tris–HCl buffer solution (v:v = 1:2, 0.01 mol/L, pH 7.30) at room temperature. The excitation wavelength (λex) was 464 nm for all the fluorescence measurements. (C) HOMO, LUMO, and band gap energies −ΔE = EHOMO − ELUMO of L1, L2 and L3 obtained through the TDDFT calculation.

Figure 2 (A) Photo of L3 (3.33 × 10⁻⁵ mol/L) upon the addition of different metal ions (10.0 equiv.) in a DMSO/Tris–HCl buffer solution (v:v = 1:2, 0.01 mol/L, pH 7.30) at room temperature, excited with an UV–vis light (365 nm). (B) Fluorescence intensity (at 651 nm) of L3 solution with the addition of different metal ions (10.0 equiv.) in the absence (black) and presence (red) of 10.0 equiv. of Zn2+. (C) Fluorescence spectra and (D) fluorescence intensity changes (at 651 nm) of L3 upon the addition of different equiv. of Zn2+ (0–1.1 equiv.). (E) Job's plot for determining the binding stoichiometry between L3 and Zn2+ in the buffer solution based on the fluorescence intensity changes at 651 nm. (F) Time and (G) pH dependence of fluorescence intensity (at 651 nm) of L3 upon the addition of 10.0 equiv. of Zn2+. The excitation wavelength (λex) was 464 nm for (B–G).

Figure 3 (A) Binding mode of L3 with Zn2+. (B) 1H NMR spectra of L3 alone or in the presence of Zn2+ (1.0 equiv., red) in DMSO–d6.

 扫一扫看文章

扫一扫关注我们
 DownLoad:

 下载:
下载:

 下载:
下载: