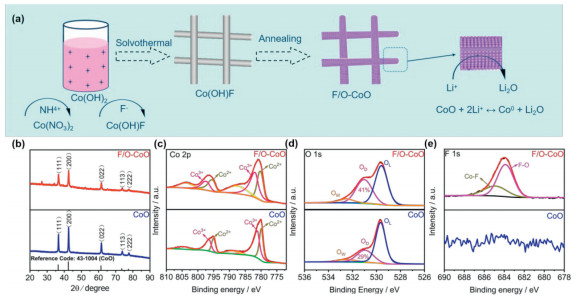
Figure 1.
(a) Synthesis schematic of F/O-CoO composite. (b) XRD patterns of F/O-CoO and CoO composites. XPS (c) Co 2P (d) O 1s and (e) F 1s spectra of F/O-CoO and CoO composites.

Synergy enhancement mechanism of fluorine-doping and oxygen-defect for high-capacity F/O-CoO anode material
Congcong Zhang , Yinan Liu , Pengrui Bao , Yun Zheng , Yingying Shen , Yike Huang , Pingshan Jia , Zhiyuan Zhang , Kunye Yan , Rong Chen , Yuhao Li , Junpo Guo , Huaiyu Shao


The rapid development of portable electronic devices and electric vehicles has led to a significant demand increasement in high energy density lithium-ion batteries (LIBs). Graphite has been regarded as commercial anode material due to its cheap price [1], abundant reserve [2] and low lithiation potential [3,4]. However, its low theoretical capacity (372 mAh/g) is an insurmountable challenge that restricts the energy density enhancement of LIBs [5,6]. Thus, developing high-capacity anode materials is necessary.
Transition-metal oxides (TMOs) such as FeOx, NiO, MnOx, ZnO and CoOx [7–11] have attracted a lot of attention due to their high reversible capacity (600–800 mAh/g) and other outstanding features [12,13]. However, TMOs also suffer from several challenges such as poor Li+/e− conductivity, weaken fast-charging performance and significant volume expansion, leading to capacity and lifespan fading [9,14–16]. Defect engineering, including vacancy and heteroatom doping, is proved to be an effective strategy to solve this dilemma [14,15,17,18], which can optimize the surrounding electronic structure and Li+ migration path of TMOs, thereby reducing their polarization and improving reversible capacity, fast-charge capacity, and capacity retention during battery operation.
Vacuum annealing, plasma engraving, chemical reduction and ammonia treatment can generate oxygen defects and modulate its concentration and distribution of TMOs. Many similar research works have been conducted [15,17,19–21]. For example, Zhang and co-workers synthesized OV-rich WO3−x nanorod composite through a universal ammonia treatment strategy, which can extract the O atom of TMOs based on its chemical reaction with NH3 at low temperature [22]. The formation of H2O and N2O will facilitate the oxygen vacancy enrichment of WO3−x material. Yong and co-workers developed an OV-rich ZnO nanorod array through a simple vacuum annealing process, which contributed to abundant oxygen vacancy formation [23]. Benefiting from these oxygen vacancy-rich advantages, TMO anode materials generally have high reversible capacity.
Heteroatom (S, P, Mn and F) doping strategy can also contribute to the reduced polarization and capacity enhancement of TMO anode materials due to a similar mechanism [24–27]. Qian and co-workers developed a fan-shaped Mn-CoO/C composite with C4H6MnO4·4H2O and C4H6CoO4·4H2O as Mn and Co sources by a simple hydrothermal method [27]. The Mn doping makes the layered CoO more compact, thus improving the structure stability of Mn-CoO/C. Specifically, the Mn-CoO/C exhibited an excellent lithium storage performance with 98% retention after 200 cycles at 0.1 C and a rate performance of 481.2 mAh/g at 10 C.
F-doping plays an important role in improving the Li+/e− conductivity and structural stability of TMOs. To explore the promotion mechanism of F element doping, Geng and co-workers synthesized a three-dimensional F-SnO2@RGO composite via a one-step hydrothermal method [24]. F doping can facilitate its Li+/e− conductivity due to the improved electronic structure, reduce its charge transfer resistance due to easily electrolyte/electrode interface wettability, as well as its fracture resistance improvement due to the SEI chemical optimization. As a result, the F-SnO2@RGO anode delivered a high reversible capacity of 1277 mAh/g after 100 cycles and a good rate capacity of 634 mAh/g at 5 A/g. Heteroatoms and oxygen vacancies in TMO, which is a synergy enhancement for electric performance. Chen and co-workers introduced oxygen vacancies (OVs) and phosphorus atoms in Co3O4 by Ar plasma treatment and following low-temperature P doping (POV200), respectively [28]. OVs significantly decreased the energy barrier of P-atom doping, thus forming stable Co—P bonds. Meanwhile, P doping can improve the local electronic structure to suppress the irreversible annihilation of OVs during the cycling. POV200 delivered a reversible capacity of 751.5 mAh/g at 0.5 A/g after 300 cycles, 2.6 times higher than pristine Co3O4 (287.8 mAh/g). However, the synergy enhancement mechanism of F atoms and oxygen defects in TMOs still has not been studied.
Herein, a novel F-doped and oxygen defect CoO composite (F/O-CoO) is synthesized through a facile hydrothermal and annealing process. During material preparation, several O atoms tend to escape from the F/O-CoO lattice and be replaced by F atoms, thus contributing to the formation of F-doped and oxygen defect features. DFT calculation demonstrated that the Li+ adsorption energy and bandgap energy of F/O-CoO composite are lower than the compared CoO composite, which contributed to its poor polarization and high capacity. As a result, the F/O-CoO anode delivered a high reversible capacity of 1112 mAh/g, a good rate capacity of 449 mAh/g at 5 C, as well as a capacity retention of 79.1% after 400 cycles at 2 C.
The schematic illustration of F/O-CoO composite is described in Fig. 1a. During the preparation process, Co(NO3)2 tends to transform into Co(OH)2 under an alkaline environment and then absorb surrounding F− ions that facilitate the formation of Co(OH)F. One-dimensional F/O-CoO nanorod composite is obtained through the annealing treatment of Co(OH)F. As a comparison, CoO is obtained through the annealing treatment of Co(OH)2. The X-ray diffraction (XRD) patterns of F/O-CoO and CoO composites are described in Fig. 1b. The diffraction peaks of F/O-CoO and CoO composites at 36.5°, 42.4°, 61.5°, 73.7° and 77.5° are corresponding to the (111), (200), (220), (311) and (222) lattice planes of CoO (PDF #43-1004). No diffraction peaks of COF2 composite are observed, indicating that F has been successfully doped into the crystal lattices of CoO [29].
The defect information of F/O-CoO and CoO composites is further characterized by X-ray photoelectron spectroscopy (XPS) (Figs. 1c and d, Fig. S1 in Supporting information), which is an effective research strategy. As their Co 2p XPS spectra described in Fig. 1c, two fitting peaks at around 795.3 eV and 780.1 eV belong to Co2+, and another two peaks at around 797.3 eV and 781.8 eV are belong to Co3+ [30]. When compared to the CoO composite, the weak peak position left shift (0.88 eV) of F/O-CoO composite is attributed to the formation of F doped and oxygen defect that improves the electronic structure surrounding the Co atom [31]. Besides, their O 1s spectra are also provided in Fig. 1d. It can be clearly observed that the oxygen defect (Od) of F/O-CoO composite is calculated to be 41%, which is higher than the compared CoO composite (29%). The Od concentration increasement of F/O-CoO composite is beneficial to improve Li+/e− conductivity, reduce polarization, and thus contribute to high reversible capacity [15,17]. The F 1s spectra of F/O-CoO and CoO composites are described in Fig. 1e, a fitting peak at 683.9 eV corresponds to the F—O bond and another fitting peak at 684.9 eV corresponds to Co—F bond. This result demonstrates the formation of F doping, which is largely attributed to several lattice oxygen atoms replaced by fluorine atoms due to the latter greater electronegativity [32,33]. Benefiting from the synergy of F doping and oxygen defect, the F/O-CoO composite has higher reversible capacity due to optimized bandgap energy and reduced Li+ adsorption energy, which contributes to lower polarization than the compared CoO anode.
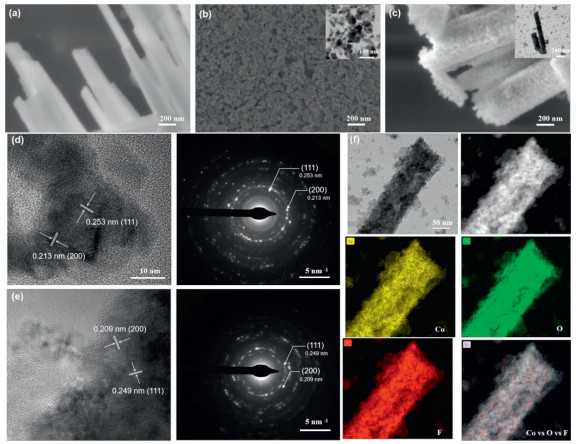
The morphology of F/O-CoO and CoO composites are further analyzed by scanning electron microscope (SEM) and transmission electron microscope (TEM). Both Co(OH)F and F/O-CoO composites are one-dimensional nanorod structures (Figs. 2a and c), while the compared CoO composite is graininess structure with a particle size range from 50 nm to 80 nm (Fig. 2b). It is largely attributed to the positive role of F doped in promoting lattice growth and maintaining structural stability. It can be inferred that the F/O-CoO composite with nanorod structure has better Li+/e− conductivity and lower polarization than the compared CoO composite with broken structure, which contributes to its higher reversible capacity [15,34]. HRTEM and SADE images of F/O-CoO and CoO composites are also provided. As described in Fig. 2d, the lattice spacing of 0.253 and 0.213 nm belong to the (111) and (200) crystal planes of CoO for the CoO composite, and the lattice spacing of 0.249 and 0.209 nm belong to the (111) and (200) crystal planes of CoO for the F/O-CoO composite (Fig. 2e), which are consistent with their SADE and XRD results. The shortened lattice spacing of F/O-CoO composite is attributed to the formation of oxygen defects and F doping with strong electronegativity. No CoF₂ phase are observed. HAADF mapping images of F/O-CoO composite are described in Fig. 2f, Co, O, and F elements are well-distributed through the whole nanorod, which demonstrates the formation of F doping [35]. Besides, it can be clearly observed that the F/O-CoO composite also has a smaller surface area than the CoO composite. Fig. S2 (Supporting information) is the N2 adsorption-desorption isotherm and BJH pore size distribution of F/O-CoO and CoO. It shows a typical IV-shaped curve with H3 hysteresis loops [36], indicating the presence of mesoporous structure [37]. The specific surface area and average pore size of CoO are 46.5 m2/g and 10.3 nm, but decrease to 28.5 m2/g and 16.1 nm after F doping. Specifically, the F/O-CoO nanorods have a smaller area exposed to the electrolyte, which contributes to its less formation of SEI and polarization than the compared CoO [12,38].
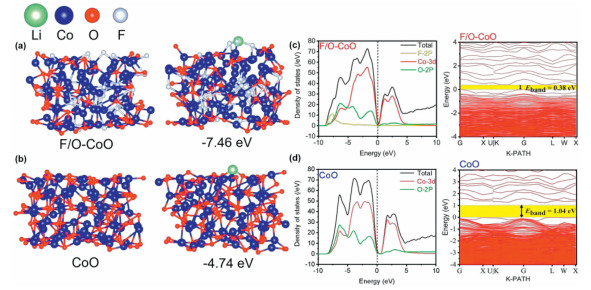
High concentrated oxygen defect contributes to the good Li+/e− conductivity of F/O-CoO composite, as well as its increased binding sites for Li+ storage [39,40]. It is attributed to the reason that the removal of O2− ion contributes to the highly delocalized neighboring oxygen defect and surrounding locally built-in electric field [15]. The existence of F doping can also increase the oxygen defect concentration of F/O-CoO composite, thus improving its Li+/e− conductivity and Li+ storage capacity as a synergy role of oxygen defect. Besides, to explore the further capacity enhancement mechanism of F doping, the Li+ adsorption energy and bandgap energy of F/O-CoO and CoO composites through DFT calculation are described in Fig. 3. The Li+ adsorption energy of F/O-CoO composite is calculated to be −7.46 eV, which is much lower than CoO composite (−4.74 eV), which provides lower polarization and better Li+ kinetic performance (Figs. 3a and b). It is largely attributed to the fact F doping with high electronegativity can increase oxygen defect concentration and thus result in more imbalanced charge distribution around these oxygen defects [32,41,42]. This is an effective strategy to make sure the electric field orientation from oxygen defect free area to oxygen defect area, thus accelerating Li+ migration and reducing Li+ adsorption energy [15]. To be further, relevant energy band structure and DOS calculation of F/O-CoO and CoO composites are also provided in Figs. 3c and d. The bandgap energy of F/O-CoO and CoO composites are calculated to be 1.04 eV and 0.38 eV. It can be inferred that benefiting from the synergy of F doping and oxygen defect, the F/O-CoO composite has a significant DOS decrease at the fermi level than the CoO composite, therefore ensuring its good Li+/e− conductivity.
To explore the capacity enhancement mechanism of F/O-CoO composite that based on the synergy of F doping and oxygen defect, F/O-CoO and CoO coin cells are assembled to evaluate their battery performance. Their cyclic voltammetry (CV) curves with a potential wide of 0.01–3.0 V are described in Figs. 4a and b. For and CoO anodes during the initial lithiation/de-lithiation process, two irreversible reduction peaks at 0.77 V and 1.08 V are ascribed to the formation of SEI chemicals, respectively [39,43,44], and another two reduction peaks at 0.59 and 0.83 V are ascribed to the reaction process from CoO to Co. Meanwhile, two oxidation peaks of F/O-CoO at 1.41 and 2.12 V (1.31 and 2.08 V for the CoO electrode) are ascribed to the oxidation of Co to Co2+ and the decomposition of Li2O. It indicates that the F/O-CoO anode has better Li+ kinetics performance and lower polarization than the compared CoO anode.
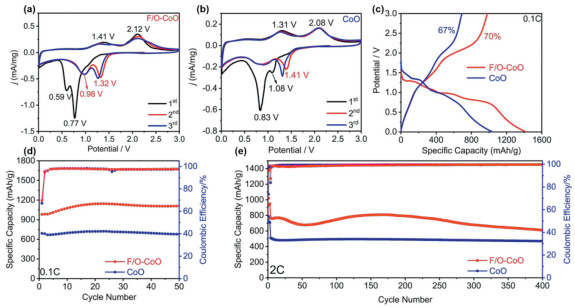
The initial discharge-charge profiles of F/O-CoO and CoO anodes are provided in Fig. 4c, and the F/O-CoO delivers an initial charge capacity of 981 mAh/g and an initial coulombic efficiency (ICE) of 70%, which is higher than the CoO anode (692 mAh/g and 67%). The higher ICE value of the F/O-CoO anode is largely attributed to its one-dimensional nanorod structure, which contributes a smaller specific surface area and a thinner formation of SEI. The cycling performance of F/O-CoO and CoO anodes at 0.1 C and 2 C are also conducted and provided in Figs. 4d and e. It can be clearly observed that at a current density of 0.1 C, the F/O-CoO anode delivers a significantly higher reversible capacity of 1112 mAh/g over 50 cycles than the CoO anode (676 mAh/g). Furthermore, at a current density of 2 C, the F/O-CoO anode delivers 808 mAh/g reversible capacity with 98.2% capacity retention after 200 cycles and a reversible capacity of 609 mAh/g after 400 cycles, which are much higher than the compared CoO anode (674 mAh/g, 95.8% and 470 mAh/g). The high reversible capacity of F/O-CoO is superior to those reported previously for other electrodes based on CoO (Table S1 in Supporting information). It can be inferred that the capacity improvement of the F/O-CoO anode can be ascribed to the synergy of F doping and oxygen defect that improve Li+/e− conductivity and reduce polarization, as well as the one-dimensional nanorod structure and small specific surface area that reduce side reaction during battery operation.
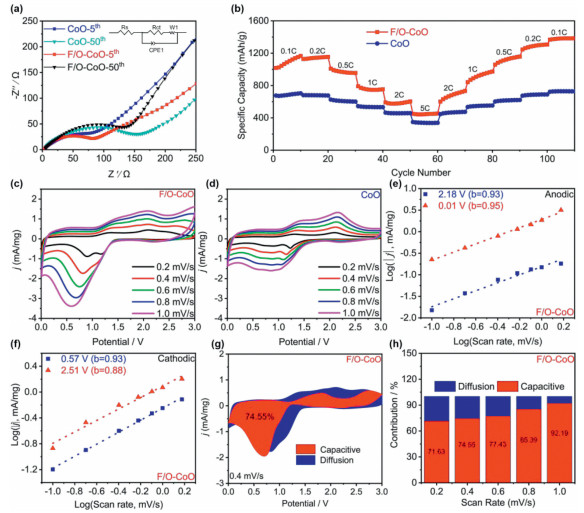
The effect of Li+ migration kinetics on the capacity enhancement mechanism of F/O-CoO anode is investigated. EIS tests and fitting parameters of F/O-CoO and CoO anodes are conducted at their 5th and 50th cycles are described in Fig. 5a and Table S2 (Supporting information). It can be clearly observed that the F/O-CoO anode delivers charge transfer resistance values of 78 Ω and 137 Ω at their 5th and 50th cycles, which is lower than the compared CoO anode (81 Ω and 159 Ω). Besides, the rate performance of F/O-CoO and CoO anodes from 0.1 C to 5 C are described in Fig. 5b, it can be clearly observed that the F/O-CoO anode delivers the rate capacities of 1018, 790 and 449 mAh/g at 0.1, 1 and 5 C, respectively, and its rate performance is also superior to the CoO anode. The rate capacity enhancement of F/O-CoO anode is also largely attributed to the synergy of F doping and oxygen defect, which contributes to high Li+/e− conductivity and low polarization.
To assess the superior rate performance of the F/O-CoO, the Li+ diffusion coefficients (DLi+) for F/O-CoO and CoO are evaluated by the galvanostatic intermittent titration technique (GITT) in Fig. S3 (Supporting information). According to Eq. 1 [45], the diffusion coefficients of F/O-CoO during charge/discharge are between 10−7 cm2/s and 10−10 cm2/s, which are magnitude higher than CoO (10−9 and 10−12 cm2/s). This result is attributed to the synergy of F doping and oxygen defect, which significantly improves the Li+ diffusion capabilities of F/O-CoO.
|
|
(1) |
To be further, as described in Figs. 5c and d, the CV curves of F/O-CoO and CoO anodes at different scan rates from 0.1 mV/s to 1 mV/s are explored to distinguish the capacitive contribution and diffusion contribution during the entire Li+ migration kinetics process. The F/O-CoO anode delivers a higher current density than the CoO anode. It is well known that the Li+ migration kinetics process contains a capacitive control contribution from surface charge transfer and another diffusion control contribution from lithiation/de-lithiation [36]. Thus, the Li+ migration kinetics process can be expounded as the following two equations (Eqs. 2 and 3).
|
|
(2) |
|
|
(3) |
It can be observed that the b-value of F/O-CoO anode ranges from 0.88 to 0.95, which approaches to 1.0, indicating that the capacitive control contribution might predominate during the entire operation process [46,47]. Moreover, the F/O-CoO anode delivers higher b-values than the CoO anode (Fig. S4 in Supporting information), which is attributed to high Li+/e− conductivity and low polarization that arises from the synergy of F doping and oxygen defect. To be further, the capacitive contribution (k1v1/2) and diffusion contribution (k2v) of F/O-CoO anode are quantified based on another two equations (Eqs. 4 and 5):
|
|
(4) |
|
|
(5) |
As described in Figs. 5g and h, it can be clearly observed that the capacitive contribution of F/O-CoO anode is calculated to be 71.63%, 74.55%, 77.43%, 85.39% and 92.19% at scan rates of 0.2, 0.4, 0.6, 0.8 and 1.0 mV/s, respectively. The high capacitive contribution of F/O-CoO anode also arises from the synergy of F doping and oxygen defect, which significantly improves the electron structure surrounding Co atoms. It improves the Li+/e− conductivity and reduces the polarization of F/O-CoO anode, thus contributing to its capacity enhancement.
In summary, the F/O-CoO composite with F doping and oxygen defect is synthesized through a facile hydrothermal and annealing process under an inert atmosphere. Benefiting from the unique nanorod structure, the F/O-CoO composite has a small specific surface area and side reactions during battery operation. Both F doping and oxygen defect of F/O-CoO composite play an important role in reducing Li+ adsorption energy and bandgap energy, thus contributing to its good Li+/e− conductivity, low polarization and many Li+ storage sites. Besides, the formation of F doping with high electronegativity can also increase oxygen defect concentration. Since the synergy of F doping and oxygen defect, the F/O-CoO anode delivers higher reversible capacity, rate capacity and capacity retention than the CoO anode during battery operation. More importantly, we expect to provide an effective strategy to explain the capacity enhancement contribution of doping and defects for electrode materials.
The authors declare that they have no conflict of interest.
Congcong Zhang: Writing – original draft, Visualization, Formal analysis, Data curation. Yinan Liu: Visualization, Supervision, Data curation. Pengrui Bao: Data curation. Yun Zheng: Validation, Data curation. Yingying Shen: Visualization, Methodology. Yike Huang: Data curation. Pingshan Jia: Formal analysis, Data curation. Zhiyuan Zhang: Data curation. Kunye Yan: Methodology, Data curation. Rong Chen: Methodology, Data curation. Yuhao Li: Formal analysis, Data curation. Junpo Guo: Writing – review & editing, Supervision, Resources. Huaiyu Shao: Writing – review & editing, Resources, Project administration, Funding acquisition, Conceptualization.
This work was supported by the Shenzhen-Hong Kong-Macao Science and Technology Plan Project (Category C) (No. SGDX20220530111004028), the Macao Science and Technology Development Fund (FDCT) for funding (FDCT-MOST joint project Nos. 0026/2022/AMJ and 006/2022/ALC of the Macao Centre for Research and Development in Advanced Materials (No. 2022-2024)), the Multi-Year Research Grant (MYRG) from University of Macau (No. MYRG-GRG2024-00206-IAPME), Natural Science Foundation of Guangdong Province (No. 2023A1515010765), Science and Technology Program of Guangdong Province of China (No. 2023A0505030001), the Macau Science and Technology Development Fund (FDCT) for funding FDCT No. 0013/2024/RIB1.
Supplementary material associated with this article can be found, in the online version, at doi:
Y. Lei, D. Han, J. Dong, et al., Energy Storage Mater. 24 (2020) 319–328. doi: 10.1016/j.ensm.2019.07.043
J.X. Wu, Y.L. Cao, H.M. Zhao, et al., Carbon Energy 1 (2019) 57–76. doi: 10.1002/cey2.2
P. Liu, H. Wang, T. Huang, et al., Chin. Chem. Lett. 35 (2024) 108330. doi: 10.1016/j.cclet.2023.108330
Y. Li, Y.X. Lu, P. Adelhelm, et al., Chem. Soc. Rev. 48 (2019) 4655–4687. doi: 10.1039/c9cs00162j
W. Zhang, L. Wang, G. Ding, et al., Chin. Chem. Lett. 34 (2023) 107328. doi: 10.1016/j.cclet.2022.03.051
Y. Yan, X. Zhao, H. Dou, et al., Chin. Chem. Lett. 32 (2021) 910–913. doi: 10.1016/j.cclet.2020.07.021
M. Ahmad, Y.Y. Shi, A. Nisar, et al., J. Mater. Chem. 21 (2011) 7723–7729. doi: 10.1039/c1jm10720h
Y.M. Lin, P.R. Abel, A. Heller, C.B. Mullins, J. Phys. Chem. Lett. 2 (2011) 2885–2891. doi: 10.1021/jz201363j
H. Guan, X. Wang, H.Q. Li, et al., Chem. Commun. 48 (2012) 4878–4880. doi: 10.1039/c2cc30843f
J. Chen, Y. Wang, X. He, et al., Electrochim. Acta 142 (2014) 152–156. doi: 10.1016/j.electacta.2014.07.089
N. Hu, Z. Tang, P.K. Shen, RSC Adv. 8 (2018) 26589–26595. doi: 10.1039/c8ra03599g
C.C. Zhou, J.Z. Liu, S.Z. Guo, et al., ChemElectroChem 7 (2020) 1573–1580. doi: 10.1002/celc.201902117
L.H. Wang, X.L. Teng, Y.F. Qin, Q. Li, Ceram. Int. 47 (2021) 5739–5746. doi: 10.1016/j.ceramint.2020.10.160
M.V. Reddy, G. Prithvi, K.P. Loh, B.V.R. Chowdari, ACS Appl. Mater. Interfaces 6 (2014) 680–690. doi: 10.1021/am4047552
Q. Li, Y. Zhao, H. Liu, et al., ACS Nano 13 (2019) 11921–11934. doi: 10.1021/acsnano.9b06005
Y. Hu, Z. Li, Z. Hu, et al., Small 16 (2020) 2003643. doi: 10.1002/smll.202003643
Z. Cai, Y. Bi, E. Hu, et al., Adv. Energy Mater. 8 (2018) 1701694. doi: 10.1002/aenm.201701694
L. Fan, X. Guo, W. Li, et al., Chin. Chem. Lett. 34 (2023) 107447. doi: 10.1016/j.cclet.2022.04.045
Y. Zhou, H. Xie, C. Wang, et al., J. Phys. Chem. C 121 (2017) 15589–15596. doi: 10.1021/acs.jpcc.7b04533
Y. Zou, W. Zhang, N. Chen, et al., ACS Nano 13 (2019) 2062–2071.
Y. Zhang, Y. Hu, Z. Wang, et al., Adv. Funct. Mater. 30 (2020) 2004172. doi: 10.1002/adfm.202004172
D.L. Liu, C.H. Wang, Y.F. Yu, et al., Chem 5 (2019) 376–389. doi: 10.1504/ijcse.2019.103942
M. Baek, D. Kim, K. Yong, ACS Appl. Mater. Interfaces 9 (2017) 2317–2325. doi: 10.1021/acsami.6b12555
J. Sun, L. Xiao, S. Jiang, et al., Chem. Mater. 27 (2015) 4594–4603. doi: 10.1021/acs.chemmater.5b00885
Y. Qin, Z. Jiang, L. Guo, et al., J. Mater. Chem. A 7 (2019) 21270–21279. doi: 10.1039/c9ta08394d
Z. Wang, X. Zhang, Y. Sun, et al., J. Alloys Compd. 740 (2018) 446–451. doi: 10.1016/j.jallcom.2017.12.020
M. Cui, X. Chen, Z. Wang, et al., J. Alloys Compd. 903 (2022) 163980. doi: 10.1016/j.jallcom.2022.163980
Y. Wu, D. Chen, H. Xu, et al., Appl. Surf. Sci. 623 (2023) 157047. doi: 10.1016/j.apsusc.2023.157047
W. Liu, Y. Chu, J. Zhou, et al., Small Sci. 3 (2023) 2300006. doi: 10.1002/smsc.202300006
Q. Li, Y. Wang, J. Zeng, et al., Chin. Chem. Lett. 32 (2021) 3355–3358. doi: 10.1016/j.cclet.2021.03.063
J. Song, Y. Chen, Y. Li, et al., J. Alloys Compd. 958 (2023) 170518. doi: 10.1016/j.jallcom.2023.170518
P. Wang, Q. Cheng, C. Mao, et al., J. Power Sources 502 (2021) 229903. doi: 10.1016/j.jpowsour.2021.229903
L. Chen, J. Chang, Y. Zhang, et al., Chem. Commun. 55 (2019) 3406–3409. doi: 10.1039/c9cc00555b
J.S. Do, C.H. Weng, J. Power Sources 159 (2006) 323–327. doi: 10.1016/j.jpowsour.2006.04.054
C.X. Hou, Y. Hou, Y.Q. Fan, et al., J. Mater. Chem. A 6 (2018) 6967–6976. doi: 10.1039/c8ta00975a
X. Li, Q. Chu, M. Song, et al., Appl. Surf. Sci. 618 (2023) 156658. doi: 10.1016/j.apsusc.2023.156658
J. Wang, H. Wang, F. Li, et al., J. Mater. Chem. A 7 (2019) 3024–3030. doi: 10.1039/c9ta00045c
E. Peled, S. Menkin, J. Electrochem. Soc. 164 (2017) A1703. doi: 10.1149/2.1441707jes
A.K. Rai, L.T. Anh, J. Gim, J. Kim, Ceram. Int. 39 (2013) 9325–9330. doi: 10.1016/j.ceramint.2013.05.049
Y. Wang, T. Zhou, K. Jiang, et al., Adv. Energy Mater. 4 (2014) 1400696. doi: 10.1002/aenm.201400696
T. Katayama, A. Chikamatsu, Y. Hirose, et al., J. Mater. Chem. C 2 (2014) 5350–5356. doi: 10.1039/C4TC00558A
J. Ahn, D.C. Chen, G.Y. Chen, Adv. Energy Mater. 10 (2020) 2001671. doi: 10.1002/aenm.202001671
P. Poizot, S. Laruelle, S. Grugeon, et al., Nature 407 (2000) 496–499. doi: 10.1038/35035045
L.J. Zhang, P. Hu, X.Y. Zhao, et al., J. Mater. Chem. 21 (2011) 18279–18283. doi: 10.1039/c1jm12990b
N. Wu, J. Shen, X. Zhou, S. Li, et al., Adv. Energy Mater. 15 (2025) 2405729. doi: 10.1002/aenm.202405729
Y. Chu, B. Xi, S. Xiong, Chin. Chem. Lett. 32 (2021) 1983–1987. doi: 10.1016/j.cclet.2020.10.024
D. Yang, T. Lv, J. Song, et al., J. Phys. Chem. Solid 189 (2024) 111956. doi: 10.1016/j.jpcs.2024.111956

Figure 1 (a) Synthesis schematic of F/O-CoO composite. (b) XRD patterns of F/O-CoO and CoO composites. XPS (c) Co 2P (d) O 1s and (e) F 1s spectra of F/O-CoO and CoO composites.

Figure 2 (a) SEM image of Co(OH)F. SEM images of (b) CoO and (c) F/O-CoO composites. HRTEM and SAED images of (d) CoO and (e) F/O-CoO composites. (f) HAADF mapping image of F/O-CoO composite.

Figure 3 Simulation and Li+ adsorption energy calculation of (a) F/O-CoO and (b) CoO composites. Relevant DOS calculation of (c) F/O-CoO and (d) CoO composites.

Figure 4 Initial three CV curves of (a) F/O-CoO and (b) CoO anodes. (c) The initial discharge-charge profiles of F/O-CoO and CoO anodes at 0.1 C. Cycling performance of F/O-CoO and CoO anodes at (d) 0.1 C and (e) 2 C.

Figure 5 (a) Nyquist plots and (b) rate performance of F/O-CoO and CoO anodes. CV curves of (c) F/O-CoO and (d) CoO anodes at different scan rates from 0.1 mV/s to 1 mV/s. Current responses plotted of F/O-CoO and CoO anodes against different (e) anodic and (f) cathodic scan rates. (g) Capacitive contribution to the Li+ migration kinetics of F/O-CoO anode at a scan rate of 0.4 mV/s. (h) Capacitive and diffusion contribution comparison of F/O-CoO anode at different scan rates.

 扫一扫看文章


扫一扫关注我们
 DownLoad:
 下载:
下载:
 下载:
下载: