Figure 1.
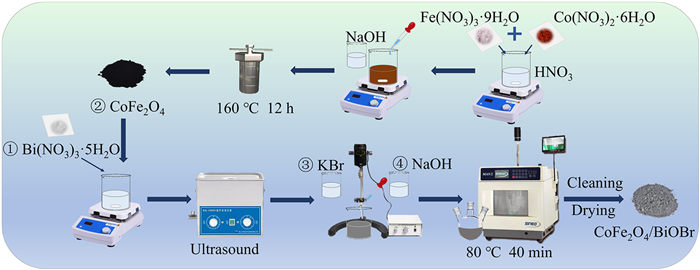
Preparation flow chart of CoFe2O4 and CoFe2O4/BiOBr.
A magnetically recyclable CoFe2O4/BiOBr S-scheme heterojunction for efficient photocatalytic degradation of diuron: Performance, durability and mechanism exploration
Guie Li , Chunyan Yang , Qiu Yang , Qingzhu Zheng , Menghan Li , Jianhua Qu , Guangshan Zhang

Agriculture and human activities have exacerbated environmental pollution, with the global annual pesticide use reaching about 3.7 million tons, of which herbicides account for about 50% [1]. Diuron (DUR), a phenylurea herbicide with low solubility, high stability and strong permeability, is widely used in agricultural production [2]. It is mainly employed for the control of annual or perennial weeds in fields of grains, cotton and sugar cane, and other crops [3,4]. Once applied, diuron will penetrate into the soil and water environment through air circulation and irrigation runoff. It is bio-toxic and difficult to be biodegraded [5], and therefore has a long-lasting impact on the environment. And diuron poses a potential threat to human health, as it may cause endocrine disruption, reproductive toxicity, and even symptoms such as cancer and birth defects [6]. At present, diuron and its metabolites have been detected in rivers, lakes, groundwater and coastal waters in Japan [7], China [8], Brazil [9], Australia [10], United States [11], France [12] and other countries. To address the serious environmental challenges posed by monuron to the environment, photocatalytic oxidation technology has received considerable attention due to its green and environmentally friendly characteristics, as well as its unique advantage of not requiring additional oxidising agents [13–16]. This technology has demonstrated significant advantages and excellent results in the treatment of recalcitrant toxic pollutants in aquatic environments. However, practical applications still need to overcome key issues such as low solar energy utilization and difficult catalyst recovery. In order to develop efficient photocatalysts that can be driven by visible light, researchers have conducted in-depth studies of various photocatalytic materials [17–20].
Among numerous photocatalysts, bismuth-based materials are known for their exceptional properties and are widely used in various catalytic reactions as efficient solar-driven photocatalysts [20,21]. Bismuth oxyhalides (BiOX, X = Cl, Br, I), as a typical bismuth-based photocatalyst, are considered as promising candidates in photocatalysis. Among them, BiOBr has a unique layered structure, consisting of alternately stacked [Bi2O2]2+ layers and Br- layers [22]. The stacking between atomic layers mainly depends on the interaction of van der Waals force, which facilitates the formation of a built-in electric field inside BiOBr. This electric field plays a pivotal role in the separation and transfer of photogenerated carriers [23,24]. Therefore, BiOBr has an excellent visible light absorption capacity, but still cannot avoid the limitation of the recombination rate of photogenerated carriers to its original photocatalytic performance. To this end, various modification strategies have been explored to enhance their photocatalytic efficiency, such as doping modification to regulate the band structure [25–27], using semiconductor composite modification to promote charge carrier separation and transmission [28], and introducing defect engineering (such as oxygen vacancies, metal vacancies) to capture photogenerated electrons and regulate surface activity [27,29]. Despite the progress made so far, a key challenge remains to be addressed: the powdered form of the photocatalyst makes it difficult to recover and prone to causing secondary pollution in practical applications. The efficiency of conventional loading methods is significantly reduced due to limited contact area and slow mass transfer rate. In contrast, the magnetic recovery method shows high efficiency and reliability. The combination of photocatalyst and magnetic material can not only improve the catalytic efficiency, but also prevent secondary pollution, which is beneficial for practical applications.
In recent years, there has been a growing interest in the use of magnetic materials as modified materials for photocatalysis [30–32]. It is worth mentioning that spinel ferrite (XFe2O4) with a narrow band gap (about 1–2 eV) [33,34] is widely regarded as a promising magnetic multifunctional semiconductor material due to its structural stability, high catalytic activity and excellent magnetic separation properties [35–37]. It can be quickly and efficiently separated and recovered by an external magnetic field. As a spinel-type compound, CoFe2O4 can act as a light absorber under sunlight irradiation, generating a local high temperature (photothermal effect) and accelerating the reaction rate [38]. It is worth noting that CoFe2O4 also has magnetic properties, which makes the recovery process of photocatalysts efficient and convenient [14]. In addition, it has semiconductor-like properties and can be combined with other photocatalysts to form heterojunctions, which significantly enhances the photocatalytic activity. For example, He et al. synthesized p-n CoFe2O4/g-C3N4 heterojunctions with different morphologies to enhance electron transfer and charge separation efficiency [33]. In addition, Feng et al. successfully synthesized a double Z-type GCNQDs-CoTiO3/CoFe2O4 photocatalytic material and applied it to the degradation process of oxytetracycline [39]. This innovative initiative has significantly improved the photocatalytic performance, and the material itself has also demonstrated excellent stability and recyclability. However, the composite research of BiOBr and magnetic CoFe2O4, especially for the degradation of diuron, is extremely scarce, and the synergistic mechanism of the two has not been clarified.
Herein, a magnetically recyclable CoFe2O4/BiOBr S-scheme heterojunction was successfully constructed by microwave-assisted coprecipitation for photocatalytic degradation of pesticide DUR. This work aims to address the aforementioned gaps by (1) designing a magnetic photocatalyst tailored for diuron degradation, (2) elucidating the S-scheme charge transfer mechanism between CoFe2O4 and BiOBr, and (3) providing a comprehensive analysis of degradation pathways and intermediate toxicity. Firstly, the physicochemical properties of the CoFe2O4/BiOBr composite photocatalysts were characterized, followed by a focused evaluation of the photocatalytic degradation performance and the anti-interference. Secondly, the recyclability, stability and applicability of the material were investigated in detail. Thirdly, the main active substances of the photocatalytic reaction process and the degradation mechanism of DUR were determined by capture experiments and electron paramagnetic resonance (EPR) detection. Additionally, the possible degradation pathways of DUR were explained based on density functional theory (DFT) and the identification of intermediates, and the toxicity of intermediates was evaluated using quantitative structure-activity relationship (QSAR).
All chemical reagents and solvents used were of analytical grade and deionized water was used throughout the experiments (details in Text S1 in Supporting information).
CoFe2O4 was prepared using a conventional hydrothermal method. Firstly, 2 mmol of Co(NO3)2·6H2O and 4 mmol of Fe(NO3)3·9H2O were dissolved in 20 mL of 2 mol/L nitric acid solution. The solution was then stirred for 30 min, during which time a homogeneous mixture was formed. Following this, 40 mL of 2 mol/L NaOH was added dropwise, and the mixture was stirred for a further 30 min. Finally, the solution was transferred to a Teflon-lined autoclave and reacted at 160 ℃ for 12 h. After the reaction was complete and the mixture was cooled to room temperature, it was washed three times with anhydrous ethanol and deionized water. CoFe2O4 was obtained after drying in a vacuum oven at 60 ℃.
CoFe2O4/BiOBr was prepared using a microwave-assisted co-precipitation method (Fig. 1). 3 mmol of Bi(NO3)3·5H2O were dissolved in 45 mL of ethylene glycol, while 3 mmol of KBr were dissolved in 15 mL of ethylene glycol. A certain amount of CoFe2O4 was added to the Bi(NO3)3·5H2O solution and sonicated for 30 min, followed by mechanical stirring for 30 min. The KBr solution was then added dropwise to the mixture, and stirred for another 30 min. Finally, the pH of the solution was adjusted to 5 using 1 mol/L NaOH, the mixture was stirred for 1 h and then reacted under microwave assistance at room temperature and atmospheric pressure (Fig. S1 in Supporting information). The mixture was reacted at 80 ℃ for 40 min, then washed with anhydrous ethanol and deionized water for three times, followed by drying in a vacuum oven at 60 ℃.
The catalyst was characterized by X-ray diffraction (XRD), scanning electron microscopy (SEM), Fourier-transform infrared spectroscopy (FTIR), Brunauer-Emmett-Teller (BET), X-ray photoelectron spectroscopy (XPS) and vibrating sample magnetometry (VSM), and its crystal structure, morphology, microstructure, elemental composition and chemical state, specific surface area, surface functional groups and magnetic properties were analyzed. The test of photoelectric chemical properties mainly relies on electrochemical workstations and ultraviolet-visible spectrometer (UV–vis) equipment. In addition, EPR test technology was used to detect the main active substances, and high-performance liquid chromatography (HPLC) and high-performance liquid chromatography-quadrupole time-of-flight mass spectrometry (HPLC-QTOF-MS) technology were employed to detect the DUR concentration and its intermediate products in the degradation process (details in Text S2 in Supporting information).
The photocatalytic degradation experiment was performed using a 300 W xenon lamp as a simulated visible light source, with a wavelength range of 400 nm ≤ λ ≤ 780 nm, and an intensity of 196 mW/cm2 (Fig. S2 in Supporting information). 100 mL of 10 mg/L DUR was placed in the reaction dish. Following this, 0.1 g of the photocatalytic material was added and placed in the photocatalytic reaction chamber for 30 min of dark reaction. After adsorption equilibrium was reached at the end of the dark reaction, the light source was switched on and samples were taken at intervals. The samples were filtered through a 0.22 µm filter and stored in 2 mL sample vials for subsequent detection of the remaining concentration of DUR by HPLC. In addition, the apparent quantum yield (AQY) of photocatalytic degradation reaction was determined and calculated at a fixed wavelength (420 nm), with details in Text S3 (Supporting information).
The capture experiments followed the same steps as the photocatalytic degradation experiments. TBA, p-BQ, FFA, and EDTA-2Na were used as scavengers for •OH, •O2–, 1O2 and h+ in amounts of the scavengers were 0.5, 1, 5 and 10 mmol respectively. The cyclic experiments used the same photocatalyst and were repeated six times, following the same steps as the photocatalytic degradation experiments. All experiments were conducted in triplicate to ensure the reliability of the data.
The Fukui index and electrostatic potential distribution were calculated by DFT to analyze the degradation path of diuron molecules. Firstly, the DUR molecular model was established, and the CASTEP module was used to optimize the model structure. The DMol3 module was used to calculate the electrostatic potential distribution and Fukui index of DUR molecules. The electrostatic potential distribution and Fukui index were used to predict the sites where DUR molecules were vulnerable to reactive oxygen species (ROS) attack, so as to analyze the degradation path of DUR. To further analyze the degradation mechanism, the work functions of CoFe2O4 and BiOBr were analyzed by DFT calculations. The surface model was constructed by selecting the crystal plane, and the generalized gradient approximation functional (GGA-PBE) was selected for structural optimization and static calculations to determine the Fermi level and vacuum level, and calculate the work function.
As shown in Fig. 2a, CoFe2O4 exhibits agglomerated spherical structures with diameters within several tens of nanometers. Pure BiOBr displays a typical layered structure (Fig. 2b). After loading CoFe2O4 onto BiOBr, it can be observed that BiOBr transforms from a layered structure to a compact, irregular flower-like structure [40]. Additionally, it was observed that the spherical CoFe2O4 was tightly adhered to the surface of BiOBr (Fig. 2c). Fig. 2d shows the individual atomic percentages. The energy dispersive X-ray spectroscopy (EDS) elemental distribution maps (Figs. 2e-k) reveal the presence of elements such as Bi, O, Br, Co, and Fe in the sample, which are evenly distributed on the surface of the CoFe2O4/BiOBr composite photocatalyst. This further confirms the successful synthesis of the CoFe2O4/BiOBr composite catalyst. The (012) and (110) crystal planes of BiOBr (PDF #73–2061) can be observed in the high-resolution transmission electron microscopy (HRTEM) diagram of the catalyst (Figs. 2l and m), and the d spacing is about 0.282 and 0.276 nm, respectively. At the same time, the (220) crystal plane of CoFe2O4 is also observed, and the crystal plane spacing is about 0.293 nm. The crystal plane spacing measurement is shown in Fig. S3 (Supporting information). The (011), (012), (112), (020) and (212) planes of BiOBr can also be clearly observed from the selected area electron diffraction (SAED) diagram (Fig 2n), which is consistent with the XRD crystal plane, further verifying the successful synthesis of the composite material.

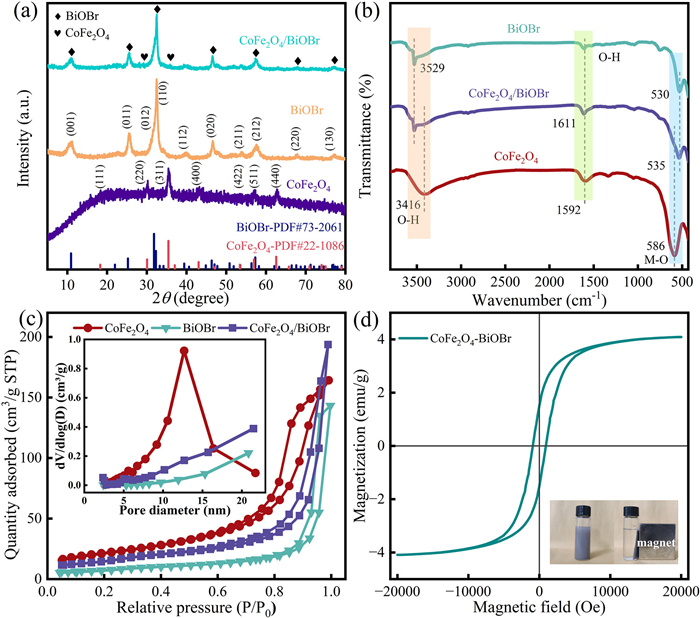
The crystal structures of BiOBr, CoFe2O4 and CoFe2O4/BiOBr were characterized using XRD. From the Fig. 3a, the characteristic peaks of CoFe2O4 at 18.3°, 30.1°, 35.4°, 43.1°, 53.4°, 57.0°, and 62.6° correspond to the crystal planes (111), (220), (311), (400), (422), (511), and (440) of the CoFe2O4 standard PDF card (PDF #22–1086). The characteristic peaks of pure BiOBr and CoFe2O4/BiOBr at 10.9°, 25.3°, 31.8°, 32.3°, 39.4°, 46.3°, 53.5°, 57.3°, 67.6°, and 77.0° correspond to the crystal planes (001), (011), (012), (110), (112), (020), (211), (212), (220), and (130) of the BiOBr standard PDF card (PDF #73–2061). However, in CoFe2O4/BiOBr, only two very weak characteristic peaks of CoFe2O4 are observed, corresponding to (220) and (311). This is attributed to the low addition amount of CoFe2O4 (mass ratio of CoFe2O4 to BiOBr is 0.10), resulting in the insignificance of its characteristic peaks. The FTIR characterization results of CoFe2O4, BiOBr and CoFe2O4/BiOBr are shown in Fig. 3b. The absorption peaks of BiOBr at 3529 cm-1 and 1611 cm-1 can be classified as O—H stretching vibration and deformation vibration [41]. The absorption peak of CoFe2O4 near the peak at 3416 cm-1 is also related to the O—H stretching vibration of water molecules on the sample surface. The characteristic absorption peak observed at 500–600 cm-1 is attributed to the stretching vibration of M-O (where M stands for metal Bi, Fe, or Co) [42,43]. The characteristic peaks of both CoFe2O4 and BiOBr are retained in the CoFe2O4/BiOBr composite, which confirms the successful preparation of CoFe2O4/BiOBr composite. N2 adsorption-desorption experiments were conducted to analyze the pore size and surface characteristics of the catalysts. As shown in Fig. 3c, CoFe2O4, BiOBr, and CoFe2O4/BiOBr all exhibit type Ⅳ isothermal adsorption curves with H3-type hysteresis loops (classified according to IUPAC), which is one of the characteristics of mesoporous materials [44]. The pore sizes of CoFe2O4, BiOBr and CoFe2O4/BiOBr are 11.89, 11.35, and 11.79 nm, respectively, with most pores clustered between 2–20 nm. This further confirms that the catalysts are mesoporous materials (as illustrated). Using the BET model, the specific surface areas of CoFe2O4, BiOBr, and CoFe2O4/BiOBr were calculated to be 78.09, 26.58, and 52.33 m2/g, respectively (Table S1 in Supporting information). The composite of CoFe2O4 and BiOBr nearly doubles the specific surface area of the catalyst compared to BiOBr alone. This enhancement resulted in a notable rise in the number of active sites on the catalyst surface, thereby markedly improving the catalytic performance of the material. The magnetic properties of the composite facilitate the effective recovery of the catalyst from the solution after reactions. To evaluate the magnetic characteristics, the CoFe2O4/BiOBr was tested using a vibrating sample magnetometer (VSM) at room temperature. Based on the M-H hysteresis loop, the catalyst exhibited soft magnetic properties, with a saturation magnetization value of 4.09 emu/g (Fig. 3d). Due to the low content of CoFe2O4 in the composite material, its saturation magnetization intensity is relatively low. Nevertheless, the applied magnetic field is still sufficient to effectively separate the material from the reaction solution (as illustrated in the inset of Fig. 3d).
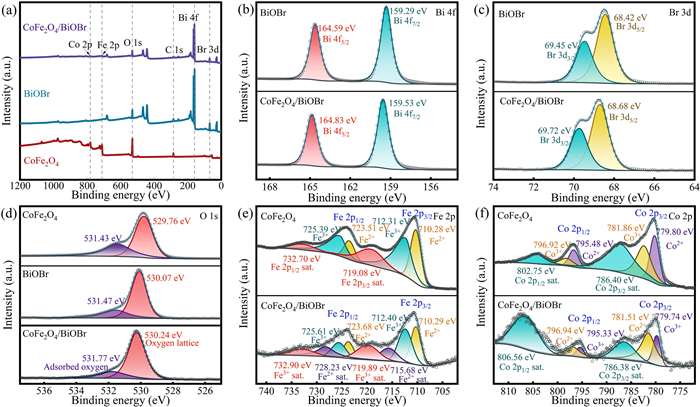
The surface crystal structure of each chemical component in the catalyst was analyzed by XPS characterization technique (Fig. 4). In the XPS full spectrum of CoFe2O4/BiOBr, the presence of Bi, O, Br, Fe and Co elements can be clearly observed (Fig. 4a), which confirms the successful synthesis of the composite catalyst. As shown in Fig. 4b, two prominent characteristic peaks of Bi 4f appear at 164.83 and 159.53 eV, which are attributed to the orbital electronic transitions of Bi 4f5/2 and Bi 4f7/2, respectively [45]. In Fig. 4c, the binding energy peaks located at 69.72 and 68.68 eV can be observed, which are caused by the spin-orbit splitting of the Br 3d orbital, corresponding to the energy levels of Br 3d3/2 and Br 3d5/2, respectively [46]. In addition, the binding energy peaks of O 1s spectrum at 531.77 and 530.24 eV in Fig. 4d indicate the presence of surface adsorbed oxygen and the formation of Bi-O bonds in BiOBr, and the surface adsorbed oxygen may be related to water molecules or hydroxyl groups on the surface of BiOBr [45,47]. After the introduction of CoFe2O4, it can be observed that the peaks of Bi 4f, O 1s and Br 3d in BiOBr are all shifted to the high binding energy position, which indicates the existence of electron transfer and close interaction between BiOBr and CoFe2O4 [39]. Fig. 4e displays the XPS spectrum of Fe 2p, in which the peaks of Fe 2p1/2 appear at 725.61 and 723.68 eV, while the peaks of Fe 2p3/2 are located at 712.40 and 710.29 eV. The peaks at 725.61 and 712.40 eV are attributed to Fe3+ (ferric iron), while the peaks at 723.68 and 710.29 eV are attributed to Fe2+ (ferrous iron). In addition, the satellite peaks corresponding to Fe3+ and Fe2+ are observed at 732.90, 719.89, 728.23, and 715.68 eV, respectively [48]. Fig. 4f displays the XPS spectrum of Co 2p The peaks of Co 2p1/2 are observed at 796.94 and 795.33 eV, while the peaks of Co 2p3/2 are located at 781.51 and 779.74 eV. Moreover, two satellite peaks are also observed at 806.56 and 786.38 eV. The binding energy peaks at 796.94 and 781.51 eV confirm the presence of Co2+, while the peaks at 795.33 and 779.74 eV confirm the existence of Co3+ [49]. These results further confirm the successful synthesis of the composite photocatalyst.
To investigate the photocatalytic performance of the CoFe2O4/BiOBr composite, the removal of DUR in different systems was compared, as shown in Fig. 5a. The term "Vis" indicates the presence of visible light irradiation. The CoFe2O4 and BiOBr catalysts were physically mixed in a specific mass ratio and labeled as "CoFe2O4 + BiOBr". Under visible light irradiation, the catalyst-free system showed the lowest DUR removal rate of only 2.94% after 50 min, which indicates that DUR was stable and not prone to photodegradation under light irradiation. In the CoFe2O4/BiOBr system, the DUR removal rate after 50 min was only 7.82%, indicating that adsorption capacity of CoFe2O4/BiOBr was weak and that it had little effect on the removal of DUR. The DUR removal rates for the BiOBr, BiOBr/CoFe2O4, and "BiOBr + CoFe2O4″ systems under visible light irradiation for 50 min were 99.9%, 99.9%, and 98.44%, respectively. The rate constants (k) for these systems were 7.39 × 10⁻², 8.11 × 10⁻² and 6.71 × 10⁻² min-1, respectively (Fig. 5b). The results demonstrate that BiOBr plays a primary role in the system, while the physical mixing of "BiOBr + CoFe2O4" reduces the degradation reaction rate of DUR. It is of significant importance to note that the CoFe2O4 endows the CoFe2O4/BiOBr composite photocatalyst with magnetic properties while simultaneously enhancing the photocatalytic performance of BiOBr.
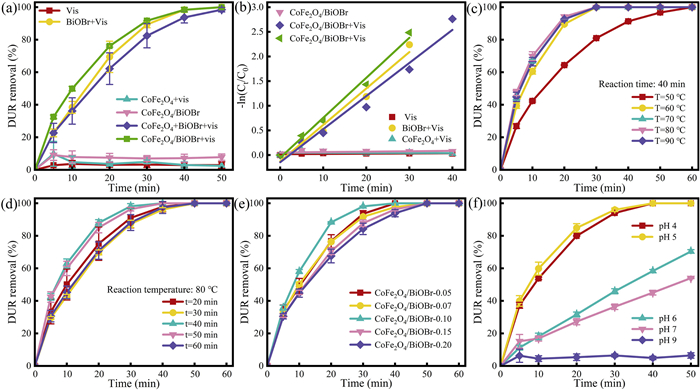
Synthesis conditions are crucial for the structure and performance of the catalyst. The impact of different synthesis conditions on the photocatalytic performance of the catalyst were investigated under visible light irradiation. Since the adsorption of CoFe2O4/BiOBr on DUR under dark within 60 min was very small (Fig. S4 in Supporting information), it was almost negligible. Therefore, the subsequent photocatalytic experiments were performed for only 10 min under dark. Firstly, the effect of synthesis temperature (Fig. 5c) on DUR removal efficiency was studied. As the synthesis temperature increased from 50 ℃ to 80 ℃, the degradation reaction rate constant of DUR improved from 6.57 × 10⁻² min-1 to 14.16 × 10⁻² min-1 (Fig. S5a in Supporting information). However, it is worth noting that when the temperature was further increased to 90 ℃, the reaction rate constant showed a decreasing trend. This is because excessive synthesis temperature can lead to catalyst agglomeration [50], while appropriate microwave reaction time is helpful for the optimized synthesis of the catalyst. When the synthesis time was 40 min (Fig. 5d), the photocatalytic reaction rate for DUR removal reached its maximum at 13.03 × 10⁻² min-1 (Fig. S5b in Supporting information). Both shorter and longer synthesis times hinder crystal growth of the catalyst, resulting in a decreased reaction rate [51]. Additionally, the effect of CoFe2O4 loading ratio (Fig. 5e) was investigated. As the loading ratio of CoFe2O4 increased, the removal rate of DUR by CoFe2O4/BiOBr initially increased and then decreased. The highest removal efficiency for DUR was achieved at a mass ratio of 0.10, with a removal rate reaching 99.9% within 40 min, and the reaction rate constant (k) is 13.18 × 10⁻² min-1 (Fig. S5c in Supporting information). It is evident that the excessive addition of CoFe2O4 significantly reduced the photocatalytic degradation performance of CoFe2O4/BiOBr. The impact of different pH synthesis conditions on the photocatalytic degradation of DUR by CoFe2O4/BiOBr was investigated (Fig. 5f). The optimal photocatalytic performance was observed at a pH of 5, and the rate constant (k) is 10.52 × 10⁻² min-1 (Fig. S5d in Supporting information). With the increase of pH value, the catalyst performance shows a trend of increasing first and then decreasing, because the increase of pH value will lead to the decrease of the crystallinity of the catalyst [52], which will have an adverse effect on the material performance. Consequently, the optimal conditions for preparing the catalyst were identified as a synthesis temperature of 80 ℃, a synthesis time of 40 min, a mass ratio of magnetic material at 0.10, and a solution pH of 5.
Fig. 6a examines the effect of CoFe2O4/BiOBr dosage on DUR removal efficiency. As the catalyst dosage increased from 0.4 g/L to 1.2 g/L, the removal rate and the reaction rate of DUR gradually improved. This is because the increased catalyst dosage enhances the number of reactive sites, which in turn increased the concentration of active species in the reaction system, thus promoting the removal of DUR [53]. However, this does not imply that a higher catalyst dosage is necessarily superior. When the catalyst dosage was increased to 1.2 g/L, the DUR removal rate and the reaction rate did not increase (Fig. 6b). This was due to the fact that an excess of catalyst particles in the system would result in a turbid solution, which would in turn affect the light transmittance and reduce the light utilization rate [54]. Secondly, excessive addition of catalyst tends to agglomerate and reduce the exposed surface area, leading to the reduction of reactive sites [53]. Therefore, 1.0 g/L was selected as the optimal dosage. Figs. 6c and d examines the effect of the initial concentration of DUR on its removal efficiency and reaction rate. Given that the solubility of DUR in water at 25 ℃ is 42 mg/L [55], five different concentrations within the range of 0–40 mg/L were selected for the experiments. The experimental results indicate that the removal rate of CoFe2O4/BiOBr composite photocatalysts for different concentrations of DUR was almost 99.9%, indicating that the CoFe2O4/BiOBr composite photocatalysts have excellent photocatalytic performance. Changes in pH can affect the surface charge state of the photocatalyst as well as the ionic state of DUR. The influence of the initial pH value on DUR removal efficiency was investigated (Figs. 6e and f). When the initial pH value ranged from 3 to 9, there was no significant effect on the removal rate of DUR, indicating the catalyst had a wide pH applicability. The reaction rate of the catalyst in a strong acidic environment was faster (Fig. S6 in Supporting information). However, the degradation of DUR was minimal at an initial pH of 11, indicating that its removal was suppressed in alkaline conditions. The zeta potential test results indicated the catalyst carried a negative charge within the pH range of 3–11 (Fig. S7 in Supporting information). DUR molecules exist in a cationic form at pH < 6 and in a predominantly neutral form at pH > 6 [56]. At pH values below 6, the electrostatic attraction between the catalyst and DUR facilitates the removal of DUR. As the pH increases, the surface of DUR molecules gradually becomes neutral, weakening the electrostatic attraction. This explains why the degradation rate of DUR is faster under acidic conditions. Additionally, the system itself has a certain buffering capacity; when the initial pH is < 9, the final pH of the system can be maintained below 5. However, under strongly alkaline conditions (pH 11), the buffering capacity of the system is exceeded, resulting in suboptimal catalytic performance.
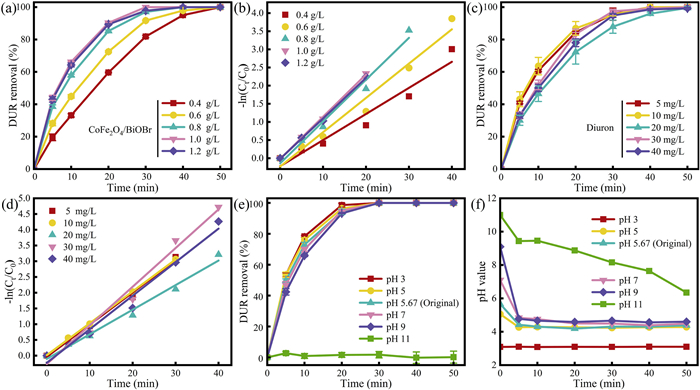
Fig. 7a shows the effect of different concentrations of CO32– ions on the removal rate of DUR by CoFe2O4/BiOBr. The experimental results indicate that CO32– ions have a certain inhibitory effect on DUR removal. When the CO32– concentration reached 0.5 mmol with a solution pH of 10.29, the removal rate of DUR was only 49.7% after 50 min. When the CO32– concentration reached 1–10.0 mmol, there was almost no degradation of DUR. This is mainly attributable to the hydrolysis of CO32– leading to an increase in solution pH and a consequent decrease in photocatalytic efficiency. Additionally, CO32– and HCO3– are regarded as h+ scavengers, and the presence of CO32– and HCO3– will consume h+, resulting in poor photocatalytic activity [57]. The monitoring of pH value in the reaction process also verified the significant influence of CO32– concentration on pH value (Fig. S8a in Supporting information). The increase of CO32– concentration will destroy the buffering capacity of the system, leading to the change of active substance and its concentration during reaction.
|
|
(1) |
|
|
(2) |
|
|
(3) |
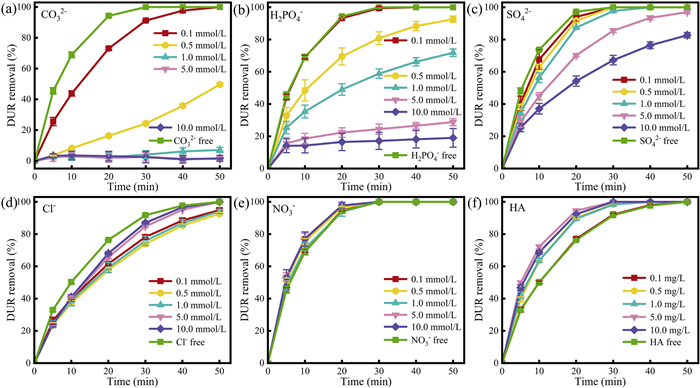
Fig. 7b shows the effect of different concentrations of H2PO4– ions on the DUR removal rate. The experimental results indicate that H2PO4– ions exert an inhibitory effect on the photocatalytic degradation of DUR by CoFe2O4/BiOBr, the pH value increases slightly (Fig. S8b in Supporting information), and the inhibitory effect was gradually enhanced with the increase of H2PO4–. This is due to the high reactivity of H2PO4–, which can react with h+ and •OH [58], leading to the scavenging of active species in the system.
|
|
(4) |
|
|
(5) |
Fig. 7c shows the effect of different concentrations of SO42– ions on the DUR removal rate. The experimental results indicate that SO42– ions have a certain inhibitory effect on the photocatalytic degradation of DUR by CoFe2O4/BiOBr, although the suppression is not significant. At SO42– concentrations of 5 mmol or lower, there was no significant difference in the final removal rate of DUR. However, at a concentration of 10 mmol, the removal rate dropped to 82.7%. This is because SO42– can react with hydroxyl radicals(•OH) and holes (h+) in the system to generate sulfate radicals [59,60]. Under conditions where sulfate radicals are present, they may inhibit the degradation of pollutants. As the concentration of SO42– increases, the pH of the system also rises (Fig. S8c in Supporting information), which can affect the removal rate of DUR to some extent.
|
|
(6) |
|
|
(7) |
Fig. 7d shows the effect of different concentrations of Cl– ions on the DUR removal rate. As shown in Fig. 7d, Cl– ions have a slight inhibitory effect on the removal of DUR. When the Cl– concentration was 0.1–1 mmol, the inhibitory effect on DUR was more obvious. However, when the Cl– concentration was greater than 0.1 mmol, the degradation rate increased with the increase of concentration instead. The inhibition degree of chloride ion decreased with the increase of its concentration, and similar phenomenon was also observed in other literatures [61]. Cl– can react with •OH to form ClOH•-, which then rapidly decomposes into •OH and Cl–. At this point, the reaction rates of both species are comparable, resulting in a minimal impact on pollutant degradation [62]. However, under acidic conditions, ClOH•– can further react with hydrogen ions to produce Cl•, and the presence of chloride ions can have a certain inhibitory effect on pollutant degradation [63]. Monitoring the changes in pH in the system revealed that the low concentration Cl– system exhibits a more acidic pH (Fig. S8d in Supporting information). This results in a greater inhibitory effect of low concentration Cl– compared to high concentration Cl– on the system.
|
|
(8) |
|
|
(9) |
|
|
(10) |
Fig. 7e shows the effect of different concentrations of NO3– ions on the DUR removal rate. The experimental results indicate that NO3– ions have no negative impact on DUR removal. In addition, by monitoring the pH value of DUR solution at different concentrations, it was found that with the increase of NO3– concentration, the pH value changed slightly and remained basically stable (Fig. S8e in Supporting information). In fact, as the NO3– concentration increases, the degradation efficiency of DUR is enhanced. This is because nitrates possess a certain level of photosensitivity, which, under light irradiation, leads to the activation of hydroxyl radicals and nitrogen-containing radicals [64,65]. This increases the concentration of free radicals in the system, thereby accelerating the removal of DUR.
|
|
(11) |
|
|
(12) |
Fig. 7f displays the effect of humic acid (HA) concentration variation on DUR removal efficiency. As shown in Fig. 7f, when the humic acid concentration is in the range of 0–10.0 mg/L, the pH value does not change significantly (Fig. S8f in Supporting information). With the increase of HA concentration, the degradation rate of DUR shows a certain enhancement trend, and this promoting effect becomes more and more significant with the increase of HA concentration. This is because humic substances are considered to be photosensitizers, which can enhance the photodegradation of pollutants at the level of mg/L [66]. Therefore, in this study, humic acid can promote the photodegradation process of DUR as a photosensitizer.
The above research shows that different anions and HA have different effects on the performance of CoFe2O4/BiOBr photocatalytic degradation of DUR. Among them, the order of inhibition intensity is CO32– > H2PO4– > SO42– > Cl–, while NO3⁻ and HA significantly improve the degradation efficiency through photosensitization effect. It is worth noting that under the condition of low concentration coexisting substances, the photocatalytic performance of CoFe2O4/BiOBr was not significantly disturbed, and the degradation rate was still maintained above 80%. This phenomenon confirms that the composite photocatalyst has excellent anti-interference ability and system stability.
In practical applications, the stability and reusability of composite photocatalysts are two crucial factors that must be taken into account. Consequently, a series of cycling experiments were conducted to test the CoFe2O4/BiOBr composite photocatalyst, and the results are shown in Fig. 8. After six consecutive uses, the CoFe2O4/BiOBr composite photocatalyst still maintains excellent photocatalytic performance, with a degradation efficiency of DUR exceeding 99% (Fig. 8a). K. Das et al. successfully synthesized In2S3/Bi2Fe4O9 composite photocatalyst, after 120 min of reaction, the removal efficiency of DUR reached 75% [67]. D. Akgün et al. synthesized Ag/AgCl@MIL-88A/g-C3N4 composite photocatalytic material, under the optimal synthesis conditions, after 60 min of reaction, the removal rate of DUR was as high as 99%. After 3 cycles of use, the removal rate of DUR remained at 96.25% after 120 min of reaction [68–70]. In contrast, the CoFe2O4/BiOBr composite photocatalyst synthesized in this work can remove > 99% of DUR in 50 min. More notably, after 6 cycles of use, the removal rate of DUR was still able to maintain at 99% after 50 min of reaction. Compared with other studies [67–71], the CoFe2O4/BiOBr catalysts in this study shows excellent photocatalytic performance, especially in terms of stability, which further highlights the superiority of CoFe2O4/BiOBr (Table S2 in Supporting information). As shown in Fig. 8b, the leaching amounts of Co, Fe, and Bi ions are all below 20 µg/L, which is far lower than the emission limits specified in the standards (GB3838–2002 and GB25467–2010, China). This indicates that the CoFe2O4/BiOBr photocatalyst exhibits good environmental safety in practical applications. In addition, we analyzed the changes of crystal structure and functional groups of the catalyst before and after use by XRD and FTIR (Figs. 8c and d). The results demonstrated that the characteristic peaks of the catalyst remained unchanged before and after use, proving that the CoFe2O4/BiOBr catalysts exhibits excellent stability. In summary, the CoFe2O4/BiOBr composite photocatalysts can still maintain high photocatalytic activity and good stability after multiple recycling, thereby indicating their potential for practical application in environmental remediation.

The photocatalytic degradation performance of the catalyst in different water bodies was investigated. When the reaction time was 80 min, the removal rates of DUR in lake water, tap water and deionized water were 90.6%, 84.1% and 99.9%, respectively (Fig. 8e). In the actual water environment, the significant decline in pollutant removal efficiency may be due to the quenching effect of various anions on active free radicals, which suppresses the degradation process of pollutants [72]. And the anion concentration in tap water and lake water is much higher than that in deionized water, as indicated by different water quality parameters (Table S3 in Supporting information). In addition, antibiotics, dyes, and phenolic pollutants were selected to evaluate universality of the CoFe2O4/BiOBr photocatalytic system (Fig. 8f). The removal rates of sulfamethazine (SMR), norfloxacin (NOR), methylene blue (MB), rhodamine B (RhB), bisphenol A (BPA) and p-nitrophenol (PNP) by the CoFe2O4/BiOBr photocatalysts were 92.41%, 99.99%, 99.99%, 99.99%, 90.43%, and 15.92%, respectively. The low removal rate of PNP may be due to its inherent photo stability, in which the nitro group, as a strong electron-withdrawing group, hinders the effective attack of electrophilic active species on the benzene ring, leading to the obstruction of photocatalytic degradation [73]. The photocatalyst can adapt to most pollutants, thereby exhibiting the capacity to treat a wide range of environmental pollutants.
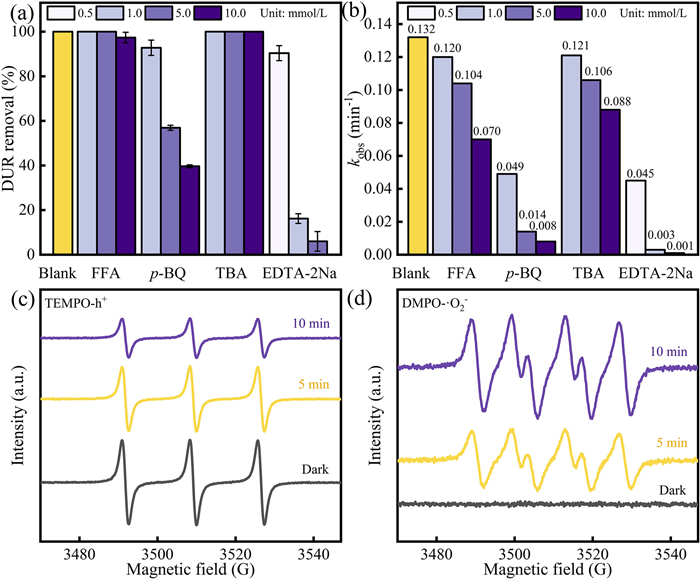
To qualitatively analyze the main active species during the photocatalytic reaction of CoFe2O4/BiOBr catalyst, TBA, EDTA-2Na, p-BQ and FFA were used as scavengers for •OH, h+, •O2–, and 1O2, respectively. As shown in Fig. 9a, the removal rate of DUR gradually decreased from 99.99% to 6.03% when varying concentrations of EDTA-2Na was added, suggesting that h+ played a dominant role in the degradation process of DUR. Secondly, the presence of p-BQ significantly influenced the removal rate of DUR. As the concentration of p-BQ increased, the removal rate of DUR decreased from 99.99% to 39.7%, suggesting that •O2– plays a crucial role in the degradation process of DUR. Although TBA and FFA have little effect on the final removal rate of DUR, the degradation rate of DUR gradually decreases with the increase of the concentration of these two scavengers (Fig. 9b). In summary, all scavengers demonstrated inhibitory effect on the degradation of DUR, with h+ and •O2– identified as the most critical active substances in the system. The active species in the system were further validated through EPR testing. The generation of h+ and •O2– in the system was detected using TEMPO and DMPO as probes under dark conditions or after 5 and 10 min of light exposure (Figs. 9c and d). Under visible light irradiation, distinct characteristic peaks of the DMPO-•O2– adduct were detected, with the signal intensity increasing over time, indicating the presence of •O2–. The TEMPO-h+ signal was stronger in the dark, but weakened with prolonged light exposure [58], as h+ was gradually produced and reacted with the capture agent. This confirms that h+ was generated in the light-exposed system. The results of EPR test are consistent with the capture experiment. Therefore, the main active species in this photocatalytic system are h+ and •O2–.
The UV–vis DRS spectra of CoFe2O4, BiOBr and CoFe2O4/BiOBr were measured to compare their light absorption range (Fig. 10a). The absorption edge of BiOBr is located at about 430 nm, while CoFe2O4 has high light absorption in the range of 200–700 nm. The addition of CoFe2O4 resulted in a notable increase in the light absorption intensity of CoFe2O4/BiOBr in the 400-800 nm. This was attributed to the presence of free electrons inside the metal, which can capture light of various frequencies [74]. The addition of CoFe2O4 enhanced the visible light response of BiOBr, thereby improving the photocatalytic activity of the catalyst. The band gap (Eg) of semiconductor materials is calculated by using the formula αhν = A (hν - Eg) n/2, where α is the absorption coefficient, h is the Planck constant, ν is the optical frequency, and A is a constant [75]. The band gaps of CoFe2O4 and BiOBr are calculated to be about 1.29 and 2.70 eV, respectively (Fig. 10b).

To evaluate the separation efficiency of photogenerated carriers, the catalyst was tested by photoluminescence spectrum (PL) and electrochemical impedance spectrum (EIS). As shown in Fig. 10c, BiOBr exhibits the strongest fluorescence intensity, while the CoFe2O4/BiOBr composite shows the weakest fluorescence intensity. In general, the fluorescence emission intensity is inversely proportional to the density of recombination centers, that is, the weaker the fluorescence intensity, the higher the separation efficiency of electron-hole pairs [76]. The significant decrease in the PL intensity of the CoFe2O4/BiOBr composite indicates that the addition of CoFe2O4 effectively promotes the separation of photogenerated carriers, thus enabling more carriers to actively participate in the photocatalytic reaction process. In general, the smaller the arc radius in the Nyquist plot, the lower the resistance to charge transfer, which is more conducive to the electron transfer process [77,78]. As shown in Fig. 10d, the arc radius of the CoFe2O4/BiOBr composite material is smaller than that of the single CoFe2O4 and BiOBr materials, which indicates that CoFe2O4/BiOBr performs better in terms of charge transfer ability. In summary, the CoFe2O4/BiOBr composite endows with excellent photocatalytic performance due to its efficient carrier separation efficiency and excellent carrier charge transfer ability.
In addition, the semiconductor type and the flat band potential of the catalyst were determined by Mott-Schottky measurements. As shown in Figs. 10e and f, the slope of the M-S curve is positive, indicating that CoFe2O4 and BiOBr are n-type semiconductors. The flat band potentials (EFB) of CoFe2O4 and BiOBr are −0.56 and −0.39 V (vs. Ag/AgCl electrode), respectively, which are about −0.36 and −0.19 eV compared with the normal hydrogen electrode (NHE). The conversion formula is E(NHE) = E(Ag/AgCl) + 0.197 [79]. When the material is n-type semiconductor, the EFB is close to the conduction band potential (ECB), which is located about 0.1–0.3 eV below the conduction band [80]. Therefore, ECB, CoFe2O4 and ECB, BiOBr can be estimated to be about −0.46 and −0.29 eV, respectively. According to the formula ECB = EVB - Eg, it can be seen that EVB, CoFe2O4 and EVB, BiOBr are about 0.83 and 2.41 eV, respectively.
To determine the work function and Fermi level of CoFe2O4 and BiOBr, we obtained the results shown in Figs. 11a and b through DFT calculations. The calculated work function of CoFe2O4 is about 4.74 eV, while that of BiOBr is about 5.26 eV. However, the calculated vacuum level does not always lie at the same position when calculating the work function of materials. In order to compare the Fermi level of CoFe2O4 and BiOBr, the vacuum level of both materials is 0 eV, and the Fermi level of the two materials is calculated by the formula Ф = Evac - Ef. When Evac = 0 eV, the Ef of CoFe2O4 and BiOBr are −4.74 and −5.26 eV, respectively, which means that the Fermi level of CoFe2O4 is higher than that of BiOBr. Based on the experimental results, the CB of CoFe2O4 and BiOBr are −0.46 and −0.29 eV, respectively, and the corresponding VB are 0.83 and 2.41 eV, respectively (Fig. 11c). The CB potential of BiOBr is higher than that of O2/•O2– (−0.33 eV), so it is difficult to reduce O2 to •O2–; while the VB potential of CoFe2O4 is lower than that of -OH/•OH (2.30 eV), so it is difficult to oxidize -OH to •OH [81,82]. At this time, the mechanism explanation of traditional heterojunction is no longer applicable.
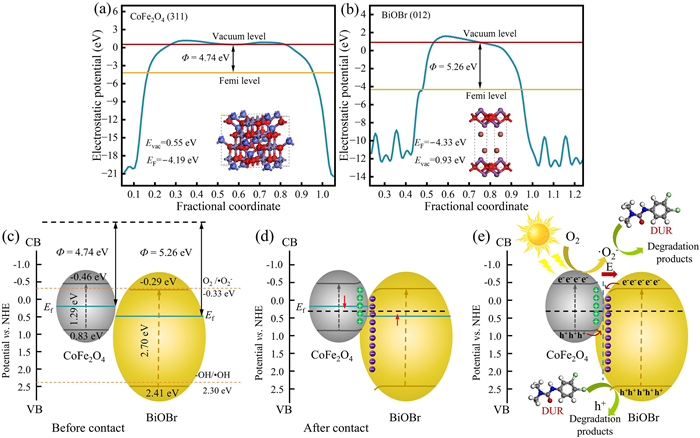
Based on the above analysis, it is proposed that the photocatalytic degradation of DUR by CoFe2O4/BiOBr follows the S-scheme heterojunction transfer mechanism (Figs. 11d and e). When CoFe2O4 and BiOBr come into contact, due to the higher Fermi level, electrons in CoFe2O4 will transfer to BiOBr with a lower Fermi level, resulting in CoFe2O4 losing electrons and becoming positively charged. On the contrary, BiOBr becomes negatively charged due to accepting electrons. In addition, the energy band will be upward or downward bent at the interface of CoFe2O4 and BiOBr, thus forming a built-in electric field pointing from CoFe2O4 to BiOBr. Under light irradiation, the built-in electric field drives the photogenerated electrons to migrate from the conduction band (CB, −0.29 eV) of BiOBr to the valence band (VB, 0.83 eV) of CoFe2O4, which not only enhances the redox ability of the photocatalytic reaction, but also promotes the generation of active substances required for the reaction. The electrons (e–) in CoFe2O4 react with O2 to form superoxide radicals (•O2–), which react with DUR in the system. At the same time, the photogenerated holes (h+) in BiOBr directly participate in the oxidation process of DUR due to their strong oxidizing power. Finally, these active substances degrade DUR into small molecule intermediates or inorganic substances such as H2O and CO2.
|
|
(13) |
|
|
(14) |
|
|
(15) |
|
|
(16) |
|
|
(17) |
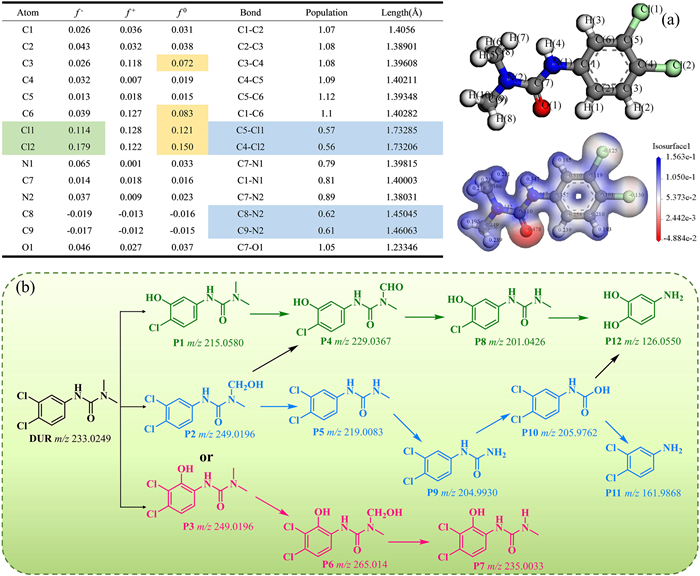
To reveal the specific pathways of DUR degradation in the photocatalytic reaction of CoFe2O4/BiOBr, HPLC-QTOF-MS and density functional theory (DFT) were used to predict and analyze the possible intermediates in the reaction process (Fig. 12). As shown in Fig. S9 (Supporting information), a total of 12 possible DUR degradation intermediates were identified by HPLC-QTOF-MS, and their molecular formulas, m/z values, and molecular structure information are listed in Table S4 (Supporting information). Based on the intermediates and density functional theory (DFT) calculations (Figs. 12a and b), the degradation pathways of DUR mainly involve the following three mechanisms: (1) Substitution of chlorine atoms, (2) dealkylation reaction, (3) hydroxylation of aromatic ring and side chain. Specifically, the chlorine (Cl) atom in the DUR molecule has a higher Fukui function index (f –, f+, f0), making it more susceptible to electrophilic attack and radical attack. In this case, after the chlorine atom is attacked, a dechlorination hydroxylation reaction occurs to generate the intermediate P1. The active substance continues to attack, causing the reaction path to proceed in the order of P1 → P4 → P8 → P12. In addition, the N(2)-C(9) bond has a longer bond length (1.46 Å) and a lower population (0.61), indicating that it is weak and thus more susceptible to breaking. In this case, the degradation of DUR can be achieved by attacking the alkyl side chain, demethylation, and hydroxylation to generate P2 → P5 → P9 → P10 → P11. The f0 values of C6 and C3 atoms are second only to those of chlorine atoms, indicating that they are also vulnerable to free radical attacks. At this time, the hydroxylation reaction occurs on the aromatic ring to produce P3, while the alkyl side chain is attacked, and the reaction proceeds in the order of P3 → P6 → P7. In actual degradation reactions, the degradation process is often complex, and intermediates between different pathways can also be converted to each other. The generated electrostatic potential distribution map also shows that the charge density is mainly concentrated on nitrogen (N), chlorine (Cl), and oxygen (O) atoms. Under the attack of electrophilic groups and free radicals, the obtained intermediates continue to be oxidized and ring opened, and finally inorganic small molecules are generated.
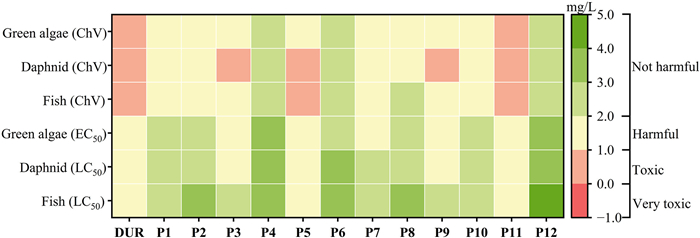
The environmental impacts of DUR and its intermediates were assessed by the quantitative structure-activity relationship (QSAR) method through ECOSAR software (Fig. 13). The predicted toxicity indicators include the median lethal concentration (LC50) of fish and Daphnid, the median effective concentration (EC50) of green algae, and the corresponding chronic toxicity values (ChV) of these indicators. The acute and chronic toxicity of most intermediates to fish, daphnid and green algae were lower than that of DUR. Compared with DUR, the toxicity of intermediates showed a gradually weakening trend (Fig. S10 in Supporting information). These results confirmed that the environmental impact of intermediates is smaller than that of DUR, indicating that their degradation process can effectively alleviate the negative effects of DUR on the ecological environment. It should be noted that the predictions of ECOSAR are based on idealized assumptions and may deviate from the influence of complex matrices or biological metabolic processes in the real environment. Nevertheless, the simulation results can provide a preliminary reference for the potential environmental risks of degradation pathways.
In this work, magnetic CoFe2O4/BiOBr S-scheme heterojunction photocatalysts were successfully prepared by microwave assisted coprecipitation method, which was verified by XRD, SEM, XPS and FTIR. The removal efficiency of diuron by CoFe2O4/BiOBr reached 99.9% in only 50 min under visible light irradiation. Furthermore, the photocatalytic system demonstrated stability across a wide pH range (3–9), making it suitable for different water quality environments and effective in removing various pollutants. After 6 uses, the CoFe2O4/BiOBr still maintains a high removal rate (> 99%) with minimal leaching of Fe and Co ions, confirming the excellent stability and durability of the photocatalysts. The photoelectrochemical test results also revealed that the formation of the CoFe2O4/BiOBr S-scheme heterojunction promotes electron transfer and charge separation, significantly improving the photocatalytic efficiency. The DUR degradation under the photocatalytic reaction was mainly h+ and •O2–. The DUR degradation pathways include dechlorinated hydroxylation, dealkylation and hydroxylation of aromatic ring and side chain, which was identified by HPLC-QTOF-MS and DFT calculations. The toxicity analysis showed that the toxicity of the intermediates generated during the degradation process was generally lower than that of DUR. The addition of CoFe2O4 not only endowed the CoFe2O4/BiOBr composites with magnetism and achieved rapid material recovery, but also formed S-scheme heterojunction and enhanced the photocatalytic performance with good adaptability, exhibiting excellent stability and durability. Given these characteristics, this study is expected to be widely used in industries for the removal of refractory pollutants from water.
The authors declare that they have no known competing financial interests or personal relationships that could have appeared to influence the work reported in this paper.
Guie Li: Writing – original draft, Software, Methodology, Investigation, Conceptualization. Chunyan Yang: Writing – review & editing, Supervision. Qiu Yang: Software, Investigation. Qingzhu Zheng: Writing – review & editing. Menghan Li: Investigation. Jianhua Qu: Writing – review & editing. Guangshan Zhang: Writing – review & editing, Supervision, Funding acquisition.
The work was supported by the National Natural Science Foundation of China (No. 52370174), the Natural Science Foundation of Shandong Province, China (No. ZR2022ME128), and Special Projects in Key Areas of Colleges and Universities in Guangdong Province (No. 2023ZDZX4050).
Supplementary material associated with this article can be found, in the online version, at doi:
FAO, Pesticides use, 2022,
X.D. Wang, C.Y. Zhang, Y. Yuan, et al., J. Agric. Food. Chem. 70 (2022) 14352–14366. doi: 10.1021/acs.jafc.2c05142
G. Asgari, A. Seid-mohammadi, A. Rahmani, et al., Sep. Purif. Technol. 274 (2021) 118962. doi: 10.1016/j.seppur.2021.118962
B.M. Muendo, V.O. Shikuku, J.O. Lalah, et al., Appl. Soil Ecol. 157 (2021) 103721. doi: 10.1016/j.apsoil.2020.103721
L.B. Moreira, G. Diamante, M. Giroux, et al., Environ. Sci. Technol. 52 (2018) 3146–3155. doi: 10.1021/acs.est.7b04970
A.M. Mohammed, V. Karttunen, P. Huuskonen, et al., Toxicol. Lett. 295 (2018) 307–313. doi: 10.1016/j.toxlet.2018.07.012
C.C. Kaonga, K. Takeda, H. Sakugawa, Sci. Total Environ. 518 (2015) 450–458.
Y.G. Gu, Y.P. Gao, F. Chen, et al., Water Res. 224 (2022) 119108. doi: 10.1016/j.watres.2022.119108
J.L.M. Viana, M.D.S. Diniz, S. Santos, et al., Sci. Total Environ. 730 (2020) 139026. doi: 10.1016/j.scitotenv.2020.139026
J. Skerratt, M.E. Baird, M. Mongin, et al., Sci. Total Environ. 879 (2023) 163041. doi: 10.1016/j.scitotenv.2023.163041
H. Chen, Y. Luo, C. Potter, et al., Water Res. 121 (2017) 374–385. doi: 10.1016/j.watres.2017.05.032
L. Pinasseau, L. Wiest, L. Volatier, et al., Talanta 208 (2020) 120307. doi: 10.1016/j.talanta.2019.120307
H. Li, Y. Zhou, W. Tu, et al., Adv. Funct. Mater. 25 (2015) 998–1013. doi: 10.1002/adfm.201401636
J. Gomez-Pastora, S. Dominguez, E. Bringas, et al., Chem. Eng. J. 310 (2017) 407–427. doi: 10.1016/j.cej.2016.04.140
F. Chen, Y. Zhang, H. Huang, Chin. Chem. Lett. 34 (2023) 107523. doi: 10.1016/j.cclet.2022.05.037
R. Su, Y. Zhu, B. Gao, et al., Water Res. 251 (2024) 121119. doi: 10.1016/j.watres.2024.121119
D. Chen, Y. Cheng, N. Zhou, et al., J. Cleaner Prod. 268 (2020) 121725. doi: 10.1016/j.jclepro.2020.121725
M. Sayed, J. Yu, G. Liu, et al., Chem. Rev. 122 (2022) 10484–10537. doi: 10.1021/acs.chemrev.1c00473
I. Ahmad, Y. Zou, J. Yan, et al., Adv. Colloid Interface Sci. 311 (2023) 102830. doi: 10.1016/j.cis.2022.102830
S. Song, Z. Xing, H. Zhao, et al., Green Energy Environ. 8 (2023) 1232–1264. doi: 10.3390/catal13091232
L.L. Zheng, L. Tian, L.S. Zhang, et al., ACS Catal. 14 (2024) 2134–2143. doi: 10.1021/acscatal.3c04820
Y.Q. Wang, Y.P. Luo, S.H. Yu, et al., J. Catal. 429 (2024) 115295. doi: 10.1016/j.jcat.2024.115295
Y. Huang, H. Li, M.S. Balogun, et al., ACS Appl. Mater. Interfaces 6 (2014) 22920–22927. doi: 10.1021/am507641k
M. Shi, G. Li, J. Li, et al., Angew. Chem. Int. Ed. 59 (2020) 6590–6595. doi: 10.1002/anie.201916510
Z.C. Li, C.H. Wen, D.G. Li, et al., Chem. Eng. J. 492 (2024) 152449. doi: 10.1016/j.cej.2024.152449
Y. Xie, Y. Wang, Y. Zhou, et al., Appl. Catal., A 669 (2024) 119504. doi: 10.1016/j.apcata.2023.119504
Y. Shi, H. Shou, H. Li, et al., Angew. Chem. Int. Ed. 62 (2023) e202302286. doi: 10.1002/anie.202302286
X. Zhang, X. Gu, Y. Song, et al., Chem. Eng. J. 495 (2024) 153261. doi: 10.1016/j.cej.2024.153261
H. Li, H. Zhu, Y. Shi, et al., Environ. Sci. Technol. 56 (2022) 1771–1779. doi: 10.1021/acs.est.1c07811
R. Hassandoost, S.R. Pouran, A. Khataee, et al., J. Hazard. Mater. 376 (2019) 200–211. doi: 10.1016/j.jhazmat.2019.05.035
D. Zhang, D. Zhang, S. Wang, et al., J. Colloid Interface Sci. 657 (2024) 672–683. doi: 10.1016/j.jcis.2023.11.159
Y.Q. Xia, H.Y. Liu, F. Sun, et al., J. Cleaner Prod. 434 (2024) 140445. doi: 10.1016/j.jclepro.2023.140445
W. He, L. Liu, T. Ma, et al., Appl. Catal. B 306 (2022) 121107. doi: 10.1016/j.apcatb.2022.121107
S. Dharani, L. Gnanasekaran, S. Arunachalam, et al., Environ. Res. 258 (2024) 119484. doi: 10.1016/j.envres.2024.119484
Y. Ren, L. Lin, J. Ma, et al., Appl. Catal. B 165 (2015) 572–578. doi: 10.1016/j.apcatb.2014.10.051
X. Jiang, D. Fan, X. Yao, et al., J. Colloid Interface Sci. 641 (2023) 26–35. doi: 10.1016/j.jcis.2023.03.055
P. Xu, R. Wei, P. Wang, et al., Water Res. 235 (2023) 119843. doi: 10.1016/j.watres.2023.119843
E. Lin, R. Huang, J. Wu, et al., Nano Energy 89 (2021) 106403. doi: 10.1016/j.nanoen.2021.106403
C. Feng, Z. Lu, Y. Zhang, et al., Chem. Eng. J. 435 (2022) 134833. doi: 10.1016/j.cej.2022.134833
S. Zhang, X. Chen, L. Song, J. Hazard. Mater. 367 (2019) 304–315. doi: 10.1016/j.jhazmat.2018.12.060
H. Wang, D. Yong, S. Chen, et al., J. Am. Chem. Soc. 140 (2018) 5320-5320. doi: 10.1021/jacs.8b03587
Y. Shi, J. Li, D. Huang, et al., ACS Catal. 13 (2023) 445–458. doi: 10.1021/acscatal.2c04228
M. Cao, P. Xu, F. Shi, et al., Chem. Eng. J. 497 (2024) 154388. doi: 10.1016/j.cej.2024.154388
M.A. Al-Ghouti, D.A. Da'ana, J. Hazard. Mater. 393 (2020) 122383. doi: 10.1016/j.jhazmat.2020.122383
X. Li, Y. Hu, F. Dong, et al., Appl. Catal. B 325 (2023) 122341. doi: 10.1016/j.apcatb.2022.122341
J. Sun, X. Li, Q. Zhao, et al., Appl. Catal. B 281 (2021) 119478. doi: 10.1016/j.apcatb.2020.119478
X.M. Chen, Y.Y. Wu, Y. Tang, et al., Chin. Chem. Lett. 35 (2024) 109245. doi: 10.1016/j.cclet.2023.109245
Y. Sun, Y. Li, S. You, et al., Chem. Eng. J. 424 (2021) 130460. doi: 10.1016/j.cej.2021.130460
J. Wang, B. Xiong, L. Miao, et al., Appl. Catal. B 280 (2021) 119422. doi: 10.1016/j.apcatb.2020.119422
S. Li, G. Zhang, H. Zheng, et al., Environ. Sci. Pollut. Res. 24 (2017) 24400–24408. doi: 10.1007/s11356-017-9893-5
D. He, G. Wan, H. Hao, et al., Chem. Eng. J. 289 (2016) 161–169. doi: 10.1016/j.cej.2015.12.103
M. Marks, H.S. Jeppesen, N. Lock, ACS Appl. Mater. Interfaces 14 (2022) 23496–23506. doi: 10.1021/acsami.2c03837
P. Zhang, Y. Shu, Y. Wang, et al., Chem. Eng. J. 443 (2022) 136050. doi: 10.1016/j.cej.2022.136050
X. Zou, B. Sun, L. Wang, et al., Chem. Eng. J. 482 (2024) 148818. doi: 10.1016/j.cej.2024.148818
U.A.R. Service, ARS pesticide properties database on Diuron, 1995,
M.A. Fontecha-Camara, M.V. Lopez-Ramon, M.A. Alvarez-Merino, et al., Langmuir 23 (2007) 1242–1247. doi: 10.1021/la062200f
B. Li, C. Lai, G. Zeng, et al., ACS Appl. Mater. Interfaces 10 (2018) 18824–18836. doi: 10.1021/acsami.8b06128
G. Zhao, J. Ding, F. Zhou, et al., Chem. Eng. J. 405 (2021) 126704. doi: 10.1016/j.cej.2020.126704
F. Ghanbari, M. Moradi, F. Gohari, J. Water Process Eng. 9 (2016) 22–28. doi: 10.1016/j.jwpe.2015.11.011
T.T. Cheng, H.J. Gao, R.S. Li, et al., Appl. Surf. Sci. 566 (2021) 150669. doi: 10.1016/j.apsusc.2021.150669
S. Wang, H. Liu, J. Wang, J. Hazard. Mater. 387 (2020) 121669. doi: 10.1016/j.jhazmat.2019.121669
D. Minakata, D. Kamath, S. Maetzold, Environ. Sci. Technol. 51 (2017) 6918–6926. doi: 10.1021/acs.est.7b00507
Y. Yang, J.J. Pignatello, J. Ma, et al., Environ. Sci. Technol. 48 (2014) 2344–2351. doi: 10.1021/es404118q
X. Gao, X. Zhang, Y. Wang, et al., Chem. Eng. J. 273 (2015) 156–165. doi: 10.1016/j.cej.2015.03.063
J.L. Wang, S.Z. Wang, Chem. Eng. J. 411 (2021) 128392. doi: 10.1016/j.cej.2020.128392
C. Wang, L. Zhu, M. Wei, et al., Water Res. 46 (2012) 845–853. doi: 10.1016/j.watres.2011.11.057
K. Das, R. Bariki, S.K. Pradhan, et al., Chemosphere 306 (2022) 135600. doi: 10.1016/j.chemosphere.2022.135600
D. Akgün, M. Dükkancı, J. Water Process Eng. 51 (2023) 103469. doi: 10.1016/j.jwpe.2022.103469
L. Hao, J. Luan, Int. J. Mol. Sci. 25 (2024) 4418. doi: 10.3390/ijms25084418
M. Antonopoulou, P. Bika, I. Papailias, et al., Sci. Total Environ. 892 (2023) 164218. doi: 10.1016/j.scitotenv.2023.164218
P.L. d. Oliveira, N.S. Lima, A.C.F. d. M. Costa, et al., Ceram. Int. 46 (2020) 9421–9435. doi: 10.1016/j.ceramint.2019.12.203
M. Zhao, Y. Liu, M. Feng, et al., Chem. Eng. J. 489 (2024) 151371. doi: 10.1016/j.cej.2024.151371
D. Ghosh, K.E. Spinlove, H.J.M. Greene, et al., J. Am. Chem. Soc. 146 (2024) 30443–30454. doi: 10.1021/jacs.4c10965
X. Li, Q. Dong, F. Li, et al., Appl. Catal. B 340 (2024) 123238. doi: 10.1016/j.apcatb.2023.123238
C. Yang, Q. Rong, F. Shi, et al., Chin. Chem. Lett. 35 (2024) 109767. doi: 10.1016/j.cclet.2024.109767
J. Sun, Y. Zhang, S. Fan, et al., Appl. Catal. B: Environ. 356 (2024) 124248. doi: 10.1016/j.apcatb.2024.124248
D. Song, M. Li, F. Yang, et al., Chin. Chem. Lett. 35 (2024) 108591. doi: 10.1016/j.cclet.2023.108591
J. Qu, Z. Li, F. Bi, et al., Proc. Natl. Acad. Sci. U. S. A. 120 (2023) e2304552120. doi: 10.1073/pnas.2304552120
X.B. Li, T. Han, Y.T. Zhou, et al., Appl Catal. B: Environ. 350 (2024) 123913. doi: 10.1016/j.apcatb.2024.123913
C. Zeng, Y. Hu, H. Huang, ACS Sustainable Chem. Eng. 5 (2017) 3897–3905. doi: 10.1021/acssuschemeng.6b03066
S.R. Kim, W.K. Jo, J. Hazard. Mater. 380 (2019) 120866. doi: 10.1016/j.jhazmat.2019.120866
T. Senasu, S. Nijpanich, S. Juabrum, et al., Appl. Surf. Sci. 567 (2021) 150850. doi: 10.1016/j.apsusc.2021.150850

Figure 2 SEM images of (a) CoFe2O4, (b) BiOBr, (c) CoFe2O4/BiOBr. (d) EDS and (e-k) mapping, (l) TEM, (m) HRTEM and (n) SAED diagram of CoFe2O4/BiOBr.

Figure 3 (a) XRD patterns of BiOBr, CoFe2O4 and CoFe2O4/BiOBr samples. (b) FTIR spectra. (c) N2 adsorption-desorption curve, pore size distribution curve (illustration). (d) Magnetic hysteresis loop.

Figure 4 (a) XPS surveys, (b) Bi 4f, (c) Br 3d, (d) O 1s, (e) Fe 2p and (f) Co 2p peaks of BiOBr, CoFe2O4 and CoFe2O4/BiOBr.

Figure 5 Under visible light irradiation, the effects of (a) different reaction systems on DUR removal rate and (b) pseudo-first-order kinetics were discussed. The effects of (c) synthesis temperature, (d) synthesis time, (e) CoFe2O4 addition amount and (f) synthesis pH on DUR removal rate were investigated. Operating conditions: DUR = 10 mg/L, catalyst = 1 g/L, room temperature.

Figure 6 Effects of (a, b) CoFe2O4/BiOBr dosage and (c, d) DUR initial concentration on DUR removal and pseudo-first-order kinetics under visible light. (e) The removal of DUR by the initial pH of the solution and (f) the monitoring of pH during the reaction. Operating conditions: DUR = 10 mg/L, catalyst = 1 g/L, room temperature.

Figure 7 Effects of different concentrations of (a) CO32-, (b) H2PO4-, (c) SO42-, (d) Cl-, (e) NO3- and (f) HA on the degradation of DUR under visible light. Operating conditions: DUR = 10 g/L, catalyst = 1 g/L, room temperature.

Figure 8 During the recycling process (a) the removal rate of DUR, (b) ion leaching, (c) XRD before and after use, and (d) FTIR before and after use. (e) Removal of DUR in different water bodies and (f) removal of different pollutants.

Figure 9 (a) Removal efficiency, (b) corresponding pseudo-first-order rate constant, (c) h+ and (d) •O2- EPR spectra in the dark, 5 and 10 min under different scavengers upon visible light irradiation.

Figure 10 (a) UV–vis diffuse reflectance spectra, (b) Tauc plots, (c) photoluminescence spectra, and (d) Nyquist plots of CoFe2O4, BiOBr, and CoFe2O4/BiOBr. (e) Mott-Schottky plots of CoFe2O4 and (f) BiOBr.

Figure 11 The work functions of (a) CoFe2O4 and (b) BiOBr. (c-e) The possible photodegradation mechanism of DUR with CoFe2O4/BiOBr as photocatalyst under visible light.

Figure 12 (a) The bond population, Fukui indices and electrostatic potential distribution of DUR. (b) Possible degradation pathway of DUR in CoFe2O4/BiOBr process.

 扫一扫看文章

扫一扫关注我们
 DownLoad:

 下载:
下载:

 下载:
下载: