Hebei Key Laboratory of Flexible Functional Materials, School of Materials Science and Engineering, Hebei University of Science and Technology, Shijiazhuang 050018, China
b.
Institute of Energy Resources, Hebei Academy of Sciences, Shijiazhuang 050081, China
c.
Department of Materials Science and Engineering & Center of Super-Diamond and Advanced Films (COSDAF), City University of Hong Kong, Hong Kong 999077, China
d.
Hebei Jiaotong Vocational and Technical College, Shijiazhuang 050035, China
e.
School of Marine Science and Engineering, Hainan University, Haikou 570228, China
Received Date:
27 January 2025 Accepted Date:
09 April 2025 Revised Date:
02 April 2025 Available Online:
15 November 2025
Abstract:
Lithium-ion batteries (LIBs) are increasingly required to operate under harsh conditions, particularly at low-temperature condition. Developing novel electrolytes is a facile and effective approach to elevate the electrochemical performances of LIBs at low temperature. Herein, a dual-salt electrolyte consisting of (lithium bis(trifluoromethanesulfonyl)imide (LiTFSI) and lithium difluoro(oxalato)borate (LiODFB)) is proposed to regulate the solvation structure of Li+ ions and improve the reaction kinetics under low temperature. Based on the comprehensive electrochemical tests and theoretical computations, the introduction of LiODFB component not only effectively benefits the formation of cathode electrolyte interface (CEI) layer on the surface of LiFePO4 electrode, but also inhibits the chemical corrosion effect of LiTFSI-containing electrolytes on Al foil. As expected, the optimized LiLiFePO4 cells can display high reversible capacity of 117.0 mAh/g after 100 cycles at -20 ℃. This work provides both theoretical basis and experimental guidance for the rational design of low-temperature resistant electrolytes.
Lithium batteries have been widely applied to portable electronic devices due to their high energy density, long lifespan, high power, and low self-discharge [1-3]. However, lithium batteries exhibit performance weaknesses at low temperatures [4-6]. When operated at low temperatures (e.g., below 0 ℃), lithium batteries will suffer severe polarization and the instability of the CEI, and even lithium dendrites may occur, which can result in safety hazards, and hinder the practical application of low-temperature lithium batteries [7,8]. Recently, various methods including modification of anode and cathode materials (e.g., nanoparticles and carbon coating) [9,10], had been proposed to improve the low-temperature performance of lithium batteries. Compared with material modifications which are usually complicated, developing low temperature electrolytes is a simpler approach and the resulting improvements in low temperature performance are often more evident [11-13]. Therefore, it is urgent to design high-performance low-temperature electrolyte.
The composition and proportion of Li salts, the type of solvent, and the regulation of additive proportions are widely employed to adjust and optimize the low temperatures electrolyte [14-16]. LiTFSI [17,18], a Li salt known for its high ionic conductivity compared to conventional salts, has been extensively used in low-temperature applications to enhance the performance of lithium-ion batteries under cold conditions. However, LiTFSI hinders the formation of the CEI [19]. Wang et al. effectively form a more stable CEI on the cathodes by adding LiPF6 to LiTFSI [20]. Similarly, Zhou et al. facilitated the formation and stability of the CEI by incorporating lithium nitrate (LiNO3) into LiTFSI [21]. Wang and Zhou's studies focus on facilitating formation and stability of the CEI through the addition of mixed salts, the stable CEI is beneficial for the performance at low temperatures. However, it is worth noting that they still cannot effectively address the corrosion issue of Al foil caused by LiTFSI under low-temperature conditions. Therefore, it is urgent and still challenging to design a mixed Li salt electrolyte that not only ensures the formation and stability of the CEI at low temperatures but also prevents corrosion of the Al foil of LiTFSI.
Herein, a low-temperature electrolyte design strategy is proposed which enhance interfacial formation of CEI stability and inhibit the Al foil at low temperature. A new dual-salt electrolyte of 0.8 mol/L LiTFSI and 0.2 mol/L LiODFB in methyl ethyl acetate (EA) and fluoroethylene carbonate (FEC) is designed. LiODFB is not only suitable for a wide temperature range but also preferentially decomposes to form a CEI, preventing the corrosion of Al foil by LiTFSI. By adopting a coordinated and unified approach that combines the advantages of these two Li salts, it can enhance the electrochemical performance of lithium-ion batteries at low temperatures. As a result, the LiFePO4 cathode in the optimized dual-salt electrolyte can deliver high specific capacity of 117.0 mAh/g at -20 ℃, and effectively suppress the corrosion of Al foil.
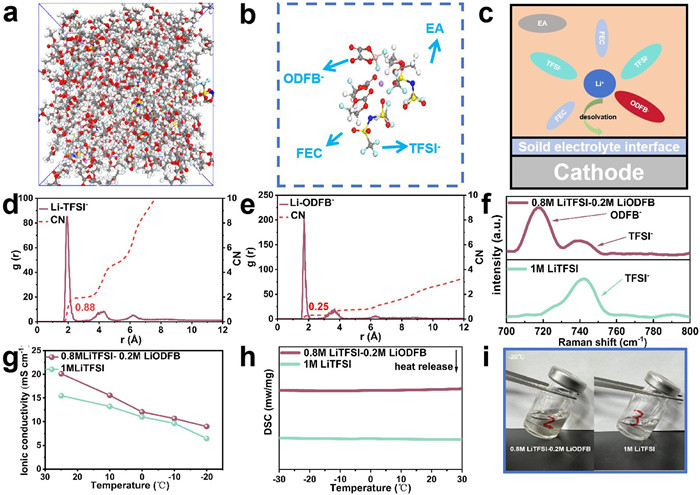
Fig. 1a shows the molecular dynamics (MD) simulation snapshots of the LiTIFSI-LiODFB-based electrolyte, from which the coordination number of Li+ with different groups can be obtained by analyzing the radial distribution function (RDF). Snapshots of Li+ solvation structures can be obtained (Figs. 1b and c). As shown in Figs. 1d and e, the average coordination numbers of in TFSI- and DFOB- with Li+ in the LiTIFSI-LiODFB-based electrolyte are 0.88 and 0.25, respectively, indicating that both anions enter the first solvation shell, which is conducive to the formation of the anion-derived CEI layer [11,22,23]. Due to the larger interaction force of Li-ODFB, Li+ tends to form a solvation shell with ODFB-, indicating that ODFB- can participate in the formation of the interfacial layer of cathode. Due to the abundant coordination sites both Li-EA and Li-FEC, which illustrates that Li-EA and Li-FEC is coordinated with Li+ (Figs. S1a and b in Supporting information). Raman spectroscopy is conducted to investigate the solvation structures of the LiTFSI-LiODFB-based electrolyte and the LiTFSI-based electrolyte, as shown in Fig. 1f, for the LiTFSI-based electrolyte, it shows a strong peak around 740.0 cm-1 corresponding to the TFSI- stretching mode. This peak undergoes a significant change due to the increased coordination between Li+ and the solvent after adding LiDFOB to the LiTFSI-based electrolyte, the ODFB- peak appears around 720 cm-1 [24,25]. The above results significantly confirm that the addition of LiODFB can modulate the first solvation structure, facilitating the de-solvation of lithium ions at the interphase. The conductivities of the three electrolytes at different temperatures are displayed in Fig. 1g and Fig. S2 (Supporting information). The conductivity of the LiTFSI-LiODFB-based electrolyte is higher than that of the LiTFSI-based electrolyte, the addition of LiODFB to the LiTFSI base has improved the conductivity of the electrolyte. The LiTFSI-LiODFB-based electrolyte more than twice that of the LiPF6-based electrolyte at -20 ℃. Using LiTFSI to replace LiPF6, the ionic conductivity of the electrolyte has been significantly improved [26].
Figure 1
Figure 1.
(a, b) Snapshots of Li+ solvation structures obtained from classical molecular dynamics (MD) simulations. (c) Schematic diagram of the desolvation process of Li+ ions in the 0.8 mol/L LiTFSI-0.2 mol/L LiODFB-based electrolyte. (d, e) Radial distribution function (RDF) of Li+ ions in the 0.8 mol/L LiTFSI-0.2 mol/L LiODFB-based electrolyte. (f) Raman spectra of different electrolytes. (g) Ionic conductivity of different electrolytes. (h) DSC curves of different electrolytes. (i) Photographs of different electrolytes at -20 ℃.
The liquid range of different electrolytes is evaluated using differential scanning calorimetry (DSC) (Fig. 1h and Fig. S3 in Supporting information). The LiPF6-based electrolyte exhibits an obvious exothermic peak at 5 ℃, indicating a phase change. In sharp contrast, due to the optimized design of Li salts and solvents, the LiTFSI-LiODFB and LiTFSI-based electrolytes do not undergo a phase change within the temperature range of -30~30 ℃. Their liquid phase range can be more clearly observed from the optical photos in Fig. 1i and Fig. S4 (Supporting information). Compared to the LiPF6-based electrolyte, the other two electrolytes show no obvious freezing at -20 ℃. The above characterizations provide compelling evidence that the designed mixed Li salt electrolyte possesses a wide liquid range, high ionic conductivity, and excellent film-forming properties [16,20]. By synergistically combining the advantages of both Li salts through a coordinated approach, this development is highly significant for the advancement and application of low-temperature electrolytes, the mixed salt has the potential for low-temperature electrochemical performance.
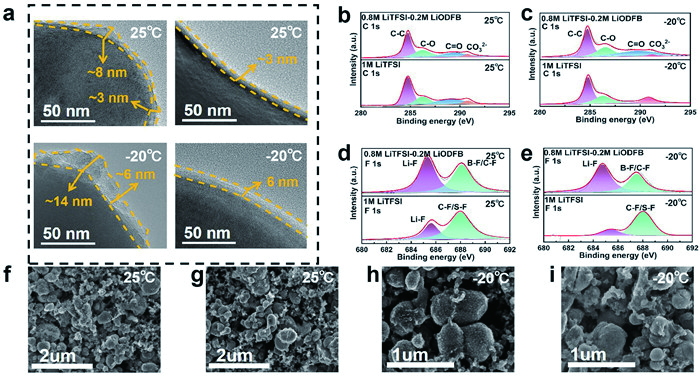
Transmission electron microscopy (TEM) is employed to further access the characteristics of the interfacial films on the cathode surfaces. Fig. 2a and Fig. S5 (Supporting information) directly shows the thickness and uniformity of the CEI on cycled LiFePO4 cathodes at room temperature and low temperature using three electrolytes. It is observed that the LiTFSI, LiPF6, and LiTFSI-LiODFB-based electrolytes are capable of generating CEI film on the LiFePO4 cathode. The thickness of the films exhibits noticeable changes between room temperature and low temperature. The CEI film formed by both the LiPF6 and LiTFSI-based electrolytes are thick and uneven, with a thickness ranging from approximately 3.0-8.0 nm at 25 ℃ and 6.0 nm to 14.0 nm at -20 ℃. In contrast, the CEI film formed by the LiTFSI-LiODFB-based electrolyte is thinner and more uniform, with a thickness of approximately 3.0 nm at 25 ℃ and around 6.0 nm at -20 ℃. The uniformity and thinness of the CEI film facilitate the efficient transmission of Li+ ions [27-29].
Figure 2
Figure 2.
(a) HRTEM images of the LiFePO4 cathode surface after 20 cycles in 0.8 mol/L LiTFSI-0.2 mol/L LiODFB and 1 mol/L LiTFSI-based electrolytes at 25 and -20 ℃. High-resolution C 1s spectra of the LiFePO4 cathode surface after 20 cycles in 0.8 mol/L LiTFSI-0.2 mol/L LiODFB and 1 mol/L LiTFSI-based electrolytes at (b) 25 and (c) -20 ℃. High-resolution F 1s spectra of the LiFePO4 cathode surface after 20 cycles in 0.8 mol/L LiTFSI-0.2 mol/L LiODFB and 1 mol/L LiTFSI-based electrolytes at (d) 25 and (e) -20 ℃. SEM images of the LiFePO4 cathode surface after 20 cycles in 0.8 mol/L LiTFSI-0.2 mol/L LiODFB and 1 mol/L LiTFSI-based electrolytes at (f, g) 25 and (h, i) -20 ℃.
According to the previous reports, the composition of the CEI film significantly impacts battery performance [30-32]. X-ray photoelectron spectroscopy (XPS) at room temperature and low temperature is displayed in Figs. 2b-e and Fig. S6 (Supporting information). Distinctive species such as C-C/C-H (284.7 eV), C-O (286.6 eV), C=O (288.8 eV), and CO32- (290.5 eV) are observed in the C 1s spectra obtained from three electrolytes, which are related to the decomposition of the solvents and salts [33,34]. Notably, the CO32- peak from the LiTFSI-LiODFB-based electrolyte is smaller than those from the LiPF6 and LiTFSI-based electrolyte (Figs. 2b and c, Figs. S6a and c in Supporting information), particularly at low temperatures. This suggests that the surface of both the LiPF6 and LiTFSI-based electrolytes contains more CO32-, which renders the CEI more prone to corrosion from HF generated during solvent decomposition [11]. This is the reason for the thick and uneven formation of the CEI in batteries using the LiPF6 and LiTFSI-based electrolytes. As shown in Figs. 2d and e, Figs. S6b and d (Supporting information), the most significant difference of the three electrolytes is that the LiPF6-based electrolyte contains fewer Li-F species and more unstable species (LixPFyOz), while LiTFSI and LiODFB contributed to the film formation process and formed S-F, C-F and B-F bonds. The thicker CEI film formed at low temperatures is partially related to the reduction of Li-F [35,36]. Li-F is a favored interfacial component due to its excellent electrical insulation properties, which effectively prevent electron tunneling. Additionally, it offers high electrochemical stability, a wide electrochemical window, and a high modulus [9]. The composition of the CEI also plays a crucial role in the electrochemical performance of the Lithium-ion battery at low temperature [37,38].
The LiFePO4 electrodes cycled with different electrolytes are observed using scanning electron microscopy (SEM). Figs. 2f-i and Fig. S7 (Supporting information) presents SEM images of LiFePO4 cathodes after 100 cycles at 0.1 C in LiTFSI-LiODFB-based electrolyte at both 25 ℃ and -20 ℃, the addition of LiODFB inhibits the corrosion of LiTFSI, thereby forming a dense and uniform CEI film, which reduces the formation of cracks on the LiFePO4 electrode surface. In contrast, there are obvious cracks on the LiFePO4 electrode, particularly after low-temperature cycling. The cracks in LiTFSI-based electrolyte are mainly due to its corrosion, which affects the density and uniformity of the CEI film, leading to an increase in the number of cracks on the LiFePO4 electrode surface. While the cracks in the LiPF6-based electrolyte are primarily caused by the decreased solubility of LiPF6 salt at low temperatures, which prevents the formation of a stable CEI film [39]. These findings enhance our understanding of CEI formation and provide valuable insights for developing electrolyte formulations for lithium battery systems.
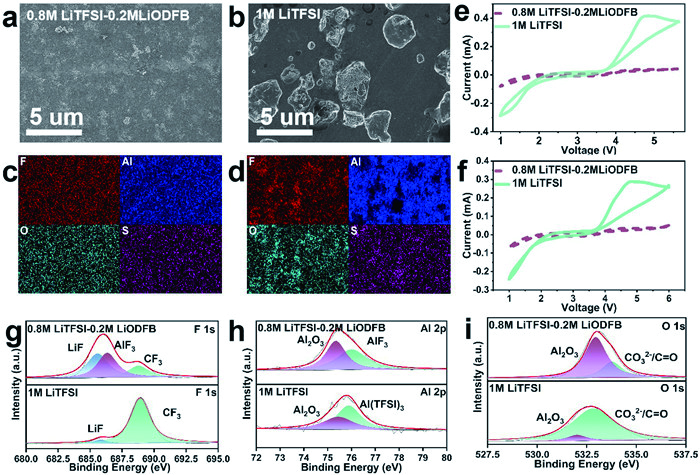
The corrosion of Al foil in the two electrolytes is investigated by the cyclic voltammetry (CV) curves of the Li-Al cells, energy dispersive X-ray spectroscopy (EDX) and SEM (Figs. 3a-f). SEM observations clearly show that the LiTFSI-LiODFB and LiTFSI-based electrolytes remains robust without any appreciable changes after five CV cycles (Figs. 3a and b), whereas the LiTFSI-based electrolyte is severely corroded with apparent scars. The EDX mapping results at selected areas reveal that F, Al, O and S are uniformly distributed on the surface of the Al electrode in the LiTFSI-LiODFB-based electrolyte (Fig. 3c), confirming the formation of a robust LiF and AlF3 passivation layer. In sharp contrast, in the LiTFSI-based electrolyte (Fig. 3d), F, Al, O and S are almost undetectable outside of the pitting holes because the dissolved Al(TFSI)3 fails to decompose and form an effective passivation layer on the Al electrode. Fig. 3e exhibits the first CV curves of Li||Al cells in LiTFSI and LiTFSI-LiODFB-based electrolytes. The bare Al foil exhibits substantial anodic currents with an onset at 3.5 V (indicating the onset of pitting corrosion) and a peak maximum at 4.2 V, implying the formation of Al3+ at the underlying Al substrate [40,41]. A substantial anodic current is characteristic of a less protected Al surface [16]. Further scanning of the potential beyond 4.5 V results in a decline in current, suggesting a retardation of the faradaic process due to the formation of passive AlF3 or Al-O-F compounds. However, this does not indicate a complete inhibition of corrosion. Fig. 3f shows the second CV curves of Li||Al cells in LiTFSI and LiTFSI-LiODFB-based electrolytes. The corrosion current for LiTFSI decreases to a slightly lower value, signifying that corrosion is not completely inhibited. In contrast, the anodic current for LiTFSI-LiODFB-based electrolyte during the second cycle is reduced to a background level, indicating effective corrosion protection [42,43].
Figure 3
Figure 3.
SEM images of Al foil after the CV test in (a) 0.8 mol/L LiTFSI-0.2 mol/L LiODFB and (b) 1 mol/L LiTFSI-based electrolytes. EDS mapping images of selected area on Al foil after the CV test in (c) 0.8 mol/L LiTFSI-0.2 mol/L LiODFB and (d) 1 mol/L LiTFSI-based electrolytes. (e) The first and (f) second CV curves of Li||Al cells in 0.8 mol/L LiTFSI-0.2 mol/L LiODFB and 1 mol/L LiTFSI-based electrolytes. High-resolution (g) F 1s, (h) Al 2p and (i) O 1s spectra of Al foil in Li||Al cells after 5 cycles in 0.8 mol/L LiTFSI-0.2 mol/L LiODFB and 1 mol/L LiTFSI-based electrolytes.
XPS analysis on the surface of the Al after the potentiostatic tests conducted in various electrolytes are performed. As shown in Fig. 3g, the peaks of LiF and AlF3 can be clearly observed at 685.0 and 686.9 eV in the F 1s spectrum. Consequently, the observed reduction in corrosion and enhanced performance can be attributed to the formation of a robust protective layer, rich in AlF3 and LiF. On the contrary, no distinct peaks of LiF and AlF3 are observed in the LiTFSI-based electrolyte. Instead, as shown in Fig. 3h, Al preferentially reacts with TFSI- to form Al(TFSI)3, which can be confirmed by the intensity of the CF3 peak in the F1s spectrum, further supporting this observation. Furthermore, the signals of Al2O3 of the LiTFSI-based electrolyte is far weaker than the LiTFSI-LiODFB-based electrolyte, as shown in Fig. 3i, indicating the attack of LiTFSI toward the oxidation layer on the Al surface. The dissolution of Al(TFSI)3 into electrolytes due to the high solubility in carbonate solvents exposes fresh Al for the further attack from LiTFSI. Through SEM, EDX, and XPS analysis of the Al thin electrode, it is confirmed that ODFB- preferentially decomposes to form a protective layer rich in LiF, AlF3, etc., preventing further corrosion of the Al foil by LiTFSI.
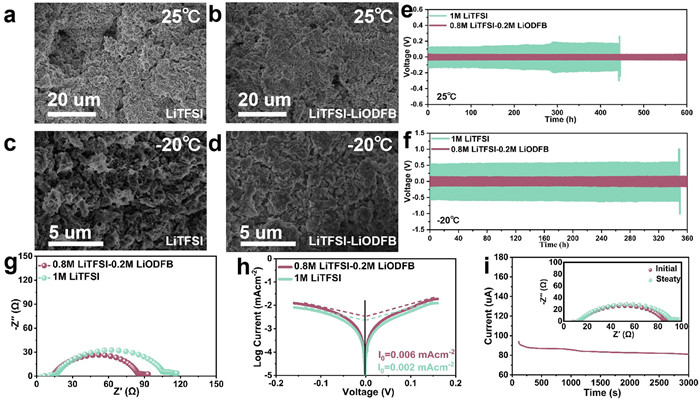
Figs. 4a-d and Fig. S8 (Supporting information) present the SEM images of the Li anode cycled 100 times at 25 and -20 ℃. Figs. 4a and c show the scans of the LiTFSI-based electrolyte, where distinct holes are observed at 25 ℃, and lithium dendrites appear at -20 ℃ [44,45]. In contrast, Figs. 4b and d display the scans of the LiTFSI-LiODFB-based electrolyte, which exhibits a uniform and smooth surface at room temperature, with fewer cracks at low temperature. The cycling performance of the Li||Li symmetric cell at 25 and -20 ℃ is presented in Figs. 4e and f, Fig. S9 (Supporting information), the LiTFSI-LiODFB-based electrolyte shows improved reversibility and reduced polarization compared to both the LiTFSI-based electrolyte and the LiPF6-based electrolyte, which can be attributed to the F-rich interface that facilitates a more uniform distribution of Li+ on the Li metal surface. Fig. 4g and Fig. S10 (Supporting information) contrast the charge transfer impedances (Rct) of Li||Li cells in different electrolytes after one cycle. As expected, the LiTFSI-LiODFB-based electrolyte holds an Rct value of 80.0 Ω, which is much smaller than the 100.0 Ω of the TIFSI-based electrolyte and the 132.0 Ω of the LiPF6-based electrolyte, suggesting enhanced interfacial charge transfer behavior in the LiTFSI-LiODFB-based electrolyte. Moreover, the Li+ transfer kinetics at the interface of Li metal and different electrolytes are measured by the exchange current density (In) derived from the corresponding Tafel curves (Fig. 4h and Fig. S11 in Supporting information). Combined with the Eq. S1 and Table S1 (Supporting information), the I0 value in LiTFSI-LiODFB-based electrolyte is 0.006 mA/cm2, significantly higher than that of in LiTFSI-based electrolyte (0.002 mA/cm2) and the LiPF6-based electrolyte (0.0005 mA/cm2). Fig. 4i and Fig. S12 (Supporting information) present the chronoamperometry (CA) curves and the corresponding impedance changes before and after the CA test of Li||Li cells in different electrolytes. Based on Eq. S2 and Table S2 (Supporting information), the Li+ transference number in the LiTFSI-LiODFB-based electrolyte is calculated to be 0.80, which is higher than that in LiTFSI-based electrolyte (0.51) and LiPF6-based electrolyte (0.50), indicating faster Li+ transfer kinetics in LiTFSI-LiODFB-based electrolyte. Additionally, the CA curves demonstrate that the mixed electrolyte maintains more stable impedance before and after the CA test, further confirming its superior interfacial stability and compatibility with Li metal. These results highlight the effectiveness of the LiTFSI-LiODFB-based electrolyte in enhancing the performance and stability of Li||Li cells under various testing conditions.
Figure 4
Figure 4.
SEM images of Li anode after cycles in 0.8 mol/L LiTFSI-0.2 mol/L LiODFB and 1 mol/L LiTFSI-based electrolytes at (a, b) 25 and (c, d) -20 ℃. Cycling performances of Li||Li cells in 0.8 mol/L LiTFSI-0.2 mol/L LiODFB and 1 mol/L LiTFSI-based electrolytes at (e) 25 and (f) -20 ℃. (g) Nyquist curves, (h) Tafel plots, and (i) chronoamperometry curves of Li||Li cells in 0.8 mol/L LiTFSI-0.2 mol/L LiODFB-based electrolyte.
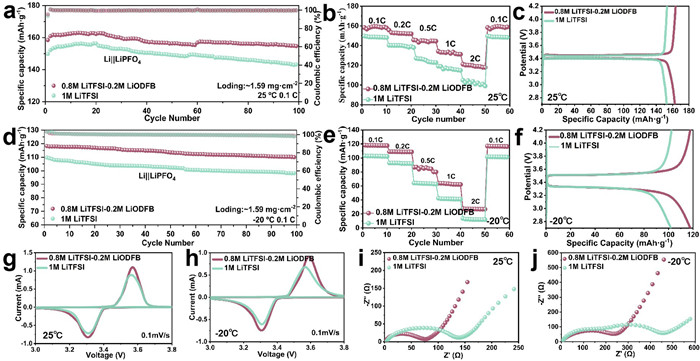
The electrochemical performances of Li||LiFePO4 cells in LiTFSI and LiTFSI-LiODFB-based electrolytes at 25 ℃ is shown in Fig. 5, while LiPF6-based electrolyte in Fig. S13 (Supporting information). The LiTFSI-LiODFB-based electrolyte exhibits excellent cycling performance with high capacity of 162.9 mAh/g at 25 ℃ (Fig. 5a and Fig. S13a). The rate performance of batteries with different electrolytes is presented in Fig. 5b and Fig. S13b. At various rates, the LiTFSI-LiODFB-based electrolyte demonstrated higher capacity. Fig. 5c and Fig. S13c show the initial charge–discharge curves of the Li||LiFePO4 cells with different electrolytes. The half-cell with the mixed LiTFSI-LiODFB-based electrolyte exhibits a slightly higher capacity in the initial cycles. The increase in battery capacity is attributed to the interfacial reactions induced by the mixed Li salt electrolyte and the specific ratio of Li salts. The low-temperature (-20 ℃) performances of the Li||LiFePO4 cells with various electrolytes are shown in Figs. 5d-f and Figs. S13d-f. Before the low-temperature test, to ensure that the electrode material is fully activated, the half-cells are cycled 20 times at room temperature. The cells with LiTFSI-LiODFB-based electrolyte showed the best low-temperature performance, after 100 cycles at -20 ℃, these cells retained approximately 70% of the capacity at 20 ℃ temperature. Compared to the LiTFSI and LiPF6-based electrolytes, the Li||LiFePO4 cells with mixed Li salt electrolyte show a significant improvement in performance. This demonstrates that the mixed Li salts can exert a synergistic effect, enhancing the cycling and rate performance of Li||LiFePO4 cells. To further analyze the effect of the mixed salt in the cells, additional electrochemical tests are conducted. Figs. 5g and h, Fig. S14 (Supporting information) show CV curves of the Li||LiFePO4 cells with various electrolytes at 25 and -20 ℃. Each CV curve exhibits a pair of redox peaks consistent with the characteristics of LiFePO4 electrodes. The reversibility of the cells is indicated by the peak current ratio (ΔE = Epa/Epc) and the symmetry of the CV curves. Compared to the CV plots at room temperature, the oxidation-reduction peaks weaken at low temperatures, indicating that low temperatures limit the redox reactions within the battery. Additionally, the redox peaks of the LiTFSI-containing electrolyte are higher than those of the LiPF6-based electrolyte, indicating the enhanced redox reaction kinetics in the corresponding cells [46,47].
Figure 5
Figure 5.
(a) Cycling performances of Li||LiFePO4 cells in different electrolytes at 0.1 C and 25 ℃. (b) Rate performances of Li||LiFePO4 cells in different electrolytes at 25 ℃. (c) The corresponding galvanostatic charge/discharge curves of Li||LiFePO4 cells in different electrolytes at 25 ℃. (d) Cycling performances of Li||LiFePO4 cells in different electrolytes at -20 ℃. (e) Rate performances of Li||LiFePO4 cells in different electrolytes at -20 ℃. (f) The corresponding galvanostatic charge/discharge curves of Li||LiFePO4 cells in different electrolytes at -20 ℃. CV curves of Li||LiFePO4 cells in different electrolytes at (g) 25 and (h) -20 ℃. Nyquist plots of Li||LiFePO4 cells in different electrolytes after 10 cycles at (i) 25 and (j) -20 ℃.
Figs. 5i and j, Fig. S15 (Supporting information) show the Nyquist plots of Li||LiFePO4 cells with different electrolytes before and after cycling at room temperature and low temperature. At room temperature, the resistance observed with the different electrolytes is not significantly different. However, after cycling at low temperature, the resistance increased significantly for all tree electrolytes, demonstrating that low temperature affects the electrode interface structure. The Rct value in LiPF6-based electrolyte is approximately four times higher than that in LiTFSI-LiODFB-based electrolyte, After the 100th cycle at 0.1 C, the LiTFSI-LiODFB-based electrolyte had the lowest Rs and Rct values of all the electrolytes [29]. This is due to the addition of moderate LiODFB, which forms a more stable and conductive interfacial film on the surface of LiFePO4 cathode and Li anode [31,32], resulting in the samller impedance of Li||LiFePO4 cells. Fig. S16 (Supporting information) further investigates the adaptability of LiTFSI-LiODFB electrolyte for NCM811 and LiCoO2 cathodes. The inferior cyclic stability for NCM811 cathode, but good availability for LiCoO2 cathode, manifesting the designed electrolyte is selective to cathode materials. This study provides a feasible design principle for the development of low-temperature electrolytes. Based on the above electrochemical performance tests of the battery at room temperature and low temperature, we have determined that the LiTFSI-LiODFB-based electrolyte is the most suitable composition [48,49].
In conclusion, a dual-salt electrolyte strategy is proposed to regulate the formation of CEI layer and modify the interfacial stability of Li||LiFePO4 cells at low temperature. As a result, the LiTFSI-LiODFB-based electrolyte is featured with high ionic conductivity and controllable solvation structure, which contributes to form a thin, uniform LiF-rich CEI on the surface of LiFePO4 cathode. Meanwhile, the introduction of LiODFB effectively mitigates the corrosion effect of LiTFSI component on Al foil, leveraging the advantages of LiTFSI at low temperature. The optimized Li||LiFePO4 cells achieve high capacity of 162.9 and 117.0 mAh/g at the temperature of 25 and -20 ℃, respectively. This work provides new insight for the design of novel electrolyte for high-performance LIBs at low temperature.
Declaration of competing interests
The authors declare that they have no known competing financial interests or personal relationships that could have appeared to influence the work reported in this paper.
The authors thank the financial support from the S&T program of Hebei (Nos. 215A4401D and 225A4404D), the Collaborative Innovation Center of Marine Science and Technology of Hainan University (No. XTCX2022HYC14), the Fundamental Research Funds for the Hebei University (No. 2021YWF11), the Science Research Project of Hebei Education Department (No. QN2024087), and the Xingtai City Natural Science Foundation (No. 2023ZZ027). Additionally, this work is partially supported by the Pico Election Microscopy Center of Hainan University.
Supplementary materials
Supplementary material associated with this article can be found, in the online version, at doi:10.1016/j.cclet.2025.111190.
Figure 1
(a, b) Snapshots of Li+ solvation structures obtained from classical molecular dynamics (MD) simulations. (c) Schematic diagram of the desolvation process of Li+ ions in the 0.8 mol/L LiTFSI-0.2 mol/L LiODFB-based electrolyte. (d, e) Radial distribution function (RDF) of Li+ ions in the 0.8 mol/L LiTFSI-0.2 mol/L LiODFB-based electrolyte. (f) Raman spectra of different electrolytes. (g) Ionic conductivity of different electrolytes. (h) DSC curves of different electrolytes. (i) Photographs of different electrolytes at -20 ℃.
Figure 2
(a) HRTEM images of the LiFePO4 cathode surface after 20 cycles in 0.8 mol/L LiTFSI-0.2 mol/L LiODFB and 1 mol/L LiTFSI-based electrolytes at 25 and -20 ℃. High-resolution C 1s spectra of the LiFePO4 cathode surface after 20 cycles in 0.8 mol/L LiTFSI-0.2 mol/L LiODFB and 1 mol/L LiTFSI-based electrolytes at (b) 25 and (c) -20 ℃. High-resolution F 1s spectra of the LiFePO4 cathode surface after 20 cycles in 0.8 mol/L LiTFSI-0.2 mol/L LiODFB and 1 mol/L LiTFSI-based electrolytes at (d) 25 and (e) -20 ℃. SEM images of the LiFePO4 cathode surface after 20 cycles in 0.8 mol/L LiTFSI-0.2 mol/L LiODFB and 1 mol/L LiTFSI-based electrolytes at (f, g) 25 and (h, i) -20 ℃.
Figure 3
SEM images of Al foil after the CV test in (a) 0.8 mol/L LiTFSI-0.2 mol/L LiODFB and (b) 1 mol/L LiTFSI-based electrolytes. EDS mapping images of selected area on Al foil after the CV test in (c) 0.8 mol/L LiTFSI-0.2 mol/L LiODFB and (d) 1 mol/L LiTFSI-based electrolytes. (e) The first and (f) second CV curves of Li||Al cells in 0.8 mol/L LiTFSI-0.2 mol/L LiODFB and 1 mol/L LiTFSI-based electrolytes. High-resolution (g) F 1s, (h) Al 2p and (i) O 1s spectra of Al foil in Li||Al cells after 5 cycles in 0.8 mol/L LiTFSI-0.2 mol/L LiODFB and 1 mol/L LiTFSI-based electrolytes.
Figure 4
SEM images of Li anode after cycles in 0.8 mol/L LiTFSI-0.2 mol/L LiODFB and 1 mol/L LiTFSI-based electrolytes at (a, b) 25 and (c, d) -20 ℃. Cycling performances of Li||Li cells in 0.8 mol/L LiTFSI-0.2 mol/L LiODFB and 1 mol/L LiTFSI-based electrolytes at (e) 25 and (f) -20 ℃. (g) Nyquist curves, (h) Tafel plots, and (i) chronoamperometry curves of Li||Li cells in 0.8 mol/L LiTFSI-0.2 mol/L LiODFB-based electrolyte.
Figure 5
(a) Cycling performances of Li||LiFePO4 cells in different electrolytes at 0.1 C and 25 ℃. (b) Rate performances of Li||LiFePO4 cells in different electrolytes at 25 ℃. (c) The corresponding galvanostatic charge/discharge curves of Li||LiFePO4 cells in different electrolytes at 25 ℃. (d) Cycling performances of Li||LiFePO4 cells in different electrolytes at -20 ℃. (e) Rate performances of Li||LiFePO4 cells in different electrolytes at -20 ℃. (f) The corresponding galvanostatic charge/discharge curves of Li||LiFePO4 cells in different electrolytes at -20 ℃. CV curves of Li||LiFePO4 cells in different electrolytes at (g) 25 and (h) -20 ℃. Nyquist plots of Li||LiFePO4 cells in different electrolytes after 10 cycles at (i) 25 and (j) -20 ℃.

 DownLoad:

 下载:
下载:


 下载:
下载:
