College of Environment, Zhejiang University of Technology, Hangzhou 310014, China
b.
Zhejiang Key Laboratory of Clean Energy Conversion and Utilization, Science and Education Integration College of Energy and Carbon Neutralization, Zhejiang University of Technology, Hangzhou 310014, China
c.
State Key Laboratory for Structural Chemistry of Unstable and Stable Species, Beijing National Laboratory for Molecular Sciences, CAS Research/Education Center for Excellence in Molecular Sciences, Institute of Chemistry, Chinese Academy of Sciences, Beijing 100190, China
d.
Carbon Neutrality Research Institute, College of Energy Engineering, Zhejiang University, Hangzhou 310027, China
Received Date:
27 October 2024 Accepted Date:
08 April 2025 Revised Date:
08 February 2025 Available Online:
15 January 2026
Abstract:
Cuprous oxide (Cu2O) is one of the most promising catalysts for electrochemical conversion of CO2 into value-added C2 products. The efficiency of CO2-to-C2 conversion is highly dependent on the Cu2O crystal plane orientation and the corresponding adsorbed *CO species. Herein, we constructed high-index crystal planes (311) in Cu2O (CO–Cu2O) via a facile self-selective CO-induced strategy under a CO atmosphere, which was verified by high-resolution transmission electron microscopy (HR-TEM) and atomic force microscopy (AFM) results. By exploiting the high surface energy of the high index crystal planes, *CO species are stabilized in CO–Cu2O during CO2RR, resulting in exceptional catalytic performance for CO2-to-C2 products. In situ infrared spectroscopy revealed that both atop-type (*COatop) and hollow-type (*COhollow) adsorption of *CO species occurred on the CO–Cu2O. The asymmetric C–C coupling energy barrier between *COatop and *COhollow in (311) crystal plane decreases by 47.8% compared to the symmetric coupling of *COatop in conventional (100) crystal planes. Consequently, the Faradaic efficiency of C2 products generated with CO–Cu2O was increased by as high as 100% compared to that with pristine Cu2O.
Carbon dioxide (CO2) is a major contributor to global warming [1,2], which causes serious environmental issues such as ocean acidification and wildfires [3,4]. Electrocatalytic CO2 reduction reaction (CO2RR) driven by renewable energy is a potential approach to reduce CO2 emissions [5–8]. The conversion of CO2 into important fuels and chemicals by electrocatalytic reduction with great significance, which is conducive to the development of industrial decarbonization. Although the CO2RR can produce a variety of products such as carbon monoxide (CO), formic acid, methane (CH4), ethylene (C2H4), ethanol, and acetic acid, it is still extremely difficult to achieve the high efficiency and selectivity towards high value C2 products with high energy density [9–14]. Cuprous oxide (Cu2O) is one of the most promising catalysts for electrochemical conversion of CO2 into value-added C2 products [15–18]. Among these C2 products, C2H4 is extremely attractive as an important raw material in the chemical industry [19]. We therefore urgently need to develop an optimal catalyst to increase the selectivity of C2H4 production. The rate-determining step (RDS) for the formation of C2H4 involves C–C coupling between adsorbed *CO or coupling of *CO hydrogenated derivatives [20–22]. However, the symmetric binding of atop-type *CO (*COatop) occurs on conventional low-index crystal planes of Cu2O due to weak *CO adsorption, leading to high-energy barrier C–C coupling reactions and hindering the CO2-to-C2 conversion [23].
By adjusting the crystal planes orientation of Cu2O, the surface energy and affinity of reaction intermediates can be effectively altered, thereby influencing the adsorption and coupling of *CO species and reduction pathway [24–26]. In particular, the design of high-index crystal planes with significant amounts of atomic steps, edges, and unsaturated coordinated sites, provides more opportunities for the preparation of catalysts with high activity and selectivity [27]. High-index crystal planes, such as (311) or (522) [28], typically exhibit higher *CO binding energies because of the higher surface energy and coordination saturation [29,30]. This results in the formation of more stable adsorbed *CO species compared to *COatop thereby improving the C2 products selectivity [31]. For instance, Han et al. synthesized with a controllable Cu2O (311) crystal plane and its C2 selectivity was about 37.5% at −1.4 V vs. RHE, which was doubled compared with 16% for the low-index crystal planes [27]. The highly chemically active high index crystal plane Cu2O (311) is energetically favorable to reduce and simultaneous evolve Cu2O fine grains, which benefits charge transfer and increases the local pH by confining OH−, resulting in high selectivity towards C2 products.
A conventional approach to tailoring crystal planes involves the introduction of extrinsic additives, such as surfactants and reductants, during catalyst synthesis [32,33]. However, the removal of residual surfactant requires complex procedures and may result in catalyst poisoning [34]. Although use of a reductant, e.g., NH2OH·HCl, can address the adverse effects of residual surfactant and expose the desired crystal planes [35], the design of such synthetic protocols remains complex and requires massive trials. Recently, a self-selective strategy involving the introduction of reactants during catalyst synthesis was proposed [36]. Compared with the introduction of extrinsic additives, the proposed self-selective strategy can address the issues of additive residue and need for massive trials. For example, using CO2 as an inducer to stabilize CO2 favored crystal planes during self-selective catalyst preparation, thereby promoting the CO2RR reaction [36,37]. Inspired by this strategy, we believe that the self-selective CO-favored crystal planes can be induced by introducing CO during the synthesis of Cu2O. This self-selective strategy tends to stabilize the planes that adsorb *CO intermediates most strongly, since the adsorption of the CO molecules reduces the relative surface energies of these planes. This aims to form other types of with stronger adsorbed *CO species besides atop-type, overcoming the limitations of symmetric coupling based on *COatop to promote asymmetric C–C coupling.
Here, we developed a novel Cu2O electrocatalyst with high-index (311) crystal planes (named CO–Cu2O) synthesized by a facile self-selective CO-induced strategy using CO as an inducer. In situ attenuated total reflection surface-enhanced infrared absorption spectroscopy (ATR-SEIRAS) and density functional theory (DFT) calculations revealed that both atop-type and hollow-type adsorption (*COhollow) of *CO species occurred on CO–Cu2O. The asymmetric C–C coupling between *COatop and *COhollow is kinetically favorable, resulting in a lower energy barrier for CO2RR compared to the symmetric coupling of *COatop. Consequently, the Faradaic efficiency of the C2 products (FEC2) generated with CO–Cu2O was increased by 100% than that of pristine Cu2O.
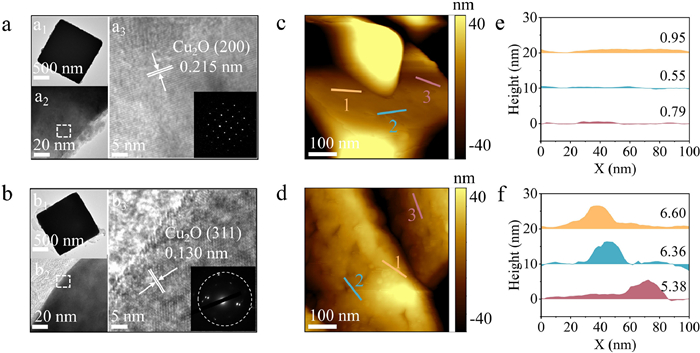
In typical synthesis, the pristine Cu2O nanoparticles were synthesized under alkaline conditions using ascorbic acid as a reductant [24], while CO–Cu2O nanoparticles were prepared following the same procedure under a CO atmosphere. Further details on the experimental section, including materials source and preparation method, can be found in Supporting information. Scanning electron microscopy (SEM) images revealed that the prepared Cu2O and CO–Cu2O nanoparticles exhibited cubic structural morphology with a diameter of about 600 nm (Figs. S1 and S2 in Supporting information). Based on the results of high-resolution transmission electron microscopy (HR-TEM) images, the interplanar spacings have been reduced from 0.215 nm in pristine Cu2O to 0.130 nm in CO–Cu2O (Figs. 1a and b). This indicates that a significant number of (311) crystal planes appear in CO–Cu2O through the self-selective CO-induced strategy. Atomic force microscopy (AFM) images (Figs. 1c and d, Fig. S3 in Supporting information) revealed that the roughness of CO–Cu2O was significantly higher than that of pristine Cu2O because the (311) crystal planes possessing abundant step- and kink- sites [38]. The line profiles (Figs. 1e and f) demonstrated an increase in the height variation on the CO–Cu2O surface compared to that on the Cu2O surface. The average heights of the CO–Cu2O and Cu2O surfaces, determined via line profile extraction analysis, were approximately 6.11 nm and a mere 0.76 nm, respectively. These particulate edges represented undercoordinated sites associated with crystal microfacets, which are considered to play a crucial role in structure-activity relationship [39,40].
Figure 1
Figure 1.
Morphologies and structural characterization of the prepared catalysts. HR-TEM images of (a) Cu2O and (b) CO–Cu2O. AFM images of (c) Cu2O smooth surface and (d) CO–Cu2O, showing nanoparticle formation after CO induction. Extracted line profiles for (e) Cu2O and (f) CO–Cu2O.
As shown in Fig. S4 (Supporting information), the X-ray diffraction (XRD) spectra demonstrated that the peaks attributed to Cu2O conformed to those of standard Cu2O (PDF #99–0041). After self-selective induction, the diffraction peaks of CO–Cu2O are similar to Cu2O, confirming that no apparent difference between Cu2O and CO–Cu2O catalysts in the crystal structure. Besides, the grazing incidence XRD analysis indicated that the (311)/(100) crystal plane intensity ratio in CO–Cu2O (0.68) was increased by 51% compared to that in pristine Cu2O with only 0.45 (Fig. S5 and Table S1 in Supporting information), indicating the increase of the preferential orientation of the crystal planes after the induction. The X-ray photoelectron spectroscopy (XPS) spectra of Cu2O and CO–Cu2O exhibited obvious peaks at 932.1 and 952.0 eV (Figs. S6 and S7 in Supporting information), being attributed to the Cu 2p1/2 and Cu 2p3/2 of Cu+, respectively. Additionally, XPS was employed to assess the differences in the O 1s spectra of various Cu2O catalysts (Fig. S8 in Supporting information). The O 1s spectra were decomposed into peaks at 529.6 and 531.4 eV, corresponding to surface-absorbed oxygen (Oads) and crystal lattice oxygen species (Olatt), respectively. The peak ratio between Olatt and Oads served as an indicator of the quantity of surface oxygen vacancies (Ov) [41]. Compared to Cu2O, CO–Cu2O enriched with Ov could stabilize Cu+ and thereby strengthen *CO adsorption to promote C–C coupling [42].
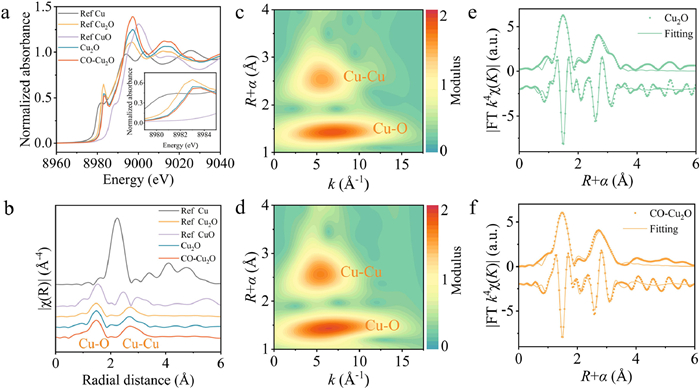
To further elucidate the chemical state and coordination environment of Cu in Cu2O and CO–Cu2O at the atomic level, the X-ray near edge spectroscopy (XANES) profiles at the Cu K-edge of the prepared Cu2O and CO–Cu2O catalysts were compared with those of commercial Cu foil, Cu2O, and CuO as reference materials (Fig. 2a). The energy positions of the prepared Cu2O and CO–Cu2O catalysts were similar to that of reference Cu2O, confirming that the valence state of Cu was mainly +1. The peak observed at 1.4 Å (without phase correction) in the R-space (k3-weighted) extended X-ray fine structure (EXAFS) spectra could be attributed to coordination between Cu and O atoms (Fig. 2b). By contrast, the peak at 2.6 Å represented Cu-Cu interactions. Similarly, wavelet transform (WT)-EXAFS was employed to further visualize the coexistence of Cu-O and Cu-Cu coordination in Cu2O and CO–Cu2O (Figs. 2c and d). The fitting results (Figs. 2e and f, Fig. S9 in Supporting information) showed that the Cu-Cu coordination number in CO–Cu2O were about 8.96, which was higher than that of Cu2O at 8.15 (Table S2 in Supporting information). The CO–Cu2O shows a higher mean Cu-Cu bond length of approximately 3.05 Å than Cu2O (2.99 Å), which is due to the tensile strain effect induced by the (311) crystal plane. Notably, the ratio of Cu-O to Cu-Cu coordination strengths in CO–Cu2O was slightly greater than that in commercial Cu2O, leading to increased structural disorder and potentially more undercoordinated sites [43].
Figure 2
Figure 2.
X-ray fine structure analysis. (a) Normalized Cu K-edge XANES spectra. (b) k3-weighted Fourier transform EXAFS spectra without phase correction. Cu K-edge WT-EXAFS contour plots of (c) Cu2O and (d) CO–Cu2O. Fitting of k space and R space of Cu in (e) Cu2O and (f) CO–Cu2O.
To determine the effect of adsorbed *CO species on the high-index crystal planes of CO–Cu2O, in situ ATR-SEIRAS was carried out (Figs. 3a and b), and peaks were classified as the corresponding intermediates according to reported studies (Fig. 3c). The spectra were collected in CO2-saturated 0.5 mol/L KHCO3 solution at different potentials from 0 V to −1.0 V vs. RHE. The peak intensity is expressed in terms of absorbance and the positive peak represents product formation. In particular, two peaks appeared at approximately 2050–1820 cm−1 for CO–Cu2O, which were associated with *COatop and *COhollow on the surface, respectively [44]. By comparison, the spectrum of Cu2O mainly exhibited the *COatop peak in the same potential region. Two *COatop peaks were clearly recognized in the spectra of CO–Cu2O at potentials above −0.4 V vs. RHE. The *COatop peaks could be classified into high-frequency binding *CO (CO–HFB) and low-frequency binding *CO (CO-LFB) [45,46]. Prior research reported that CO-LFB is associated with C–C coupling and C2H4 production, while CO–HFB is typically related to the production of gaseous CO [47,48]. Notably, as the potential shifted to more negative values, the red shift observed for the CO stretching bands in the CO–Cu2O spectra may have been attributed to the Stark effect [49]. This finding suggested an increase in the adsorption of *COatop on the surface, potentially fostering further protonation or C–C coupling reactions [50]. Hence, we plotted the integrated *COatop peak area against the applied potentials (Figs. 3d and e).
Figure 3
Figure 3.In situ monitoring of adsorbed *CO species. In situ ATR-SEIRAS spectra of (a) Cu2O and (b) CO–Cu2O during timed current scans from 0 V to −1.0 V vs. RHE. (c) The adsorption behavior of species within 2200–1600 cm−1 ranges, with Cu, O, C, and H represented by orange, red, gray, and white, respectively. The integrated area of *COatop for (d) Cu2O and (e) CO–Cu2O at various wavenumbers is also shown. The experimental conditions included CO2-saturated 0.5 mol/L KHCO3 as the electrolyte. Peak positions were determined based on the maximum intensity of the CO stretching band. (f) Electrochemical CO stripping voltammetry curves of Cu2O and CO–Cu2O in saturated N2 or CO atmospheres.
As the applied potential increased, the integrated area of CO–HFB on the Cu2O surface decreased, and no CO-LFB appeared within the applied potential range. Meanwhile, CO-LFB was observed on CO–Cu2O when the applied potential exceeds −0.4 V vs. RHE and the integration area reached a maximum at −0.7 V vs. RHE. Compared with single CO–HFB on Cu2O, CO-LFB newly appeared on CO–Cu2O with a more negative potential. Notably, the absence of CO-LFB signals was detected due to low C–C coupling activity at lower potentials. At higher potentials, the integrated area for CO–Cu2O dropped owing to *CO consumption for C–C coupling. In addition, new bands emerged on the CO–Cu2O surface at 1835–1780 cm−1 when the applied potential was above −0.4 V vs. RHE, corresponding to *COhollow species [44]. These results suggested that the electronic structure of the catalyst was changed via CO induction, which triggered more *CO adsorption configurations. As the potential was further shifted to more negative values, the quantity of adsorbed *COhollow progressively augmented. Benefiting from the (311) crystal plane in CO–Cu2O with stronger affinity for *CO, thus CO–Cu2O catalyst has higher *COatop and *COhollow coverage at high overpotentials, further promoting asymmetric C–C coupling. Besides, the peak at 1720 cm−1 can be assigned to *CHO (Fig. S10 in Supporting information), which is well accepted as the starting adsorption mode of intermediate for C–C coupling [14,51]. However, no significant *CHO adsorption peak was detected for Cu2O at all potentials, indicating a high protonation energy barrier affecting subsequent C–C coupling. Meanwhile, an enhanced water (*H-O-H) peak at approximately 1620 cm−1 was observed on Cu2O, which may have led to a blocking effect, facilitating substitution of *H for *CO [52]. Notably, the *H coverage on Cu2O is opposite to that on CO–Cu2O, which is associated with higher *CO coverage, resulting in *CO occupying more active sites. In addition, we then also investigated the CO adsorption ability of Cu2O and CO–Cu2O via electrochemical CO stripping voltammetry [53,54]. With the activation process going on, the intensity of oxidic peak corresponding to CO adsorbed on CO–Cu2O was significantly increased compared to that for Cu2O (Fig. 3f), indicating stronger CO binding capacity and higher CO coverage that attributed to the increased of electrochemical adsorption of CO [49], which was consistent with the IR spectral analysis. The above results demonstrated that CO–Cu2O possessed an asymmetric *CO coupling mode and higher *CO coverage than Cu2O, promoting asymmetric C–C coupling on nearby sites under electrochemical reduction conditions.
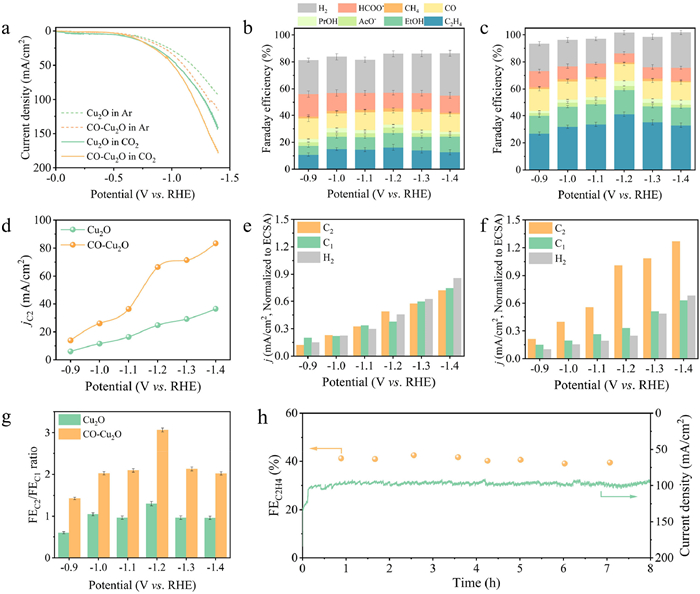
To verify the above results, we performed CO2RR for Cu2O and CO–Cu2O. The electrochemical CO2RR was performed using a flow cell with 0.5 mol/L KHCO3 as electrolyte. The gas chromatography and 1H nuclear magnetic resonance spectroscopy (1H NMR) were employed to quantify the products in the gas and liquid phases, respectively. The specific relationships among different products determined from the NMR spectra are presented in Fig. S11 (Supporting information). Linear sweep voltammetry (LSV) images of the Cu2O and CO–Cu2O electrodes were acquired in CO2 or N2-saturated atmospheres electrolyte (Fig. 4a). Under CO2 and N2 atmospheres, Cu2O catalysts exhibited relatively lower current density (j) values at the same applied potentials than CO–Cu2O. The results suggested that the increment in high-index crystal planes substantially enhanced the CO2RR activity of CO–Cu2O. Figs. 4b and c present the selectivity of CO–Cu2O under various imposed potentials, where the FEC2 (62%) of CO–Cu2O was nearly double that of Cu2O (31%) at −1.2 V vs. RHE. For pristine Cu2O, the main product was H2 with nearly 30% FE, while the C2H4 selectivity promoted from 16.2% to 41.1% in CO–Cu2O, whose value was 150% than pristine Cu2O. Meanwhile, the partial current density of C2 products generated with CO–Cu2O reached 66 mA/cm2 compared to 25 mA/cm2 for pristine Cu2O (Fig. 4d). Additionally, the electrochemical active surface areas (ECSA) of Cu2O and CO–Cu2O were measured (Fig. S12 in Supporting information). The ECSA of CO–Cu2O was 65.8 cm2, which was larger than that of Cu2O (50.7 cm2). This finding indicated that CO–Cu2O could provide more active sites than Cu2O. The intrinsic activity of the catalysts was obtained by normalizing the current density to the ECSA [55]. The modified current densities indicated that CO–Cu2O exhibited greater activity than Cu2O for C2 products formation and inhibited H2 generation (Figs. 4e and f).
Figure 4
Figure 4.
CO2-to-C2 electroreduction performance. (a) Comparison of LSV for CO2 and Ar-saturated electrolytes. Faradaic efficiency of each product generated with (b) Cu2O and (c) CO–Cu2O at various imposed potentials. (d) The partial current density of C2 products at various potentials over Cu2O and CO–Cu2O. ECSA-normalized current density of different products of (e) Cu2O and (f) CO–Cu2O. (g) The FEC2/FEC1 ratios of Cu2O and CO–Cu2O under various imposed potentials. (h) Stability tests of CO–Cu2O at −1.2 V vs. RHE in 0.5 mol/L KHCO3.
As shown in Fig. 4g, CO–Cu2O achieved a 2.35-fold increase in the FEC2/FEC1 ratio at −1.2 V vs. RHE compared to pristine Cu2O. Moreover, CO–Cu2O exhibited a lower FEH2 than pristine Cu2O at all potentials, and the FEC1 of CO–Cu2O did not significantly increase compared to that of pristine Cu2O. This suggests that the hydrogen evolution reaction (HER) in CO–Cu2O was effectively suppressed, and the increased in the amount of C2 products could be attributed to the inhibition of *H conversion. This is consistent with in situ ATR-SEIRAS spectra observations of higher *CO and lower *H coverage, where elevated *CO is involved in the C–C coupling process to form C2 products. Additionally, the long-term durability performance of CO–Cu2O catalyst reveal that it maintained a relatively stable current density and C2H4 selectivity during the whole operation period (Fig. 4h). Combined with CO2RR performance, the study findings indicated that *COhollow became dominant at higher cathodic potential, contributing to asymmetric *COatop and *COhollow coupling that enhanced C2 products formation [50]. As shown in Fig. S13 (Supporting information), electrochemical impedance spectroscopy (EIS) revealed a lower charge transfer resistance (Rct) of CO–Cu2O at the open circuit potential compared to Cu2O, which improved the charge transfer kinetics of the developed catalyst compared to pristine Cu2O. However, CO2 reduction typically occurs at much more negative applied potentials, and the arcs in the Nyquist diagrams substantially decreased from Cu2O to CO–Cu2O, further demonstrating the reduced the transfer resistance of CO–Cu2O compared to pristine Cu2O [49]. Hence, it could be concluded that the presence of high-index crystal plane also had an improvement in electron transfer performance to boost the CO2RR performance.
Stabilizing the Cu+ content during the CO2RR process is crucial for generating the corresponding *CO intermediate and final C2 products [56], whereas presence of Cu+can promote *CO to *CHO and the adsorption of OH species, causing C2 intermediates preferably to form the sp3 hybrid C atom and undergo asymmetric hydrogenation, leading to the enhancement of C–C coupling [57]. The SEM images revealed that the surface morphology of CO–Cu2O after CO2RR for 1 h at −1.2 V vs. RHE had better stability than Cu2O (Fig. S14 in Supporting information). In addition, the XRD spectra indicated the generation of reduced metal Cu (PDF #04–0836) species on Cu2O and CO–Cu2O (Fig. 5a). The peak intensity of Cu (111) and Cu (200) on Cu2O was significantly higher than that on CO–Cu2O after the reaction, indicating that more Cu+ was reduced on Cu2O. Similarly, the ex-situ TEM images and selected area electron diffraction patterns revealed the presence of metallic Cu and Cu+ in Cu2O and CO–Cu2O after the reaction (Fig. S15 in Supporting information), indicating that Cu+ underwent reduction. Moreover, the stable presence of the (311) plane of CO–Cu2O is still observed after the reaction, indicating that (311) plane contributes to the formation of stable atomic clusters or structures during electroreduction and that this reconfiguration contributes to the fixation of the Cu+ valence state. Based on the XRD spectra, the Cu LMM spectra of Cu2O and CO–Cu2O after 1 h CO2RR are examined to show the changing valence state of Cu. The Cu LMM Auger spectra (Figs. 5b and c) clarified that Cu+ (916.6 eV) and metallic Cu (918.5 eV) species co-existed on the Cu2O and CO–Cu2O catalysts. The results indicated that Cu+ species on CO–Cu2O remained well stabilized, with only 3% conversion to metallic Cu, whereas approximately 23% of Cu+ in Cu2O was converted to metallic Cu upon electroreduction. The above results indicate that the CO–Cu2O catalyst can stabilize the surface morphology and Cu+ species, which is conducive to maintaining the activity of the electroreduction reaction.
Figure 5
Figure 5.
Cu valence changes in catalysts after CO2 electroreduction. (a) XRD spectra of Cu2O and CO–Cu2O after 1 h of CO2RR at −1.2 V vs. RHE. Cu LMM spectra of (b) Cu2O and (c) CO–Cu2O at initial states and those after 1 h of CO2RR at −1.2 V vs. RHE.
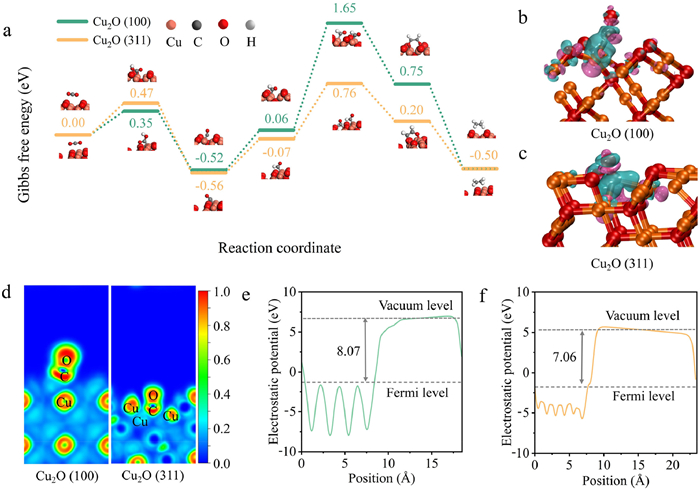
DFT calculations are conducted to verify the possible asymmetric C–C coupling mechanism on Cu2O (311) crystal plane (Fig. 6a and Fig. S16 in Supporting information). As shown in Fig. 6a, the CO2 molecule initially adsorbs on the Cu site, undergoing hydrogenation to form the *COOH intermediate. This is then reduced to the *CO intermediate, which combines with protons to yield the *CHO intermediate. Subsequently, the adsorbed *CHO undergoes a similar process to form 2*CHO intermediate on the surface. This 2*CHO intermediate then undergoes dimerization to form the *OHCCHO intermediate, which is finally hydrogenated to produce C2H4. Intriguingly, the (311) crystal plane boosts the activation of Cu site and reaches the hollow-type adsorption of *CO, which is consistent with the monitoring results from in situ spectroscopies. Consequently, the energy barrier of their asymmetric coupling of *COatop and *COhollow decreases with 47.8% compared to the conventional symmetric coupling of *COatop.
Figure 6
Figure 6.
Mechanistic studies by DFT calculations. (a) The free energy diagrams for CO2 reduction to different intermediates on the Cu2O (100) and Cu2O (311) surfaces at U = 0 V. DCD map for the *CO intermediate adsorbed on the (b) Cu2O (100) and (c) Cu2O (311) surfaces. (d) ELF of Cu2O (100) and Cu2O (311). The WF across the (e) Cu2O (100) slab and (f) Cu2O (311) slab vacuum interface.
The two critical steps in the CO2RR pathway to C2H4 are the hydrogenation of *CO to form the *CHO intermediate and the coupling of *CHO [58]. In the former *CO → *CHO step, the Gibbs free energy change on the Cu2O (311) surface (ΔG = 0.49 eV) is slightly lower than on the Cu2O (100) surface (ΔG = 0.58 eV). This suggests that CO–Cu2O with (311) is more easily protonated, which is consistent with the weaker *CHO that is observed in the infrared spectra. For the *CHO dimerization step, the uphill reaction energy for the formation of 2*CHO from *CHO is an RDS for the entire reaction pathway. In addition, *CO is the pivotal intermediate in the conversion of CO2 to C2 products [59,60], with the adsorption energy of *CO playing an important role in their reaction rates [61]. During the activation process, the decomposition of *COOH on Cu2O (311) has a higher free energy compared to that on Cu2O (100), indicating that the formation of *CO is more favorable on Cu2O (311). As shown in Figs. S17 and S18 (Supporting information), the hollow site of the (311) crystal plane exhibited the most robust CO adsorption (ΔE = −1.57 eV), and strong *CO adsorption ensured adequate *CO coverage on its surface [62,63]. In this way, *CO occupied the catalytic active sites on the (311) crystal plane, which strengthened asymmetric C–C coupling and CO2 to C2 production.
To better visualize the incorporation of the *CO intermediate with the catalysts, we calculated the differential charge density (DCD) of Cu2O (100) and Cu2O (311) crystal planes after *CO adsorption (Figs. 6b and c). Compared with the (100) crystal plane, the charge distributed around the Cu atom on the (311) crystal plane moved more toward the C atom side, indicating enhanced binding energy between *CO and the CO–Cu2O surface. As shown in the electron localization function (ELF) topographical analysis in Fig. 6d, the (311) crystal plane displayed higher electron delocalization around the formed *CO adsorption sites than that of (100) crystal plane. This suggests that *CO adsorbed on the (311) surface favors the formation of a more stable adsorption configuration, resulting in asymmetric C–C coupling. Work function (WF) can serve as a characteristic quantity to evaluate the catalytic activity [64]. Correspondingly, the detailed WF revealed that the WF value in the (311) crystal plane was lower than that of the (100) crystal plane (Figs. 6e and f). The lower the WF value, the more easily electrons can leave the metal, leading to more efficient electron transfer. To summarize, Cu2O (311) surface conducive to the electron transfer to the direction of CO2 electroreduction, thus enhancing the activity and selectivity for the CO2RR performance.
In summary, the asymmetric coupling of atop-type and hollow-type adsorbed *CO species occurring on the constructed high-index crystal planes was crucial for enhancing the CO2-to-C2 conversion. An efficient catalyst CO–Cu2O with Cu2O (311) crystal planes was synthesized via the facile self-selective CO-induced strategy proposed in this work. The energy barrier of their asymmetric coupling of *COatop and *COhollow decreases with 47.8% compared to the conventional symmetric coupling of *COatop. Benefiting from the asymmetric coupling mechanism, the FEC2 generated with CO–Cu2O was increased by nearly 100% at −1.2 V vs. RHE compared to that with pristine Cu2O. This study elucidates the mechanism of asymmetric C–C coupling facilitated on high-index crystal planes and offers a method to design efficient catalysts for CO2-to-C2 conversion.
Declaration of competing interest
The authors declare that they have no known competing financial interests or personal relationships that could have appeared to influence the work reported in this paper.
The authors thankfully acknowledge the financial support from the National Natural Science Foundation of China (Nos. U23A20677, 22022610 and 52400137), "Pioneer" and "Leading Goose" R & D Program of Zhejiang (Nos. 2022C03146 and 2023C03017), China Postdoctoral Science Foundation (No. 2024T170805), and Zhejiang Provincial Natural Science Foundation of China (No. LDT23E06015B06). The authors acknowledge the support of the Research Computing Center in College of Chemical and Biological Engineering at Zhejiang University for assistance with the calculations.
Supplementary materials
Supplementary material associated with this article can be found, in the online version, at doi:10.1016/j.cclet.2025.111187.
[1]
Z. Liu, Z. Deng, S. Davis, et al., Nat. Rev. Earth Environ. 4 (2023) 205–206. doi: 10.1038/s43017-023-00406-z
[2]
P. De Luna, C. Hahn, D. Higgins, et al., Science 364 (2019) eaav3506. doi: 10.1126/science.aav3506
[3]
K. Alter, J. Jacquemont, J. Claudet, et al., Nat. Commun. 15 (2024) 2885. doi: 10.1038/s41467-024-47064-3
[4]
C.A. Phillips, B.M. Rogers, M. Elder, et al., Sci. Adv. 8 (2022) eabl7161. doi: 10.1126/sciadv.abl7161
[5]
F. Dattila, R.R. Seemakurthi, Y.C. Zhou, et al., Chem. Rev. 122 (2022) 11085–11130. doi: 10.1021/acs.chemrev.1c00690
[6]
Y. Zhao, X.L. Zu, R.H. Chen, et al., J. Am. Chem. Soc. 144 (2022) 10446–10454. doi: 10.1021/jacs.2c02594
M.T. Greiner, L. Chai, M.G. Helander, et al., Adv. Funct. Mater. 22 (2012) 4557–4568. doi: 10.1002/adfm.201200615
Figure 1
Morphologies and structural characterization of the prepared catalysts. HR-TEM images of (a) Cu2O and (b) CO–Cu2O. AFM images of (c) Cu2O smooth surface and (d) CO–Cu2O, showing nanoparticle formation after CO induction. Extracted line profiles for (e) Cu2O and (f) CO–Cu2O.
Figure 2
X-ray fine structure analysis. (a) Normalized Cu K-edge XANES spectra. (b) k3-weighted Fourier transform EXAFS spectra without phase correction. Cu K-edge WT-EXAFS contour plots of (c) Cu2O and (d) CO–Cu2O. Fitting of k space and R space of Cu in (e) Cu2O and (f) CO–Cu2O.
Figure 3In situ monitoring of adsorbed *CO species. In situ ATR-SEIRAS spectra of (a) Cu2O and (b) CO–Cu2O during timed current scans from 0 V to −1.0 V vs. RHE. (c) The adsorption behavior of species within 2200–1600 cm−1 ranges, with Cu, O, C, and H represented by orange, red, gray, and white, respectively. The integrated area of *COatop for (d) Cu2O and (e) CO–Cu2O at various wavenumbers is also shown. The experimental conditions included CO2-saturated 0.5 mol/L KHCO3 as the electrolyte. Peak positions were determined based on the maximum intensity of the CO stretching band. (f) Electrochemical CO stripping voltammetry curves of Cu2O and CO–Cu2O in saturated N2 or CO atmospheres.
Figure 4
CO2-to-C2 electroreduction performance. (a) Comparison of LSV for CO2 and Ar-saturated electrolytes. Faradaic efficiency of each product generated with (b) Cu2O and (c) CO–Cu2O at various imposed potentials. (d) The partial current density of C2 products at various potentials over Cu2O and CO–Cu2O. ECSA-normalized current density of different products of (e) Cu2O and (f) CO–Cu2O. (g) The FEC2/FEC1 ratios of Cu2O and CO–Cu2O under various imposed potentials. (h) Stability tests of CO–Cu2O at −1.2 V vs. RHE in 0.5 mol/L KHCO3.
Figure 5
Cu valence changes in catalysts after CO2 electroreduction. (a) XRD spectra of Cu2O and CO–Cu2O after 1 h of CO2RR at −1.2 V vs. RHE. Cu LMM spectra of (b) Cu2O and (c) CO–Cu2O at initial states and those after 1 h of CO2RR at −1.2 V vs. RHE.
Figure 6
Mechanistic studies by DFT calculations. (a) The free energy diagrams for CO2 reduction to different intermediates on the Cu2O (100) and Cu2O (311) surfaces at U = 0 V. DCD map for the *CO intermediate adsorbed on the (b) Cu2O (100) and (c) Cu2O (311) surfaces. (d) ELF of Cu2O (100) and Cu2O (311). The WF across the (e) Cu2O (100) slab and (f) Cu2O (311) slab vacuum interface.

 DownLoad:


 下载:
下载:


 下载:
下载:
