National Energy Metal Resources and New Materials Key Laboratory, Engineering Research Center of the Ministry of Education for Advanced Battery Materials, Hunan Provincial Key Laboratory of Nonferrous Value-Added Metallurgy, School of Metallurgy and Environment, Central South University, Changsha 410083, China
b.
BASF Shanshan Battery Materials Co., Ltd., Changsha 410205, China
c.
National Engineering Research Centre of Advanced Energy Storage Materials, Changsha 410205, China
* Corresponding author at: National Energy Metal Resources and New Materials Key Laboratory
Engineering Research Center of the Ministry of Education for Advanced Battery Materials
Hunan Provincial Key Laboratory of Nonferrous ValueAdded Metallurgy
Received Date:
15 February 2025 Accepted Date:
27 March 2025 Revised Date:
19 March 2025 Available Online:
15 July 2026
Abstract:
The combination of high-nickel cathodes with poly(ethylene oxide) (PEO)-based solid-state electrolytes represents a promising strategy to achieve both high energy density and enhanced safety. However, existing studies predominantly employ LiFePO4 cathodes due to the inherent limitations of PEO-based electrolytes in high-voltage stability. Even with the improved electrochemical stability window (ESW) of PEO-based electrolytes, current implementations still utilize low-nickel-content (≤80%) cathodes. To further enhance the energy density of PEO-based solid-state batteries (SSBs), this work employs high-nickel-content (> 80%) cathodes in conjunction with PEO-based electrolytes. The influence of nickel content in cathode materials (CAMs) on the electrochemical performance of PEO-based SSBs is systematically investigated through a progressive nickel content optimization approach. This study elucidates the intrinsic relationship between the nickel content and the characteristic capacity activation mechanism observed during the initial cycling phases in solid-state battery systems, revealing a nickel-content-dependent electrochemical activation pattern unique to solid-state configurations. Additionally, through a series of detection schemes, the failure mechanism of high-nickel PEO-based SSBs is systematically studied from the cathode/electrolyte interface, electrolyte, and CAM. Particularly, the degree of PEO decomposition is quantitatively analyzed using differential electrochemical mass spectrometry (DEMS) and gel permeation chromatography (GPC). This work reveals the key issues faced when further increasing the nickel content of CAMs, providing insights for targeted modification designs of high-nickel PEO-based solid-state batteries in the future.
In the past decade, the explosive growth of new energy vehicle production has driven rapid development across the entire industrial chain [1]. However, the persistent issue of limited driving range has become increasingly prominent, emerging as a critical constraint on further advancement in the new energy vehicle sector [2,3]. Consequently, enhancing battery energy density is of utmost urgency. As electrode materials fundamentally determine system energy density, Li metal anode has garnered significant attention due to its high theoretical specific capacity (3860 mAh/g) and low redox potential (−3.04 V vs. standard hydrogen potential), positioning it as one of the most promising anodes [4,5]. Nevertheless, lithium dendrites formed through uneven lithium deposition can readily induce short circuits, leading to electrolyte combustion or even explosions [6].
Compared with liquid electrolytes, non-flammable solid-state electrolytes not only significantly enhance battery safety and stability but also effectively isolate electrodes and prevent lithium dendrite penetration [7-9]. Current debates persist regarding the best type of solid-state electrolyte, including polymer electrolytes, inorganic electrolytes, and composite solid-state electrolytes [10,11]. Among these, flexible polymer electrolytes with cost-effective advantages are considered one of the most promising directions [12]. However, the relatively low electrochemical oxidation potential of polymer electrolytes caused by their high highest occupied molecular orbital (HOMO), typically necessitates pairing with stable LiFePO4 (LFP) cathodes, substantially constraining system energy density [13]. To enhance the electrochemical stability window (ESW) of polymers, numerous strategies have been proposed, encompassing molecular structure design, interactions, concentrated polymer electrolytes, and inorganic filler incorporation [14,15]. Although linear sweep voltammetry (LSV) testing demonstrates significant ESW improvements through these modifications, practical applications continue to predominantly utilize ternary cathode materials with low nickel content (Ni ≤ 80%), while high-nickel cathodes (Ni > 80%) remain largely unexplored [16-19]. This limitation substantially compromises the energy density competitiveness of solid-state batteries. Notably, nickel content critically determines system energy density, and high-nickel cathodes have gained widespread adoption in liquid electrolyte systems [20]. Extensive research has been conducted on structural degradation and associated failure mechanisms of high-nickel cathodes in liquid systems, leading to targeted modification strategies including coating and doping [20-23]. Similarly, further research into the construction and failure mechanisms of polymer/high-nickel cathode systems is a prerequisite for enhancing system stability.
The integration of polymer electrolytes with ultra-high-nickel cathodes represents an inevitable industry trend [24-27]. This study constructs batteries using high-nickel cathode materials paired with poly(ethylene oxide) (PEO)-based electrolytes, progressively increasing nickel content from 83% to 93% to investigate correlations between nickel content, system energy density, and cycling stability. Combined with post-cycle analysis of each battery component, including cathode, electrolyte, and anode, the failure mechanisms of the system were systematically studied. Results demonstrate a gradual capacity enhancement with increasing nickel content, accompanied by a reduced initial Coulombic efficiency and diminished capacity retention. Further analysis reveals that system failure correlates with cathode nickel content: The extended high-voltage plateau and intensified oxidative state at high state-of-charge (SOC) in ultra-high-nickel cathodes accelerate both electrochemical and chemical decomposition of PEO-based electrolytes. This degradation induces molecular chain scission, mechanical strength reduction, and compromised dendrite resistance, ultimately leading to overcharging and micro-short circuits during high-voltage operation, thereby exacerbating system failure.
Firstly, high-nickel cathode materials N83, N88, N90, and N93 with nickel contents of 83%, 88%, 90%, and 93%, respectively, were employed to fabricate PEO-based solid-state batteries (Li|PEO|NCM) for electrochemical performance evaluation. Substantial optimization of electrochemical properties has been achieved in our earlier development of PEO-based polymer electrolytes [28]. All four cathode materials were synthesized under identical conditions to ensure comparable morphology and structural characteristics. Additional SEM images and XRD patterns will be provided in Supporting information to confirm their structural and morphological consistency. As shown in Figs. S1 and S2 (Supporting information), these data confirm that differences in electrochemical performance primarily arise from nickel content rather than morphological or structural variations. Fig. 1a displays the initial charge-discharge profiles of samples with varying nickel contents at 25 ℃ and 0.1 C, where the discharge specific capacities of N83, N88, N90, and N93 are 206.3, 212.7, 220.9, and 222.5 mAh/g, respectively. These results demonstrate a progressive enhancement in discharge specific capacity with increasing nickel content. However, the initial Coulombic efficiency decreases from 89.2% to 87.6% as the nickel content rises from 83% to 93%. Analysis of the charge-discharge profiles and corresponding dQ/dV curves in Fig. 1b reveals a pronounced elongation of the discharge plateau near 4.2 V, which predominantly accounts for the elevated capacity of N93. Nevertheless, the extended plateau in N93 corresponds to prolonged high-voltage operation under constant-voltage conditions. Given the narrow ESW of PEO, this prolonged exposure may exacerbate its decomposition, thereby contributing to the observed reduction in Coulombic efficiency [29,30]. The rate capability of samples with different nickel contents was further investigated. As summarized in Fig. 1c, all samples exhibit capacity degradation as the discharge rate increases from 0.1 C to 2 C. Specifically, the discharge specific capacities at 2 C are 82.9, 91.1, 86.9, and 89.7 mAh/g for N83, N88, N90, and N93, respectively. The increase in nickel content fails to enhance rate capability, and the capacity disparity among samples with varying nickel contents diminishes with escalating discharge rates. Cyclic voltammetry (CV) tests were conducted on samples with different nickel content to investigate their electrochemical reversibility. As shown in Fig. S3 (Supporting information), all samples exhibit three pairs of redox peaks corresponding to H1-M, M-H2, and H2-H3 phase transitions. The H2-H3 phase transition peaks at high voltages are intensified progressively with nickel content elevation, consistent with observations from dQ/dV curves. The corresponding ΔV (the voltage difference between oxidation and reduction peaks) values for N83, N88, N90, and N93 are 0.107, 0.193, 0.215, and 0.233 V, respectively, indicating enhanced polarization with increased nickel content. Previous studies suggest that cobalt element plays a crucial role in improving lithium-ion diffusion within ternary cathode materials [31,32]. Therefore, the observed polarization amplification can be attributed to cobalt content reduction accompanying nickel content elevation.
Figure 1
Figure 1.
(a) First-cycle charge-discharge voltage profiles at 0.1 C and (b) corresponding dQ/dV profiles. (c) Rate capability with different current densities of 0.1–2 C. (d) Cycling performances at 0.5 C and (e) corresponding Coulombic efficiency. Charge-discharge voltage profiles at 0.5 C during the 96th–100th cycles of (f) N83 and (g) N93.
Subsequent cycling performance tests under 0.2 C charging and 0.5 C discharging conditions reveals an unexpected phenomenon. Fig. 1d demonstrates that all samples exhibit initial capacity growth followed by gradual degradation during cycling. This capacity activation phenomenon during early cycling stages has been reported in both organic and inorganic solid-state systems without receiving substantial attention, yet remains conspicuously absent in liquid electrolyte systems [33-37]. For comparative analysis, liquid electrolyte and identical nickel-content cathodes were assembled and tested under the same conditions. As shown in Fig. S4 (Supporting information), no capacity activation is observed throughout the 100-cycles test in liquid systems, confirming this phenomenon as a distinctive characteristic of solid-state configurations. Furthermore, Fig. 1d illustrates that the activation period duration exhibits nickel-content dependence. The maximum discharge specific capacities for N83, N88, N90, and N93 appear at cycle 42, 38, 25, and 8, respectively. This observation demonstrates a progressive advancement of the capacity peak position with increasing nickel content, necessitating further investigation to unravel the mechanistic relationship between capacity activation phenomena and nickel concentration gradients. The initial 0.5 C discharge specific capacities measure 169.5, 172.3, 179.2, and 186.9 mAh/g for N83–N93 respectively, showing incremental enhancement with nickel content. After 100 cycles, the respective capacities stabilize at 174.6, 166.6, 167.0, and 154.9 mAh/g. When normalized against maximum achieved capacities, the retention rates are calculated as 94.4%, 91.2%, 90.6%, and 82.9% for N83–N93, respectively. Cycling stability deteriorates with nickel content elevation, particularly notable in N93 which exhibits capacity fluctuations during later cycles. Fig. 1e reveals that N83, N88, and N90 maintain stable Coulombic efficiencies close to 100% throughout cycling, whereas N93 exhibits significant efficiency fluctuations during the 70th–100th cycles, markedly lower than other samples. Charge-discharge curves during the 96th–100th cycles demonstrate that the capacity fluctuations and diminished Coulombic efficiency in the high-nickel N93 originate from overcharging in the high-voltage and micro-short circuits during charging (Figs. 1f and g, Fig. S5 in Supporting information). This observation indicates intensified side reactions from PEO-based electrolyte decomposition and non-uniform lithium deposition in high-nickel systems. In contrast, low-nickel samples exhibit superior stability, with smooth charge-discharge curves observed for N83, N88, and N90 in later cycles. In liquid electrolyte systems, the capacity retention rates after 100 cycles for N83, N88, N90, and N93 are 86.6%, 85.6%, 84.6%, and 82.7%, respectively, demonstrating identical nickel-content-dependent degradation trends to those in solid-state systems. Although all liquid-system samples display lower capacity retention compared to their solid-state counterparts, they exhibit enhanced cycling stability without capacity fluctuations or Coulombic efficiency decay. This disparity arises from the dual functionality of solid-state electrolytes: Beyond lithium-ion conduction (analogous to liquid electrolytes), they must simultaneously serve as electrode separators [38]. Consequently, electrolyte decomposition in solid-state systems more readily induces micro-short circuits, which is a critical failure mechanism requiring attention in solid-state battery design [24].
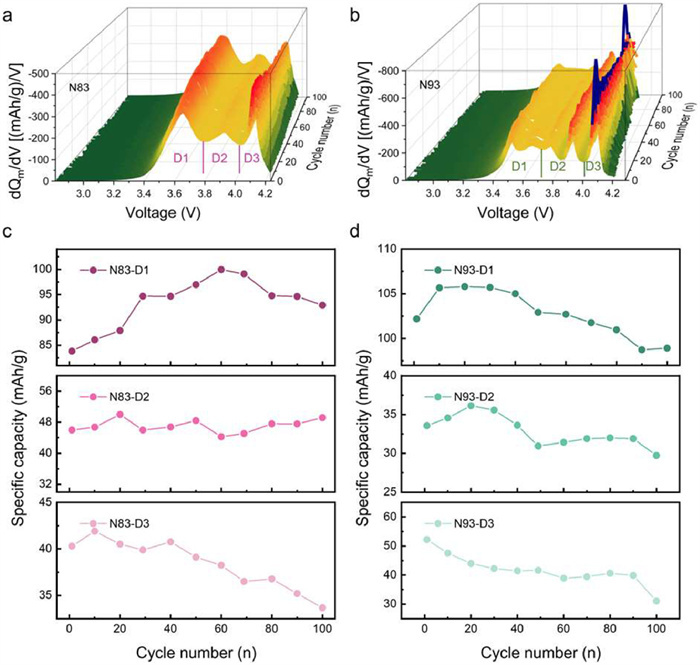
To elucidate the mechanism underlying capacity activation, statistical analysis of electrochemical behavior during cycling was performed. A comparative investigation between N83 (lowest nickel content) and N93 (highest nickel content) was conducted to amplify the electrochemical difference induced by nickel content variation. Figs. 2a and b present the dQ/dV profiles of N83 and N93 during discharge over 100 cycles, respectively. Both N83 and N93 exhibit progressive attenuation of the H2-H3 phase transition peaks at high voltages, while N93 demonstrates accelerated peak decay. However, the abrupt increase in phase transition capacity of N93 is attributed to the oxidative decomposition of the PEO electrolyte in the high-voltage phase associated with this transition. This phenomenon induces repeated deposition of Li at the anode, leading to localized overcharging during cycling processes and consequent deep delithiation of the N93. During the subsequent discharge phase, lithium re-intercalation into the cathode material occurs, thereby leading to the enhanced discharge capacity. Notably, the H1-M phase transition peak of N83 at low voltages displays initial enhancement followed by decline, suggesting capacity activation correlates with voltage-dependent phase transition contributions. For quantitative assessment of phase transition contributions across voltage ranges, dQ/dV curves were partitioned into three segments (D1, D2, D3) as annotated, with integral area corresponding to discharge specific capacities in respective voltage ranges. The discharge capacities of N83 and N93 across different voltage ranges were quantified and plotted as a function of cycle number, with the corresponding results presented in Figs. 2c and d, respectively. The discharge capacity contributed by the D1 section in the medium-low voltage range of N83 gradually increases during the first 60 cycles and then slowly declines in later stages, while the capacity in the medium-voltage D2 region remains stable with minor fluctuations throughout 100 cycles. The capacity in the high-voltage D3 region of N83 shows only brief initial growth followed by continuous decline in subsequent cycles. However, compared with N83-D1, the capacity growth cycle of N93-D1 is significantly shortened, exhibiting notable capacity decay after 30 cycles. Similarly, compared to N83, the capacity degradation in both D2 and D3 stages of N93 occurs significantly earlier and become more pronounced. Analogous trends are observed during charge processes (Fig. S6 in Supporting information). These results establish that the capacity variation of samples with the same nickel content in different voltage ranges is related to the electrochemical reactions at the corresponding voltages. The capacity activation originates from unique solid-solid interfacial dynamics in solid-state systems [39]. In contrast to liquid systems where the electrolyte and electrodes maintain sufficient contact, solid-state systems exhibit substantial interfacial impedance. This necessitates continuous interface activation through film formation during cycling to enhance ion transport [40]. Consequently, capacity gradually increases with interfacial optimization during cycling. The discharge capacity of the liquid system at different stages was treated similarly. As shown in Fig. S7 (Supporting information), the capacity of the liquid system at each stage decreases with cycling, further confirming that the aforementioned phenomenon is unique to the solid-state system. Simultaneous with reversible electrochemical reactions, irreversible side reactions occur, primarily involving the decomposition of PEO-based electrolytes, which accounts for the capacity fade during cycling [41]. As the voltage increases, the decomposition of PEO-based electrolytes intensifies, leading to an earlier onset of capacity degradation at higher voltages. Accelerated decomposition at elevated voltages manifests as earlier degradation onset in higher voltage segments (the cycle number of peak capacity: D1 > D2 > D3). Crucially, cross-comparison of N83 and N93 reveals that increased nickel content accelerates capacity degradation across all voltage ranges, indicating more severe electrolyte decomposition. This observation suggests that higher nickel content in the cathode material exacerbates the decomposition of PEO-based electrolytes, leading to premature capacity fade in solid-state battery systems.
Figure 2
Figure 2.
The corresponding dQ/dV profiles of (a) N83 and (b) N93 at different electrochemical cycles. Statistical results of discharge capacity in corresponding areas of (c) N83 and (d) N93 at different electrochemical cycles.
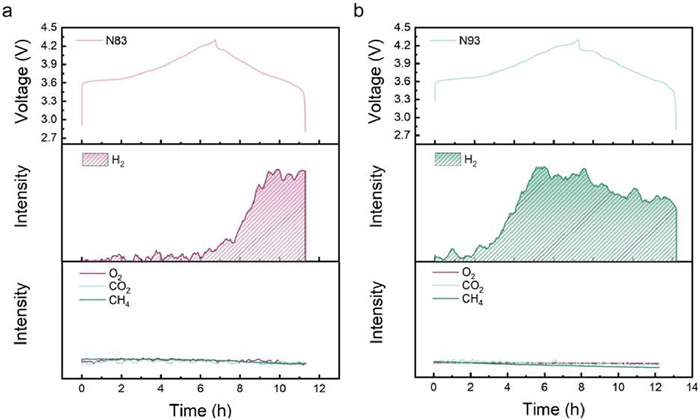
To further investigate the failure mechanisms of high-nickel cathode/PEO-based electrolyte systems, the gas evolution during operation was characterized, which directly impacts the overall safety performance of batteries [42]. Charge-discharge tests were conducted on N83 and N93 samples at 25 ℃ under 0.2 C rate while monitoring gas evolution. The results of in-situ differential electrochemical mass spectrometry (DEMS) are presented in Figs. 3a and b. The smooth charge-discharge curves confirm stable and normal operation of both N83 and N93 within the testing configuration. H2 generation is detected in both samples, albeit with distinct initiation patterns. In the low-nickel-content N83 sample, H2 evolution emerges near 4.1 V during charging, whereas N93 exhibits H2 detection commencing at the initial charging stage (~3.7 V). Contrasting with reported liquid electrolyte systems, partial pressures of O2, CO2, and CH4 remain stable throughout testing, with no other gaseous species detected beyond H2 [43]. The hydrogen evolution mechanism involves two sequential stages. Initially, oxidative decomposition and dehydrogenation of PEO occur at the cathode side, facilitated by electrochemical oxidation under high voltage and catalytic effects from high-nickel cathodes, concurrently forming HTFSI through interaction with lithium salt anions. Subsequently, HTFSI migrates to the anode and reacts with Li metal to produce H2 [44,45]. The premature H2 generation observed with increased nickel content demonstrates that higher nickel content in cathode materials exacerbates the catalyzed oxidative decomposition of PEO.
Figure 3
Figure 3.In situ DEMS data of (a) N83 and (b) N93 during first charge at 0.2 C in the voltage range of 2.8–4.3 V at 25 ℃.
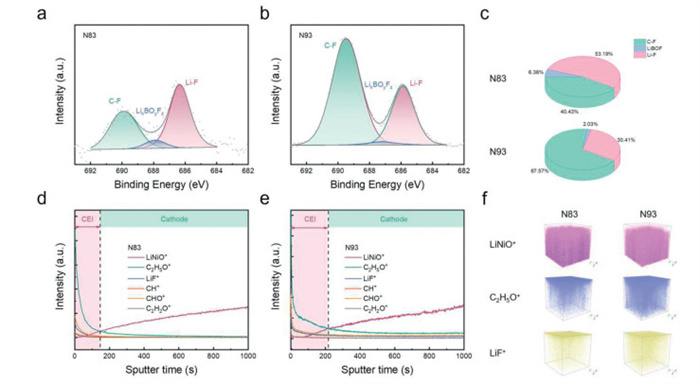
To systematically investigate the mechanism by which increased nickel content accelerates system degradation, cycled solid-state batteries with varying nickel-content cathodes were disassembled, and comprehensive characterization of cycled cathode/electrolyte interfaces, cathodes, electrolytes, and anodes were conducted, respectively. First, a series of analyses were performed to elucidate the surface chemical evolution at the cathode/electrolyte interface during extended cycling, focusing on the cathode-electrolyte interphase (CEI) development. Figs. 4a and b present the F 1s XPS spectra of cycled N83 and N93 cathodes, where peaks at 689.5, 687.9, and 686 eV correspond to C-F, LixBOyFz, and Li-F, respectively [46-48]. Quantitative integration of these peaks reveals distinct CEI compositions (Fig. 4c). The N83 CEI predominantly comprises inorganic components, with Li-F constituting 53.19% of the total. In contrast, the organic C-F component in N93 accounts for 67.57%, significantly exceeding the 40.43% observed in N83, indicating greater accumulation of electrolyte decomposition byproducts in the high-nickel sample. Furthermore, the higher LixBOyFz (derived from LiDFOB additive decomposition) content in N83 suggests more stable film-forming processes in low-nickel systems. Surface morphology characterization demonstrates that cathode particles with higher nickel content are covered by thicker CEI layers, confirming intensified electrolyte decomposition at elevated nickel content (Fig. S8 in Supporting information). This phenomenon is attributed to the abundance of Ni3+/Ni4+ species at high SOC, which induce more severe oxidative degradation of PEO. For precise CEI thickness comparison, time-of-flight secondary ion mass spectrometry (ToF-SIMS) was conducted on N83 and N93 cathodes. As shown in Figs. 4d–f, the intersection points of LiNiO+ (representing cathode materials) and C2H5O+ (representing CEI components) reveal substantially thicker CEI layers on N93 surfaces compared to N83.
Figure 4
Figure 4.
XPS spectra of F 1s for cycled (a) N83 and (b) N93. (c) The corresponding component content of F 1s. ToF-SIMS depth profiles of (d) N83 and (e) N93. (f) The corresponding 3D spatial distributions of the representative fragments.
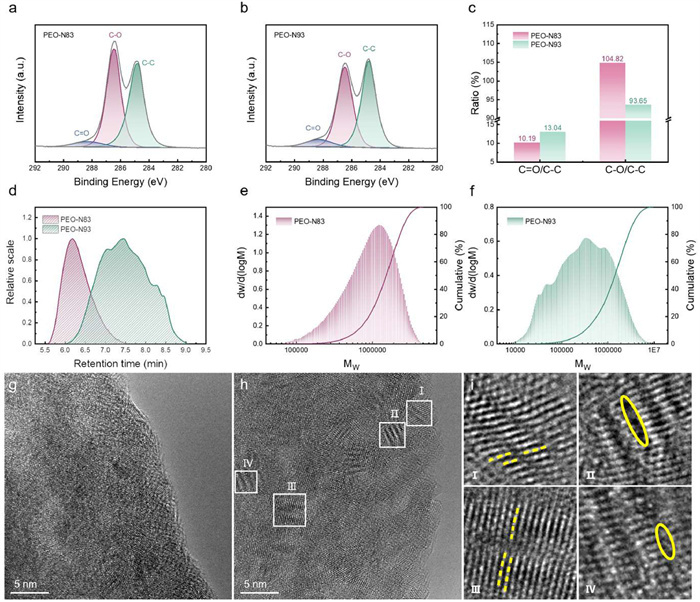
To further investigate the decomposition mechanisms of PEO when matched with ultra-high nickel cathode, cycled PEO-based electrolytes were systematically characterized. Figs. 5a and b present the XPS spectra of cycled PEO-based electrolytes paired with N83 and N93 cathodes, designated as PEO-N83 and PEO-N93, respectively. The characteristic peak at 288.2 eV corresponds to C═O, originating from the oxidation of PEO terminal groups (—OH) under 4 V operating voltage [49]. In this study, PEO with a molecular weight (MW) of 4,000,000 was employed to suppress the decomposition of unstable terminal groups, thereby reducing C═O content in both NCM-N83 and NCM-N93 systems. Notably, the C═O content in cycled PEO-N93 exhibits a marginal increase compared to PEO-N83. Additional peaks observed at 286.5 and 284.8 eV are assigned to C—O and C—C bonds, respectively, both constituting essential components of PEO polymer chains [50]. As illustrated in Fig. 5c, using stable C—C/C—H bonds as a reference, the C—O content in cycled PEO-N93 demonstrates significant reduction compared to PEO-N83, indicating accelerated decomposition of C—O bonds when coupled with high-nickel N93 cathodes. This is attributed to the increased nickel content, which enhances the oxidative properties of the cathode, catalyzing the chemical oxidation of C—O bonds in PEO, consistent with the characterization results of the CEI [49]. The cleavage of C—O bonds ultimately leads to polymer chain scission. To quantitatively assess PEO degradation, gel permeation chromatography (GPC) was performed on cycled electrolytes. The separation principle relies on differential permeation rates through gel-packed columns. Larger polymer molecules are excluded from gel pores and elute rapidly through interparticle voids, while smaller molecules penetrate micropores with delayed elution. Molecular weight distributions were determined through retention time calibration using standard samples [51]. Fig. 5d displays GPC elution profiles of cycled PEO-N83 and PEO-N93. The PEO-N93 peak exhibits longer retention time (7.45 min) compared to NCM-N83 (6.18 min), indicating lower MW for PEO-N93. Subsequent calibration reveals distinct MW distribution profiles. Statistical analysis shows average MW values of 1,145,822 and 658,729 for cycled PEO-N83 and PEO-N93, respectively (Figs. 5e and f). Although all PEO samples experience MW reduction after 100 cycles compared to pristine material (MW = 4,000,000), the significantly lower MW of PEO-N93 confirms enhanced chain scission induced by C—O bond decomposition in high-nickel systems. This MW deterioration compromises electrolyte mechanical integrity, identified as the primary cause of micro-short circuits in PEO-based SLMBs under high-voltage operation [24]. Supporting evidence from SEM characterization reveals more severe lithium deposition heterogeneity on anodes in Li|PEO|N93 cells (Fig. S9 in Supporting information). The aggravated PEO degradation in Li|PEO|N93 consequently diminishes dendrite suppression capability. Furthermore, continuous electrolyte decomposition promotes CEI layer thickening, which increases interface impedance and polarization, ultimately hindering interfacial Li+ transport kinetics.
Figure 5
Figure 5.
The XPS spectra of C 1s of PEO after 100 cycles with (a) N83 and (b) N93. (c) Relative content of corresponding components in the XPS spectra. (d) The GPC elution curves of cycled PEO. The MW distribution curve of PEO after 100 cycles with (e) N83 and (f) N93. High-resolution TEM images of particles acquired from cycled (g) N83 and (h) N93. (i) The corresponding FFT patterns of (h).
Subsequently, high-resolution transmission electron microscopy (HRTEM) was employed to gain in-depth insights into the surface species and structural evolution of cathode materials with varying nickel contents following cycling within the PEO-based solid-state electrolyte system. Fast Fourier transform (FFT) analysis was performed on selected regions, with corresponding crystallographic planes identified through precise measurements of interplanar spacings and angular relationships. As depicted in Figs. 5g–i, the N93 sample exhibits pronounced lattice irregularities, which are characterized by substantial lattice distortions and defect concentrations when compared to N83. This phenomenon is attributed to irreversible phase transformations from the layered structure to spinel and rock-salt configurations during prolonged cycling, where elevated nickel content is shown to significantly exacerbate structural degradation through accelerated phase instability [52].
In summary, this study employs ternary cathode materials with nickel contents ranging from 83% to 93% in combination with PEO-based electrolytes to systematically investigate the impact of nickel content on the electrochemical performance of PEO-based SSBs. The results demonstrate that optimizing nickel content enables effective balancing between energy density and cycle life in SSBs. Notably, we elucidate the intrinsic correlation between nickel content and the initial capacity increase during cycling, revealing that higher-nickel cathodes accelerate activation processes while low-voltage electrochemical reactions constitute the predominant source of capacity augmentation. Furthermore, ultrahigh-nickel cathodes are found to exacerbate mechanical degradation of PEO electrolytes, manifested through overcharging and micro-short circuit phenomena under high-voltage operation. DEMS analyses indicate that elevated nickel content catalytically promotes hydrogen evolution reactions, with TEM characterizations confirming concurrent structural deterioration in cathode materials. Particularly, through post-cycling recovery and GPC testing of PEO electrolytes, this work quantitatively evaluates the aggravated decomposition of polymeric electrolytes induced by high-nickel cathodes. The comprehensive analysis of failure mechanisms in high-nickel PEO-based SSBs, coupled with the established systematic research methodology, is anticipated to provide fundamental insights and evaluation frameworks for subsequent performance optimization in customized battery systems.
Declaration of competing interest
The authors declare that they have no known competing financial interests or personal relationships that could have appeared to influence the work reported in this paper.
This work was supported by the National Natural Science Foundation of China (No. 52122407), the Science and Technology Innovation Program of Hunan Province (No. 2022RC3048), and Fundamental Research Funds for Central Universities of the Central South University (No. 2021zzts0624). Financial support from BASF Shanshan Battery Materials Co., Ltd. was also acknowledged.
Supplementary materials
Supplementary material associated with this article can be found, in the online version, at doi:10.1016/j.cclet.2025.111157.
[1]
T. Ma, Q. Zhang, Y. Tang, et al., Renew. Sustain. Energy Rev. 204 (2024) 114806. doi: 10.1016/j.rser.2024.114806
C. Xu, P.J. Reeves, Q. Jacquet, C.P. Grey, Adv. Energy Mater. 11 (2021) 2003404. doi: 10.1002/aenm.202003404
Figure 1
(a) First-cycle charge-discharge voltage profiles at 0.1 C and (b) corresponding dQ/dV profiles. (c) Rate capability with different current densities of 0.1–2 C. (d) Cycling performances at 0.5 C and (e) corresponding Coulombic efficiency. Charge-discharge voltage profiles at 0.5 C during the 96th–100th cycles of (f) N83 and (g) N93.
Figure 2
The corresponding dQ/dV profiles of (a) N83 and (b) N93 at different electrochemical cycles. Statistical results of discharge capacity in corresponding areas of (c) N83 and (d) N93 at different electrochemical cycles.
Figure 4
XPS spectra of F 1s for cycled (a) N83 and (b) N93. (c) The corresponding component content of F 1s. ToF-SIMS depth profiles of (d) N83 and (e) N93. (f) The corresponding 3D spatial distributions of the representative fragments.
Figure 5
The XPS spectra of C 1s of PEO after 100 cycles with (a) N83 and (b) N93. (c) Relative content of corresponding components in the XPS spectra. (d) The GPC elution curves of cycled PEO. The MW distribution curve of PEO after 100 cycles with (e) N83 and (f) N93. High-resolution TEM images of particles acquired from cycled (g) N83 and (h) N93. (i) The corresponding FFT patterns of (h).


 DownLoad:

 下载:
下载:


 下载:
下载:
