
Scheme 1.
Schematic overview of the FTYc_UV strategy for comprehensive RBPs characterization by MS.
A dual-crosslinking and thiol-yne "click reaction"-based tagging method for mouse liver RNA binding proteome enrichment and identification by mass spectrometry
Tong Liu , Youdong Xu , Yajie Jiao , Jinguo Zhao , Bin Fu , Xianyu Li , Hongjun Yang , Weijie Qin

RNA-binding proteins (RBPs) play a vital role in various stages of the RNA lifecycle, including but are not limited to transcription, translation and decay [1-3]. Conversely RNA also influences the activity of RBPs [4]. An increasing number of studies have revealed that the interaction between RNAs and RBPs within dynamic ribonucleoproteins (RNPs) is essential for regulating biological functions, such as post-transcriptional gene expression processes and stress responses [5-7]. Malfunctions in RBPs are associated with a range of diseases, including neurological disorders, muscular atrophies and cancer [8-11]. Given their regulatory significance, systematic exploration of RBPs has become increasingly important to elucidate their roles in regulating physiological homeostasis and disease state.
Considering the weak and dynamic nature of RNA-RBP interactions, in situ crosslinking by UV irradiation is necessary to fix the native composition of RNA-protein complexes (RPCs) before subsequent analysis. Currently, numerous methods are available for cellular level profiling of RPCs via combining 254 nm UV irradiation crosslinking and various RPCs enrichment methods, such as poly-(A) tail of mRNA (RIC) [12-15], metabolic alkynyl uridine analog labeling (CARIC) [16,17], phase separation (OOPS) [18-20], chemical probe labeling [21,22], and APEX-mediated proximity labeling (APEX-PS) [23]. These methods have been broadly utilized for systematically identifying RNA bound proteome in cell lines. Although cell lines are the basic functional units of organisms and essential tools for biological and clinical studies [24], they cannot fully reflect the heterogeneity and complexity present in actual tissue samples or tumor microenvironment [25,26]. Exploring RBPs in tissue samples provides insights closer to the real physiological environment and allow a more accurate understanding of the relationship between disease and RBPs. However, due to the limited penetration of UV light in tissue samples [27,28], it is highly challenging to apply the above methods in studying RPCs in mammalian organs. As an alternative, formaldehyde, a cell and tissue permeable, rapid, and reversible crosslinker, can be used to fix the interactions between RNA and proteins in mammal tissues. Attempts have been made to use formaldehyde to crosslink crude RNA-protein complexes (cRPCs), which include RNA, RBPs that directly binding RNA and non-RBPs that binding RBPs, in cells, such as crosslink-assisted mRNP purification (CLAMP) method [29,30] and comprehensive identification of RNA-binding proteins by mass spectrometry (ChIRP-MS) method [31]. Unfortunately, formaldehyde crosslinks not only RNA and protein, but also protein and protein [32,33], resulting in inclusion of non-RBPs. Therefore, in situ crosslinking strategies compatible with tissue samples with high specificality is still highly demanded for RPCs profiling.
Furthermore, for large scale RBPs analysis, selective enrichment and separated them from non-RBPs is needed. Despite significant efforts in developing RBPs enrichment methods over the past decade, there are still limitations that need to be addressed. RIC primarily focuses on identifying proteins that interact with mRNA, neglecting RBPs binding non-poly(A) RNAs. OOPS may be interfered by glycoproteins due to their similar solubility with RPCs. Chemical probe labeling-based method requires the introduction of chemical probes into living cells, which may generate toxicity and nonspecific binding. APEX-PS requires using genetically engineered mice. CARIC combined metabolic labeling of RNA using alkynyl uridine analog with azide alkyne cycloaddition (CuAAC) click reaction for RBPs enrichment and identification. Click chemistry is an immensely powerful technique, known for its simplicity, speed and efficiency in nucleic acid applications [34]. However, a growing body of evidence suggests that the presence of copper in CuAAC deteriorates RNA integrity and hampers downstream applications [35-37]. Therefore, it is of great significance to develop a metal-free click chemistry strategy for highly specific RNA labeling and efficient RPCs enrichment for proteome-wide RBPs profiling in mammal organs.
Here, we reported an unbiased method, which integrated a dual crosslinking with formaldehyde and UV irradiation, metabolic labeling and metal-free thiol-yne click reaction to achieve in-situ crosslinking of RNA and RBPs, specific enrichment and large-scale identification of RBPs in mouse liver, called FTYc_UV (Scheme 1). In FTYc_UV, RNA in mouse liver is first metabolically labeled with an alkyne uridine analog (5-ethynyluridine, EU). Formaldehyde, known for its high tissue permeability is introduced to mouse liver via perfusion to fix the cRPCs in situ. Following tissue homogenization, metal-free thiol-yne click reaction (TYC) is employed to tag the alkyne uridine of all types of RNAs with a biotin handle, facilitating RPCs enrichment without the risk of RNA degradation by metal toxicity. After specifically crosslinking the RBPs and RNA in the cRPCs via 254 nm UV irradiating in the tissue lysate, covalent bonds formed by formaldehyde are dissociated by heating and the non-RBPs are removed from the cRPCs for specific RBPs identification by mass spectrometry analysis. This approach not only overcomes the challenge of poor UV penetration and low efficiency in crosslinking of RNA and RBPs at the tissue level, but also addresses the issues of poor selectivity and high false positive rate of RBPs identification associated with formaldehyde crosslinking. The radical-mediated thiol-yne reaction, a type of metal-free click chemistry, can be directly initiated by 365 nm UV irradiation in the presence of a photo-inducible radical initiator with high efficiency. The reaction has been successfully applied to the construction of highly functional macromolecules and modification of polymers [38,39]. In addition to RNA compatible, the approximately 30 times higher reaction rate than CuAAC makes the metal-free thiol-yne reaction particularly advantageous for rapid RPCs enrichment, thereby further reducing RNA degradation. The FTYc_UV method was successfully applied in the large-scale enrichment of RBPs from mouse liver. In total, 1671 RBPs were identified with high-confidence, covering 75% of previously reported RBPs, demonstrating the high performance of FTYc_UV. Additionally, 420 low-abundant candidate RBPs were discovered, highlighting the sensitivity of this method.
In this work, the mouse liver was metabolically labeled with EU and crosslinked using formaldehyde. The tissue lysate was tagged with biotin through a thiol-yne click reaction, irradiated with 254 nm UV, and the formaldehyde crosslinking was dissociated by heating. Subsequently, the liver RBPs were enriched and identified by mass spectrometry analysis. The detailed experimental materials were in "Experimental section" in Supporting information. The mice protocol was approved by the Institutional Animal Care and Use Committee at the Beijing Proteome Research Center (Ethic No. IACUC-20220705–75 MB).
Although successful alkyne uridine analog (EU) labeling in RNA at the cellular level was previously reported [16,17,40], to determine whether EU can be used for in situ tissue metabolic RNA labeling, living mice were intraperitoneal injected with 6 mg of EU. The mouse livers were collected at 1, 5 and 24 h time points after injection. Liver sections were subsequently stained with Cy5-N3 via CuAAC and imaged by confocal fluorescence microscopy (Fig. 1). Tissue without EU injection and incubation showed very low background staining. In contrast, strong red fluorescence was observed after 1 h EU labeling and could be sustained for 24 h, indicating high in situ tissue tagging efficiency of EU. Furthermore, the alkyne-labeled RNAs were extracted from the mouse livers and reacted with N3-biotin via CuAAC for biotinylation. Dot blotting analysis via streptavidin staining showed clear RNA band which was completely abolished upon RNase digestion, further demonstrating successful in situ tissue RNA labeling by EU (Fig. S1a in Supporting information). Alkyne-labeled RNAs were extracted from the mouse heart after 1 h EU labeling and further reacted with N3-biotin via CuAAC for biotinylation. The RNAs were analyzed by dot blotting via streptavidin staining. As shown in Fig. S1b (Supporting information), clear spot of the alkyne-RNA was observed after 1 h EU labeling compared to that without EU incubation, demonstrating the versatility of this method for other organs. The above results illustrated that EU is capable of metabolic RNA labeling in living mice in 1 h to support subsequent thiol-yne click reaction to introduce biotinylation and enrich RPCs.

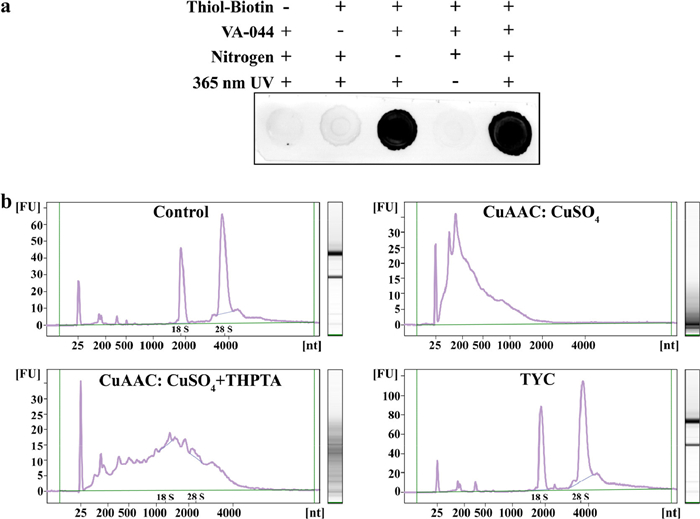
To evaluate tagging efficiency of the thiol-yne click reaction, two small molecules, 5-hexynoic acid (5-HA) and cysteine were first used. The reaction was carried out in PBS with a water-soluble initiator, VA-044 and 365 nm UV light. Mass spectrometry analysis showed two major peaks corresponding to different irradiation times. Longer irradiation resulted in a progressive disappearance of the intermediate, and an increase of the bis-addition products (Fig. S2 in Supporting information). This result suggests that the thiol-yne reaction allows addition of two thiols to an alkyne. The first thiol addition to the alkyne forms an intermediate thiol-alkene (Product 1), followed by a second thiol conjugation to yield bis-addition products (Product 2). To test the feasibility of biomacromolecule tagging using thiol-yne reaction, cytochrome C was chosen as a model. It was first reacted with N-hydroxysuccinimide ester-alkyne (NHS-alkyne) to introduce alkyne groups. The resulting alkyne adduct (alkyne-cytochrome C) was then derivatized with cysteine via the thiol-yne reaction under various UV exposure time. Subsequent MS analysis showed the main product peak shifting to a higher mass range as the irradiation time increased, indicating that more cysteine was attached to the alkyne-cytochrome C (Fig. S3 in Supporting information). Next, we evaluated the enrichment selectivity of thiol-yne reaction using a mixture of alkyne-cytochrome C and two standard proteins (BSA and Albumin) in varying mass ratios. Clear alkyne-cytochrome C bands were observed after enrichment through the thiol-yne reaction in Fig. S4a (Supporting information). To further assess the selectivity of the thiol-yne reaction, a mixture of alkyne-cytochrome C and HeLa lysates in different mass ratios were prepared to mimic a real complex sample. Gel electrophoresis showed distinct alkyne-cytochrome C bands after pull-down, even when highly excessive lysates were used (Fig. S4b in Supporting information). These results demonstrate that specific thiol-yne reaction enriches alkyne-cytochrome C, rather than relying on nonspecific adsorption. Considering our method relies on specific RNA labeling to capture RPCs, we focused on performing the thiol-yne reaction to RNA to introduce biotin handles for enrichment. Alkyne-labeled RNAs were extracted from HeLa cells metabolically labeled with an alkyne-containing uridine analog, EU. The obtained alkyne-RNAs were further derivatized with thiol-biotin via the thiol-yne reaction and visualized through dot blot analysis. As revealed in Fig. 2a, the resulting biotinylated RNA displayed a strong signal. In contrast, omitting either thiol-biotin, initiator (VA-044), or 365 nm UV resulted in barely detectable RNA signals, indicating the thiol-yne reaction cannot proceed and the biotin cannot be incorporated into RNA without these conditions. In parallel, we compared the performance of the two click reaction, CuAAC and thiol-yne reaction, using alkyne-labeled RNAs as model compound. The thiol-yne reaction exhibited higher biotinylated yield after only 2 min incubation, approximately 30 times faster than CuAAC, which typically requires 60 min (Fig. S5 in Supporting information). Furthermore, the integrity of RNA after alkyne labeling and click reaction was characterized by 2100 bioanalyzer, respectively. Alkyne-labeled RNA, as a control, showed no apparent RNA degradation. Adding CuSO4 caused significant rupture of RNA into small fragments. Although the introduction of THPTA could alleviate this effect, the CuAAC reaction still resulted in obvious RNA degradation, as evidenced by smeared gel bands. On the contrary, in agreement with the result of the control, thiol-yne reaction did not damage RNA and preserved RNA integrity with clear 18 S and 28 S bands in the gel (Fig. 2b). In summary, we demonstrated the specificity and efficiency of the thiol-yne reaction for RNA labeling. Importantly, unlike other click reaction, this simple one-pot thiol-yne reaction opens up a new platform for lossless RNA labeling, laying the groundwork for the large-scale enrichment of PRCs.
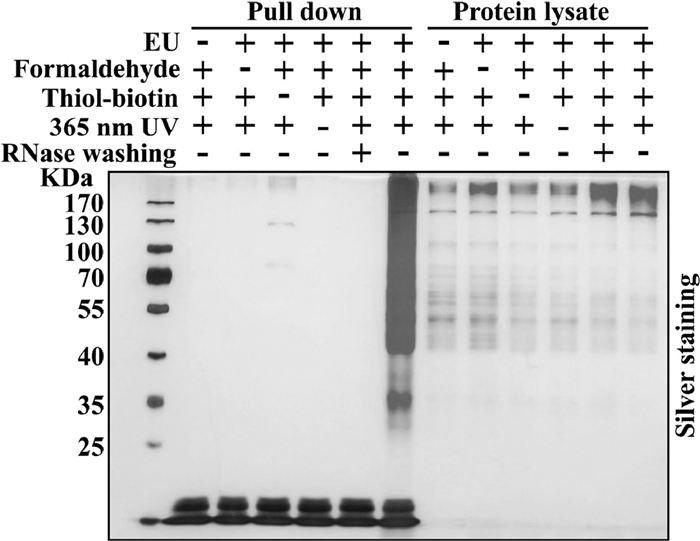
The success of FTYc_UV and efficient enrichment of RPCs depends on the degree of formaldehyde crosslinking. Low concentrations of formaldehyde may lead to incomplete fixation, resulting in fewer crosslinked complexes. while excessive formaldehyde may induce protein aggregation and loss of RPCs. To optimize the crosslinking condition, a series of formaldehyde concentrations (0.05%, 0.1%, 0.3%, 0.5%, 1%, w/v) were evaluated. We performed Western blot analysis for the crosslinked ELAV-like protein 1 (ELAVL1), a known RBP (Fig. S6a in Supporting information). The total amount of ELAVL1 in the supernatant started to decrease significantly at 0.3% formaldehyde, which may be attributed to the over-crosslinking induced protein precipitation. To avoid interference from free thiol groups in the cells, N-ethylmaleimide (NEM) was introduced to cells to block the endogenous free thiol groups before thiol-yne reaction to introduce biotin. Almost no free thiol groups were found after 200 mmol/L NEM treatment (Fig. S6b in Supporting information). This reaction was conducted after formaldehyde crosslinking, so RNA and RBPs were fixed beforehand and RNA-RBPs interactions were not affected by NEM. Based on these findings, we also screened three formaldehyde concentrations (0.05%, 0.1%, 0.3%) for cRPCs enrichment. RNAs were firstly metabolized labeling with EU. After treating with formaldehyde to obtain the crosslinked cRPCs, the RNAs were further tagged with biotin via the thiol-yne click reaction in lysate. Excess VA-044 and thiol-biotin were removed by Tris-HCl using ultracentrifugal filter unit to avoid potential side reactions. The crosslinked cRPCs with biotin tags were next captured by streptavidin beads, and were eluted for SDS-PAGE analysis. The cRPCs were most efficiently enriched at 0.05% formaldehyde compared to 0.1% or higher (Fig. S6c in Supporting information). Therefore, 0.05% formaldehyde was chosen for subsequent FTYc_UV experiments. Next, the optimized cRPCs enrichment was obtained using thiol-biotin and initiator (VA-044) at a 10:1 molar ratio and 2 min 365 nm UV irradiation, as revealed by the strongest protein bands in the gel (Fig. S7 in Supporting information). With the optimal experimental conditions established, we focused on the enrichment and characterization of cRPCs from mouse liver. SDS-PAGE analysis (Fig. 3) exhibited a diverse array of cRPCs bands only existing with all the conditions met, including EU, formaldehyde, thiol-biotin and 365 nm UV. Missing any of the above conditions yielded only marginal nonspecific bands, indicating their necessity for RNA-protein crosslinking, RNA labeling and cRPCs enrichment. Correspondingly, when the enriched cRPCs were treated with RNase washing before elution, the enriched bands were almost completely abolished, confirming the RNA dependence of the cRPCs enrichment.
Although formaldehyde-based crosslinking fixes the interaction between proteins-proteins and RNAs-proteins and has the limitation in discriminating between RBPs and non-RBPs, it can be reversed by heating at 65 ℃ [41-43]. Leveraging this property, we hypothesized that combining formaldehyde with 254 nm UV crosslinking could enable specific enrichment of RBPs. Considering the instability of RNA, we first investigated the RNA integrity using different incubation time at 65 ℃. The liver RNA was heated at 65 ℃ for different time and characterized by 2100 bioanalyzer. Smeared RNA bands were discovered after 2 h heating or longer, indicating severe RNA degradation (Fig. S8a in Supporting information). Since only minor RNA degradation was observed after 1 h heating at 65 ℃, this condition was chosen to avoid large-scale disassociation of the RNA-protein interactions. We next evaluated the feasibility of the FTYc_UV strategy for RBPs capturing from mouse liver. After metabolic labeling with EU and crosslinking with formaldehyde to in situ fix the cRPCs in mouse liver, the livers were homogenized and the alkyne tagged cRPCs in the tissue lysate were further labeled with biotin handles through thiol-yne click reaction. After efficient 254 nm UV crosslinking of the RNA and RBP in the cRPCs in the tissue lysate, formaldehyde de-crosslinking was conducted by heating to remove the non-RBPs. Finally, the RPCs were captured by streptavidin beads and further characterized by SDS-PAGE after eluting the beads-captured RBPs by RNase treatment. As shown in Fig. S8b (Supporting information), proteins bands were barely observed after 65 ℃ for 1 h without UV crosslinking, indicating completely formaldehyde de-crosslinking. Once introducing 254 nm UV before heating, protein bands appeared again, but with much less intensity compared to the cRPCs without heating and 254 nm UV, indicating removal of non-RBPs by de-crosslinking and washing and enabling more specific identification of RBPs in mouse liver. We applied 254 nm UV treatment to crosslink RNA and RBP before 65 ℃ heating, therefore the interactions between RNA and RBP were preserved by UV crosslinking and the protein-protein interaction induced by formaldehyde crosslinking were removed by 65 ℃ heating. It offers a valuable way to address the long-standing problem of low crosslinking specificity of formaldehyde. To further demonstrate the successful enrichment of the RBPs, besides ELAVL1, known RBPs such as nucleolin (NCL), heterogeneous nuclear ribonucleoproteins A2/B1 (HNRNPA2B1) and nucleolysin TIAR (TIAL1) were also tested. As shown in Fig. S8c (Supporting information), corresponding clear protein bands were observed after FTYc_UV enrichment and were depleted by RNase A treatment, confirming the RNA dependence of FTYc_UV enrichment. Two known non-RBPs, ACTB and α-TUBULIN were also tested and no obvious protein bands were found in the enriched samples, proving the high selectivity of the FTYc_UV.
To further demonstrate the advantages of our FTYc_UV strategy, enriched RBPs obtained by tandem crosslinking of in situ formaldehyde treatment and 254 nm UV at protein lysate level was compared with that only 254 nm UV treatment at the bulk tissue level. Almost no protein band was discovered from the enrichment products of 254 nm UV treatment at bulk liver level in Fig. S9a (Supporting information). In contrast, clear enriched RBPs were seen using FTYc_UV. Similarly, ELAVL1, a known RBP, was apparently enriched using FTYc_UV by UV crosslinking at the tissue lysate instead of bulk tissue level (Fig. S9b in Supporting information). Moreover, to evaluate the effect of 254 nm irradiation post-formaldehyde treatment, we compared the RBPs enriched by tandem crosslinking by in situ formaldehyde treatment and 254 nm UV at protein lysate level to that only using 254 nm UV treatment at protein lysate level. Distribution of the enriched RBPs has no apparent difference by the two crosslinking methods (Fig. S9c in Supporting information), demonstrating of the key role of 254 nm UV in crosslinking of RNA and RBP.
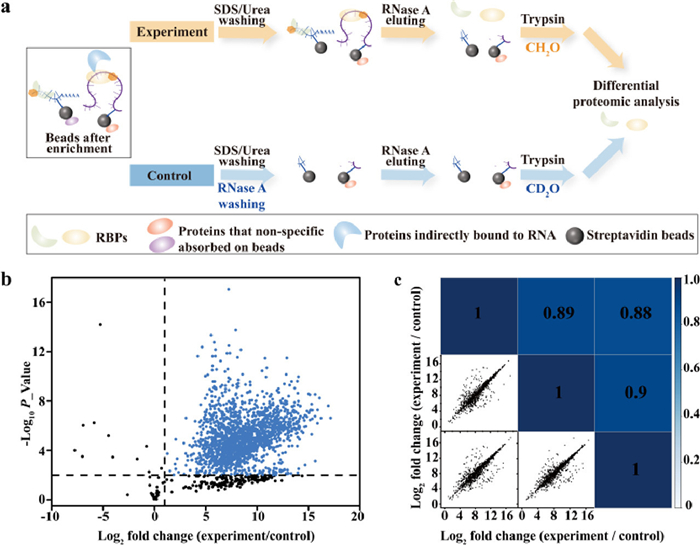
After establishing the optimized workflow for FTYc_UV, we applied it in large-scale RBPs identification in mammalian tissue. To obtaining credible RBPs, it is critical to discriminate and remove the nonspecific on-beads adsorption from the enrichment products. Therefore, we established a MS-based quantitative differential analysis procedure (Fig. 4a). In this procedure, we used RNase A washed beads (after RPC enrichment) as a stringent control for screening high-confidence RBPs, since only non-specifically adsorbed non-RBPs were left on the beads after RNase A washing. In contrast, all RBPs were left on beads when SDS and urea washing was applied instead in the experiment group, which can be further released by RNase A elution for subsequent MS analysis. After trypsin digestion, peptides from the experiment and control group were "light" and "medium" labeled, by stable isotope dimethyl labeling [44] and mixed for LC-MS/MS analysis. Next, we conducted quantitative differential proteomic profiling between the experiment and the control groups. A total of 1671 liver proteins passed the stringent filtering criteria (fold change > 2 and P_value < 0.01 with no fewer than two unique peptides in at least two tests) and were defined as high confidence RBPs (Fig. 4b and Table S1 in Supporting information). Quantitative results of the RBPs between technical replicates exhibited high consistency (Pearson correlation > 0.88), suggesting overall good reproducibility of the FTYc_UV (Fig. 4c).
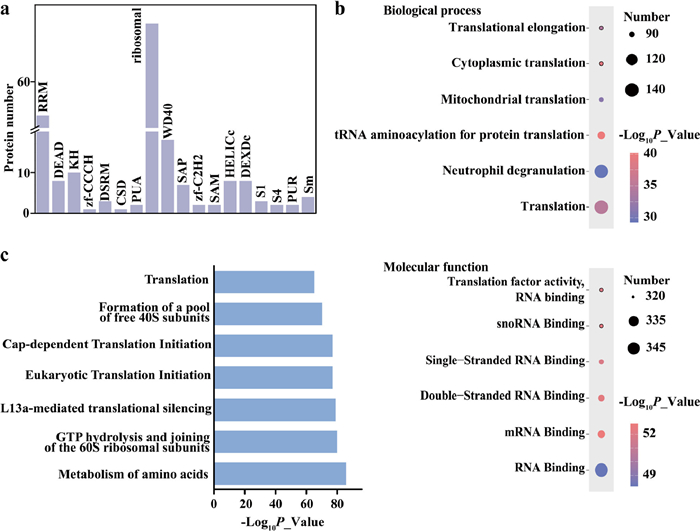
To determine the representative features of the RNA interactome, we analyzed the RNA binding domains (RBD) of identified RBPs (Fig. 5a). Our dataset included not only classical RBD (RRM, DEAD, KH) but also nonclassical RBDs, such as ribosomal, WD40 and SAP. Gene ontology (GO) analysis of RBPs in Fig. 5b showed that various RNA-binding terms were significantly over-represented in molecular function category, including coding and non-coding RNA, indicating FTYc_UV achieves unbiased enrichment and identification of RBPs. Additionally, distinctly enriched GO terms related to RNA were also observed in biological process category, such as "translation", "mitochondrial translation" and "cytoplasmic translation" indicating that the dataset encompassed a large number of known RBPs. By contrast, GO analysis of the enrichment product of cRPCs with only formaldehyde crosslinking but without UV irradiation and heat de-crosslinking showed fewer enriched GO terms related to RNA, but enriched terms associated with chromatin and protein binding (Fig. S10 in Supporting information), further demonstrating the necessity of UV irradiation and heating for specific RBPs enrichment. Consistently, pathway analysis (Fig. 5c) further supported RNA association of the identified RBPs, with terms predominantly related to RNA, such as joining of ribosomal subunit and translation initiation. Interestingly, the term involved in metabolism was also remarkably enriched, aligning with growing evidence that RNA binds to metabolic enzymes, thereby responding to metabolite levels and regulating expression of the bound RNA [45].
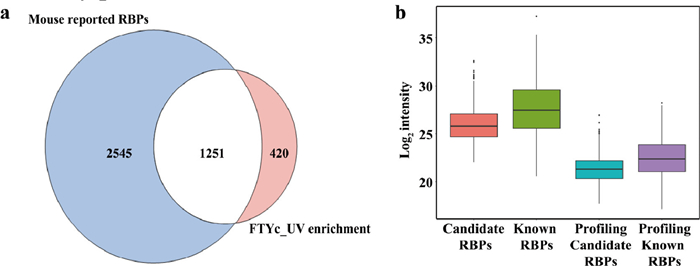
In comparison to the integrated atlas of the reported RBPs derived from mouse (Table S2 in Supporting information) [4,16,46-57], 75% of the 1671 mouse liver RBPs identified by FTYc_UV was reported in previously published works as mouse RBPs, validating the efficiency of FTYc_UV. The reported RBPs were identified in mouse embryonic fibroblasts, embryonic stem cells, HL-1 cells, RAW264.7 cells, mIMCD-3 cells and mouse undifferentiated spermatogonia. However, we identified RBPs from mouse liver, primarily from parenchymal cells. Therefore, some RBPs may not have been identified due to differences in cell composition. Hentze's group also identified over 1800 RBPs in mouse brain, kidney and liver [55]. The number of RBPs is similar to our method. Furthermore, to obtain high-confident RBPs, we used heat treatment at 65 ℃ for formaldehyde decrosslinking, which may result in minor RNA degradation and false negative RBPs identifications. FTYc_UV uncovered 420 candidate RBPs that had not been detected in previous mouse RBP profiling efforts (Fig. 6a, Table S3 in Supporting information). Compared with the known RBPs identified by FTYc_UV, the 420 candidate RBPs showed notably lower abundance distribution, which was similarly observed in total proteome profiling, suggesting the superior sensitivity of FTYc_UV (Fig. 6b). Further pathway analysis revealed that the 420 candidate RBPs included 151 metabolism related proteins distributed across various metabolic pathways, such as citric acid cycle, lipid and amino acid metabolism (Fig. S11 in Supporting information). In summary, these candidate RBPs effectively expanded the existing RBPs database and may provide data for future research.
In conclusion, we successfully demonstrated that the FTYc_UV method can in-situ crosslinking and specifically enrich the RBPs in mouse liver. We proved that thio-yne reaction is more suitable for lossless RNA compared to CuAAC. 1671 high-confidence RBPs from mouse liver, including 420 low abundance candidate RBPs, were obtained by FTYc_UV. The advantages of FTYc_UV include the following points. (1) The FTYc_UV method is capable of in situ crosslinking, efficiently and specifically enriching the RNA binding proteome in mouse liver, offering both sensitivity and accuracy. (2) The combination of formaldehyde and UV irradiation not only overcomes the challenge of poor UV penetration and low efficiency in crosslinking of RNA and RBPs at the tissue level, but also addresses the issues of poor selectivity of RBPs identification associated with formaldehyde crosslinking. (3) Metal-free and biocompatible thiol-yne click reaction is suitable for lossless RNA labeling, facilitating comprehensive enrichment and identification of RPCs. Although the FTYc_UV method has been successfully applied to enrichment and identification of RBPs in mouse liver, it still has limitation. The uridine analogs for RNA metabolic labeling may reduce the viability of cells, interfere the RNA and RBPs interactions and preferentially incorporate into newly transcribed RNA, causing potentially false positives and false negatives in RBPs identification. This limitation can be addressed by employing various enrichment methods, such as poly(A)-based [12], phase separation-based [18] and chemical probe labeling-based [21] methods. A thorough investigation on RBPs enrichment via combining the dual crosslinking strategy with these different enrichment methods may further improve RBPs identification in tissue samples and will be conducted in the future work. Finally, we expect the FTYc_UV method can be applied to enrich and identify RNA binding proteome in various mammal tissues in the future, offering a reliable way to facilitate deciphering the function of RBPs in human health and disease.
The authors declare that they have no known competing financial interests or personal relationships that could have appeared to influence the work reported in this paper.
Tong Liu: Writing – original draft, Methodology, Investigation. Youdong Xu: Investigation. Yajie Jiao: Visualization. Jinguo Zhao: Investigation. Bin Fu: Investigation. Xianyu Li: Resources. Hongjun Yang: Funding acquisition, Conceptualization. Weijie Qin: Writing – review & editing, Funding acquisition, Conceptualization.
Thanks to the financial support from the National Key R&D Program of China (No. 2021YFA1302604), Scientific and technological innovation project of China Academy of Chinese Medical Sciences (No. CI2021B017) and China Postdoctoral Science Foundation (No. 2023T160727).
Supplementary material associated with this article can be found, in the online version, at doi:
S.F. Mitchell, R. Parker, Mol. Cell 54 (2014) 547–558.
G. Singh, G. Pratt, G.W. Yeo, et al., Ann. Rev. Biochem. 84 (2015) 325–354.
Y.Y. Chen, Z. Gui, D. Hu, et al., Chin. Chem. Lett. 35 (2024) 108522.
M.W. Hentze, A. Castello, T. Schwarzl, et al., Nat. Rev. Mol. Cell Biol. 19 (2018) 327–341.
S. Gerstberger, M. Hafner, T. Tuschl, Nat. Rev. Genet. 15 (2014) 829–845.
T. Feng, Y.L. Gao, D. Hu, et al., Chin. Chem. Lett. 35 (2024) 109259.
W.B. Tao, N.B. Xie, Q.Y. Cheng, et al., Chin. Chem. Lett. 34 (2023) 108243.
F. Gebauer, T. Schwarzl, J. Valcárcel, et al., Nat. Rev. Genet. 22 (2021) 185–198.
J.B. Bertoldo, S. Müller, S. Hüttelmaier, Drug Discov. Today 28 (2023) 103580.
Q. Zeng, S. Saghafinia, A. Chryplewicz, et al., Science 378 (2022) eabl7207.
K. Shi, X. Hong, D. Xu, et al., Chin. Chem. Lett. 36 (2025) 110079.
A. Castello, B. Fischer, K. Eichelbaum, et al., Cell 149 (2012) 1393–1406.
A.G. Baltz, M. Munschauer, B. Schwanhäusser, et al., Mol. Cell 46 (2012) 674–690.
B.M. Beckmann, R. Horos, B. Fischer, et al., Nat. Commun. 6 (2015) 10127.
A.M. Matia-González, E.E. Laing, A.P. Gerber, Nat. Struct. Mol. Biol. 22 (2015) 1027–1033.
X. Bao, X. Guo, M. Yin, et al., Nat. Methods 15 (2018) 213–220.
R. Huang, M. Han, L. Meng, et al., Proc. Natl. Acad. Sci. U. S. A. 115 (2018) E3879–E3887.
R.M. Queiroz, T. Smith, E. Villanueva, et al., Nat. Biotechnol. 37 (2019) 169–178.
J. Trendel, T. Schwarzl, R. Horos, et al., Cell 176 (2019) 391–403. e319.
E.C. Urdaneta, C.H. Vieira-Vieira, T. Hick, et al., Nat. Commun. 10 (2019) 990.
Z. Zhang, T. Liu, H. Dong, et al., Nucleic Acids Res. 49 (2021) e65 -e65.
H. Sun, B. Fu, X. Qian, et al., Nat. Commun. 15 (2024) 852.
W. Qin, S.A. Myers, D.K. Carey, et al., Nat. Commun. 12 (2021) 4980.
J. Yang, Y. Xu, Chin. Chem. Lett. 33 (2022) 2799–2806.
K. Yu, B. Chen, D. Aran, et al., Nat. Commun. 10 (2019) 3574.
A.F. Jarnuczak, H. Najgebauer, M. Barzine, et al., Sci. Data 8 (2021) 115.
R.P. Elinson, P. Pasceri, Development 106 (1989) 511–518.
V.O. Sysoev, B. Fischer, C.K. Frese, et al., Nat. Commun. 7 (2016) 12128.
A.T. LaPointe, N.N. Gebhart, M.E. Meller, et al., J. Virol. 92 (2018) e02171-17.
N.N. Gebhart, R.W. Hardy, K.J. Sokoloski, PLoS One 15 (2020) e0238254.
R.A. Flynn, J.A. Belk, Y. Qi, et al., Cell 184 (2021) 2394–2411 e2316.
T. Tayri-Wilk, M. Slavin, J. Zamel, et al., Nat. Commun. 11 (2020) 3128.
D.S. Johnson, A. Mortazavi, R.M. Myers, et al., Science 316 (2007) 1497–1502.
N.Z. Fantoni, A.H. El-Sagheer, T. Brown, Chem. Rev. 121 (2021) 7122–7154.
D.C. Kennedy, C.S. McKay, M.C. Legault, et al., J. Am. Chem. Soc. 133 (2011) 17993–18001.
M.K. Singha, J. Zimak, S.R. Levine, et al., Biochemistry 61 (2022) 2638–2642.
M. Gupta, S.R. Levine, R.C. Spitale, Acc. Chem. Res. 55 (2022) 2647–2659.
R. Hoogenboom, Angew. Chem. Int. Ed. 20 (2010) 3415–3417.
J. Kaur, M. Saxena, N. Rishi, Bioconjugate Chem. 32 (2021) 1455–1471.
C.Y. Jao, A. Salic, Proc. Natl. Acad. Sci. U. S. A. 105 (2008) 15779–15784.
E.A. Hoffman, B.L. Frey, L.M. Smith, et al., J. Biol. Chem. 290 (2015) 26404–26411.
V. Jackson, Cell 15 (1978) 945–954.
M.F. Carey, C.L. Peterson, S.T. Smale, Cold Spring Harb. Protoc. 2009 (2009) prot5279 pdb.
P.J. Boersema, R. Raijmakers, S. Lemeer, et al., Nat. Protoc. 4 (2009) 484–494.
A. Castello, M.W. Hentze, T. Preiss, Trends Endocrinol. Metab. 26 (2015) 746–757.
J. Boucas, C. Fritz, A. Schmitt, et al., PLoS One 10 (2015) e0125745.
S.C. Kwon, H. Yi, K. Eichelbaum, et al., Nat. Struct. Mol. Biol. 20 (2013) 1122–1130.
Y. Liao, A. Castello, B. Fischer, et al., Cell Rep. 16 (2016) 1456–1469.
A. Liepelt, I.S. Naarmann-de Vries, N. Simons, et al., Mol. Cell. Proteomics 15 (2016) 2699–2714.
M. Ignarski, C. Rill, R.W. Kaiser, et al., J. Am. Soc. Nephrol. 30 (2019) 564–576.
G. Du, X. Wang, M. Luo, et al., Development 147 (2020) dev184655.
C. He, S. Sidoli, R. Warneford-Thomson, et al., Mol. Cell 64 (2016) 416–430.
A.L. Mallam, W. Sae-Lee, J.M. Schaub, et al., Cell Rep. 29 (2019) 1351–1368. e1355.
Y. Na, H. Kim, Y. Choi, et al., Nucleic Acids Res. 49 (2021) e28 -e28.
J.I. Perez-Perri, D. Ferring-Appel, I. Huppertz, et al., Nat. Commun. 14 (2023) 2074.
K.B. Cook, H. Kazan, K. Zuberi, et al., Nucleic Acids Res. 39 (2010) D301–D308.
M. Caudron-Herger, R.E. Jansen, E. Wassmer, et al., Nucleic Acids Res. 49 (2021) D425–D436.

Scheme 1 Schematic overview of the FTYc_UV strategy for comprehensive RBPs characterization by MS.

Figure 1 Fluorescent confocal microscopy images of mouse liver treated with or without EU for different time. Control: mouse without EU injection. The tissues were co-stained with DAPI (20 µL, blue) and Cy5-N3 (10 µmol/L, red) as nucleus and EU markers, respectively.

Figure 2 (a) Dot blot analysis of RNA biotinylation by the thiol-yne reaction. (b) Characterization of the RNA integrity after alkyne labeling (control), CuAAC withount/with ligand (THPTA) and the thiol-yne reaction.

Figure 3 SDS-PAGE characterization of enriched cRPCs from mouse liver. After EU labeling and formaldehyde crosslinking, the tissue lysates were reacted with biotin-PEG11-SH via thiol-yne reaction and enriched with streptavidin beads. The captured cRPCs were eluted by RNase A, resolved by SDS-PAGE and visualized by silver staining.

Figure 4 (a) Schematic overview of the quantitative differential proteome comparison between the experimental and control groups. (b) Volcano plot displaying the log2fold_change and -log10P_value of the RBPs in the quantitative differential analysis. (c) Quantitative reproducibility of the identified RBPs.

Figure 5 (a) Number of RBPs with different RBDs. (b) GO analysis of identified RBPs. Up: Biological process; Down: Molecular function. (c) Pathway analysis of identified RBPs.

 扫一扫看文章

扫一扫关注我们
 DownLoad:
 下载:
下载:

 下载:
下载: