State Key Laboratory of Bioactive Substance and Function of Natural Medicines, Institute of Materia Medica, Chinese Academy of Medical Sciences and Peking Union Medical College, Beijing 100050, China
b.
Viktor Technology Co., Ltd., Beijing 101100, China
c.
School of Pharmaceutical Sciences & State Key Laboratory of Functions and Applications of Medicinal Plants & Microbiology and Biochemical Pharmaceutical Engineering Research Center of Guizhou Provincial Department of Education, Guizhou Medical University, Guiyang 550025, China
d.
Key Laboratory of Mass Spectrometry Imaging and Metabolomics (Minzu University of China), National Ethnic Affairs Commission, Beijing 100081, China
e.
Center for Imaging and Systems Biology, College of Life and Environmental Sciences, Minzu University of China, Beijing 100081, China
f.
NMPA Key Laboratory for Safety Research and Evaluation of Innovative Drug, Beijing 100050, China
* Corresponding author at: Institute of Materia Medica
Chinese Academy of Medical Sciences and Peking Union Medical College
Beijing 100050
China. E-mail address: hejiuming@imm.ac.cn (J. He). 1 These authors contributed equally to this work.
Received Date:
27 November 2024 Accepted Date:
26 March 2025 Revised Date:
23 March 2025 Available Online:
15 January 2026
Abstract:
The brain's functions are governed by molecular metabolic networks. However, due to the sophisticated spatial organization and diverse activities of the brain, characterizing both the minute and large-scale metabolic activity across the entire brain and its numerous micro-regions remains incredibly challenging. Here, we offer a high-definition spatially resolved metabolomics technique to better understand the metabolic specialization and interconnection throughout the mouse brain using improved ambient mass spectrometry imaging. This method allows for the simultaneous mapping of thousands of metabolites at a 30 µm spatial resolution across the mouse brain, ranging from structural lipids to functional neurotransmitters. This approach effectively reveals the distribution patterns of delicate microregions and their distinctive metabolic characteristics. Using an integrated database, we annotated 259 metabolites, demonstrating that the metabolome and metabolic pathways are unique to each brain microregion. The distribution of metabolites, closely linked to functionally connected brain regions and their interactions, offers profound insights into the complexity of chemical processes and their roles in brain function. An initial dataset for future metabolomics research might be obtained from the high-definition mouse brain's spatial metabolome atlas.
The brain is the most sophisticated organ in mammals, possessing various physiological functions and intricate cellular organization [1]. The morphologically unique anatomical regions of the brain are composed of a diverse array of cells, which are regulated by complex neural networks that connect microregions to overall brain function [2-5]. Numerous genomic and proteomic studies have illuminated the regulatory mechanisms of the central nervous system (CNS) by mapping its expression profiles [6-8].
Metabolites, as the end products of molecular biology, encompass a wide range of small molecules, including neurotransmitters and complex lipids, that play crucial roles in signaling and regulation. These metabolites have significant implications for CNS function [9,10], psychiatric disease pathogenesis [11], and drug development [12,13]. However, the brain metabolome is currently understudied, and the available comprehensive metabolome maps of the brain are based on the results of manual anatomical separation of individual regions for analysis [14], which offers low resolution and fails to capture molecular differences within fine microregions. The pre-processing procedure based on LC-MS leads to the loss of spatial distribution information of metabolites within the tissue. Additionally, it obscures the specificity and heterogeneity of related metabolites. Consequently, establishing high-resolution in situ molecular imaging methods for the high-throughput characterization of brain metabolites remains a significant challenge.
Mass spectrometry imaging (MSI), as a foundational technique for spatial metabolomics analysis, allows for the characterization of the spatial distribution of diverse compounds on complex surfaces. It simultaneously provides combined information on m/z, intensity, and localization for thousands of metabolites in a single assay [15-20]. MSI enables the analysis of brain slices to map various biomolecules, revealing alterations in the metabolome and lipidome associated with pathological states [21-25]. This advanced technique demonstrates significant potential for uncovering the mechanisms of pathogenesis [26,27] and identifying novel biomarkers in CNS research [28]. The air flow-assisted desorption electrospray ionization (AFADESI)-MSI developed as an ambient ionization imaging technique can analyze the sample surface directly [29-31]. During the ionization process, charged droplets are transported over long distances through a transfer tube, where they are further desolvated, enriched and ionized under the action of high-velocity airflow. This process improves detection sensitivity and is particularly effective for low levels of small molecule metabolites in biological tissues.
With ongoing advancements in technology, MSI with micron-level resolution has made it possible to precisely localize metabolites within complex brain tissues [32]. However, it is well established that an inverse relationship exists between sensitivity and spatial resolution [33,34].
Our previous studies demonstrated that AFADESI-MSI, with a spatial resolution of 80 µm, offers high coverage, exceptional sensitivity, and a wide dynamic range, making it well-suited for comprehensive untargeted metabolomics analysis [35-38]. Building on this, we have developed a high-definition, spatially resolved metabolomics approach using AFADESI-MSI, achieving a spatial resolution of up to 30 µm while maintaining high sensitivity for metabolite mapping. Utilizing this advanced technique, we conducted a comprehensive spatial metabolomic analysis of various microregions in the mouse brain. By focusing on 15 microregions in the sagittal section, we constructed a high-coverage spatial metabolic map, shedding light on the metabolic specialization and interconnectivity of the mouse brain.
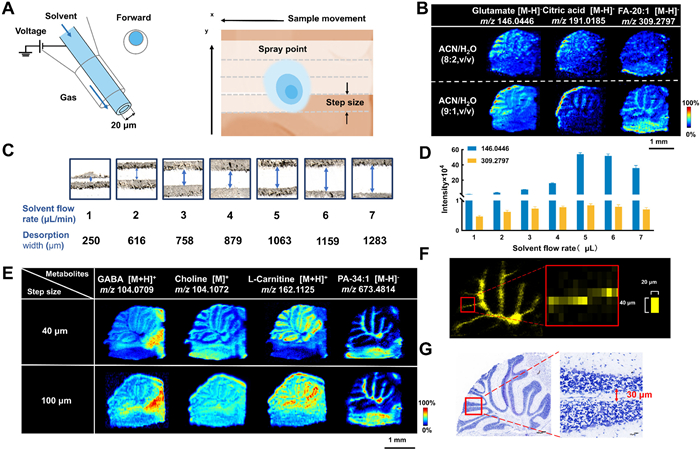
We designed a fine desorption probe with an inner diameter of 20 µm solvent capillary for AFADESI-MSI (Fig. 1A). Van Berkel et al.'s study of the spray/surface interaction identified three zones: An inner zone where most desorption takes place, an outer elliptical zone where solvent "jetting" from the inner region strikes the surface, and a peripheral of larger, slower-moving droplet impacts [39]. Compared to the previous 100 µm probe [40], the 20 µm probe forms a smaller and more stable spray point, making it suitable for imaging samples with fine microregions. In contrast to the traditional coaxial design, the capillary geometry is off-axis, according to previous research, allowing for the production of a tighter spray cone to increase spatial resolution [41].
Figure 1
Figure 1.
High-resolution AFADESI scanning strategy and condition optimization. (A) Fine probe design and point-by-point rasterized ablation scanning (RAS). (B) MSI of cerebellum under applying different ratios of ACN/H2O as spray solvents. (C) Optical images of the scan widths at different spray solvent flow rates. (D) Ion intensities at m/z 146.0446 and m/z 309.2797 at different spray solvent flow rates. (E) MS images of the distribution of different ions in the cerebellum at 40 µm and 100 µm steps. (F) Individual pixel size in the image at 40 µm step. (G) Nissler stained the image of the cerebellum.
We propose a scanning strategy called point-by-point rasterized ablation scanning (RAS) (Fig. 1A). An electrospray plume impacted the sample surface, in which it microextracted, desorbed and exfoliated compounds from the tissue section at a predefined speed (in this case, 0.04 mm/s) parallel to the X-axis. The procedure began at the beginning of the first row of the region of interest on the sample surface. During the scanning motion of MSI, the sample is primarily desorbed by the right bottom part of the spray spot. The electrospray plume can carry the sample from its bottom to its top, thus creating a scanning area that includes both exfoliated and non-exfoliated zones, allowing for adequate resolution in the y-axis. Subsequently, AFADESI presents the high flow-rate extracting air flow was introduced to improve ion collection and remote transport efficiency and to promote charged droplets desolvation [37]. Following the completion of the first line of scanning, the sample surface is moved back to the first line's starting point. Next, it is moved up parallel to the y-axis by the predetermined y-axis scanning spacing (in this case, 0.04 mm), and the second line of scanning is carried out in the same manner as the first line. This approach differs from DESI-MSI methods, where post-scan sections can be used for staining. To achieve optimal imaging performance, we optimized both the spray solvent composition and flow rate for MSI. Using ACN/H₂O (9:1, v/v) as the spray solvent revealed subtle structures in the cerebellum (Fig. 1B). However, increasing the ratio of organic solvent slightly reduced the detection intensity of polar small-molecule metabolites, while enhancing sensitivity for the detection of fatty acids and lipids (Fig. S1A in Supporting information). Flow rate analysis demonstrated a positive correlation between higher solvent flow rates and desorption width (Fig. 1C). At a flow rate of 5 µL/min, the highest signal intensity was observed, defining it as the optimal spray flow rate (Fig. 1D). Additionally, at this flow rate, a scanning step size of 100 µm achieved an approximate spatial resolution of 80 µm (Fig. S1B in Supporting information). Thus, for high-resolution imaging, a higher spray solvent flow rate within an appropriate range can be utilized to achieve reasonable spatial resolution while enhancing detection sensitivity.
Reducing the step size effectively enhances the spatial resolution of MSI. MSI analysis was carried out at step sizes of 40 µm and 100 µm on the mouse cerebellum using the optimum settings previously indicated. Imaging resolution is much improved when the step size is decreased, as Fig. 1E illustrates. The high-quality pictures acquired at a 40 µm step size show more vivid intensity contrast and more defined cerebellar edges. At a 100 µm step size, the cerebellar white matter region and the granular layer are hidden, while the m/z 104.1072 ion picture clearly shows the granular layer at a 40 µm step size.
In our study, the single pixel size for high-resolution imaging was 20 µm × 40 µm (Fig. 1F), corresponding to a theoretical lateral resolution of 20 µm. When compared with the Nissl staining results of adjacent sections, the cerebellar white matter width was approximately 30 µm (Fig. 1G). This matching image size suggests that the actual resolution can reach 30 µm. Simultaneously, we determined the distance needed to move from 20% to 80% of the overall intensity change (Fig. S2 in Supporting information), confirming the spatial resolution to be approximately 30 µm. Under 40-µm and 100-µm stepping conditions, we detected 1547 and 1099 metabolite ions (Fig. S1C in Supporting information). These ions include bases, amino acids, polyamines, carnitine, choline, carbs, cholesterol, bile acids, and lipids. These metabolites are widely distributed in various metabolic network pathways [31,38]. Furthermore, it was found that reducing the step to improve resolution had minimal effect on the coverage of small molecule metabolites when the metabolites were divided into distinct mass intervals but did result in a drop in large molecule lipids (Fig. S1D in Supporting information). Finally, we evaluated the resolution, coverage, and reproducibility of the established method, with results shown in Fig. S3 (Supporting information). These findings demonstrated that the off-axis spray needle design provided high spatial resolution, comprehensive coverage, and improved sensitivity in imaging, outperforming the previous coaxial spray needle design under optimized conditions.
For high-resolution imaging studies, four distinct brain slices were prepared to generate a spatial metabolic profile of the mouse brain. Nissl staining (Fig. S4A in Supporting information) revealed 21 microregions in the brain, including the cerebral cortex (CTX), olfactory bulb (OB), corpus callosum (CC), striatum (STR), hippocampus (HP), dentate gyrus (DG), thalamus (TL), hypothalamus (HT), midbrain (MB), substantia nigra (SN), pons (PO), medulla (MD), cerebellar gray matter (CBG), cerebellar white matter (CBW), cerebellar granular layer (CGL), and others. A total of 838 metabolites were identified after we characterized the mouse brain tissues using three platforms-LC-MS lipidomics, LC-MS metabolomics, and GC–MS to get accurate metabolite information (Fig. 2A). MS/MS spectra of representative metabolites are in Fig. S5 (Supporting information). Identification results are shown in Table S1 (Supporting information). Complex lipids, including fatty acyls (FA), glycerolipids (GL), glycerophospholipids (GP), sphingolipids (SP), and sterol lipids (ST), make up the majority of the brain metabolome, according to the results (Fig. 2B). In the brain, lipids and lipid-like molecules constituted the largest category of detected metabolites, followed by organic acids and their derivatives, which included amino acids, modified amino acids, peptides, and hydroxy acids. A comparison with the MSI data identified 259 metabolites, classified as shown in Fig. 2C. Sterol lipids, phenylpropanoids and polyketides were not detected in AFADESI, likely due to their lack of polarity.
Figure 2
Figure 2.
Overview of the mouse brain atlas dataset. (A) The number of brain metabolites identified by applying different techniques. (B) Classify the metabolite diversity of all annotated metabolites across assays. (C) Classify the metabolite diversity of annotated metabolites by MSI. (D) MS images of metabolites in the brain.
The MSI results revealed the specific distribution of metabolites in different micro-regions of the brain, associating brain regions with specific metabolites (Fig. 2D). Excitational neurotransmitters such as dopamine distribute only in dopamine neurons and dopamine receptor-rich texture, play a function of motion regulation. Adenosine is a neurotransmitter involved in energy metabolism and is concentrated mainly in the brain's hypochondria and hippocampus. Studies have shown that adenosine inhibits dopamine, both of which regulate the function of hypothyroidism [42]. γ-Aminobutyric acid (GABA) is an inhibitory neurotransmitter mainly distributed in the HT and substantia nigra, followed by a higher content in the olfactory sphere. This distribution is consistent with the function of GABA synthesized by brain retinal neurons and projected to the abdominal brain to suppress organisms' excessive excitement [43]. Acetylcholine is concentrated mainly in the cerebral cortex and hippo which plays an important role in awakening, attention, memory and motivation [44]. Representative metabolite MSI images of other sections are shown in Fig. S6 (Supporting information).
Different microregions of the brain are interconnected through complex metabolic networks, and the distinct metabolic characteristics of these regions are closely related to brain function [3,37]. Our high-resolution imaging method allows for precise localization of metabolites within anatomical sub-structures. For instance, both HP and DG can be divided into molecular, vertebral cell, and granular cell layers [45]. Spermine was irregularly distributed in the granular cell layer, with larger amounts in DG, while PC (32:0) was concentrated in the radial layer, as seen in Fig. S7A (Supporting information). Spermine, a positively charged aliphatic amine, plays a crucial role in maintaining cellular functions, promoting cell proliferation, and regulating neurotransmitter receptors [46,47]. DG continuously generates new excitatory neurons throughout adulthood, suggesting a potential role for spermine in hippocampal memory modulation. Using the Functional Analysis module in MetaboAnalyst, we constructed a metabolic relationship network for the identified metabolites (Fig. S7B and Table S2 in Supporting information). The network primarily participates in metabolic pathways that include arginine and proline metabolism, glutathione metabolism, alanine, aspartate and glutamate metabolism, and cysteine and methionine metabolism. The metabolic pathways of arginine and proline involve polyamines and creatine, with MSI results showing specific distribution patterns of metabolites in mouse brain microregions (Fig. S7C in Supporting information). Arginine, a precursor for both pathways, is widely distributed in brain tissues. The polyamine metabolic pathway mainly includes putrescine, spermidine, and spermine. Putrescine and adenosine methionine were found in the corpus callosum, cerebellum white matter, pons, and medulla, while spermidine shows a similar spatial distribution. Interestingly, spermidine was mainly located in the olfactory bulb, cortex, and striatum, whereas spermine concentrates in regions enriched with GABA receptors, such as the olfactory bulb, cortex, hippocampus, and cerebellar granular layer. Putrescine can be further deaminated by diamine oxidase or polyamine GABA, which was highly concentrated in the olfactory bulb, hypothalamus, hippocampus, and cerebellar granule layers-regions abundant in GABA receptors. Contrastingly, the GABA metabolite, hyperosmolar peptide, is predominantly found in the fibrillar tract and medullary fractions.
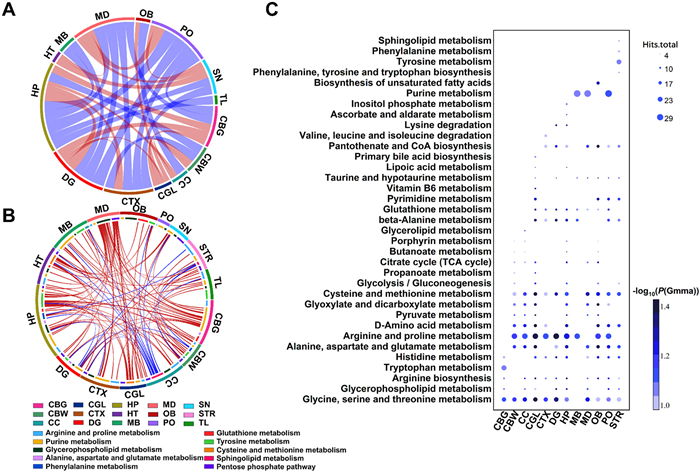
Following the Shapiro-Wilk test, we computed Pearson correlations between samples from various brain regions and scaled and log transformed the matrix of identified ions found in 15 microregions of sagittal brain tissue. We chose the top 32 connections with significant correlation coefficients to present, and the findings are given in Fig. 3A. The circles represent different brain regions. The connecting bands between metabolites indicate correlations, where the color of the bands represents the direction of the correlation (red: positive; blue: negative), and the thickness of the bands represent the magnitude of the correlation coefficient. The results indicated that the cerebral cortex, hippocampus, dentate gyrus, pons, and medulla have extensive connections with other brain regions, consistent with the highly interconnected hub regions obtained from human brain DTI imaging calculations [48]. The strong negative correlations between the cerebrum (cortex, olfactory bulb, hippocampus, dentate gyrus) and brainstem (pons, medulla) reflected the different functions of these regions. The cerebrum has complex neuronal networks for higher cognitive functions, while the older brainstem primarily regulates autonomic activities, consistent with previous proteomics analysis results [49]. The cerebellar white matter and the corpus callosum are both part of the brain's fiber tracts, which results in their similar metabolic characteristics. Rich in granular cell layers, the olfactory bulb, dentate gyrus, and cerebellar granular layer regions have positive associations in the Circos plot as well.
Figure 3
Figure 3.
Metabolic correlation and differential analysis between brain regions. (A) Correlation circos plot of different brain regions. (B) Metabolite-metabolite correlation circos plot of different brain regions. (C) Bubble plot of differential pathways in different brain regions.
Pearson's correlation analysis was performed for metabolites in 10 major metabolic pathways and correlation coefficients were displayed in the Circos plot as shown in Fig. 3B. The outer circles represent brain areas, while the inner circles depict metabolic pathways. We displayed significant metabolite-to-metabolite correlations (P < 0.0001), with bandwidth representing correlation coefficient magnitude and color indicating correlation direction (red: positive; blue: negative). The cerebral cortex and cerebellar gray matter were mainly associated with other brain regions through purine metabolism. Purine-related metabolites play essential roles in maintaining neuronal and glial cell functions and neurohomeostasis, affecting synaptic transmission and various brain-related higher functions [50,51]. Remarkably, tyrosine metabolism as well as cysteine and methionine metabolism were the primary pathways by which the hippocampus was linked to other areas of the brain. Research has demonstrated that tyrosine phosphatase is significantly reduced in the hippocampal regions of Alzheimer's patients and highly enriched in the hippocampi of humans and mice [52]. Additionally, sphingolipid metabolism metabolites in the corpus callosum show extensive negative correlations with other brain regions.
To recognize metabolic differences among brain areas, we first computed the mean level matrix of each metabolite in every six regions of interest from 15 brain regions, which served as control samples. Mummichog was used to examine the differences in metabolic pathways between each brain area sample and the control sample. Bubble plots were created for metabolic pathways with significant differences (P (Gamma) < 0.1) (shown in Fig. 3C). SN, HT, and TL did not map to divergent metabolic pathways; TL's major variations were mostly related to bigger m/z metabolites, while SN and HT showed only minor changes from the average metabolic level of the entire brain. Compared to the whole brain's average metabolic level, the CGL and HP micro-regions had the most differential metabolic pathways. Arpiar et al. found the highest cell type diversity in the hippocampus of adult mice [53], while transcriptomic mapping of the mouse cerebellar cortex showed that the granule cell layer and Purkinje cell layer had the most significantly divergent lobule compositions [54]. The levels of purine metabolism in MB, MD, and PO were lower than in the whole brain, likely related to their physiological functions. The biosynthesis of unsaturated fatty acids differed only in the olfactory bulb compared to the whole brain, interestingly correlating with Toshiyasu Sasaoka's team's findings that food odor perception can promote lipid metabolism in mice [55]. Tyrosine metabolism and phenylalanine metabolism only differed in the striatum, as dopamine is specifically distributed in this region. Valine, leucine, and isoleucine degradation pathways only differed in the cerebral cortex, where these branched-chain amino acids (including isoleucine, leucine, and valine) are particularly important for neuronal development [56].
This study developed a high-performance AFADESI-MSI that is excellent for evaluating complex microregions. By combining high-velocity airflow to enhance in-situ resolution of charged droplets with solvent desolvation in the transport tube, AFADESI significantly increases analytical sensitivity [29,57]. The resolution gain is attributed to the off-axis capillary and the use of a high organic phase spray solvent [58]. Finally, the actual resolution can reach up to 30 µm by reducing the moving step. This allows for the ionization and desorption of low-abundance metabolites and significantly improves detection sensitivity when combined with the high-speed pumping of AFADESI-MSI. The need for high coverage of non-targeted metabolomics was achieved while obtaining high-resolution images.
We applied the established imaging method to perform a comprehensive analysis of different sections of the mouse brain. A high-coverage spatial metabolome map of the mouse brain was created with 259 annotated metabolites, including organic acids, organic oxygen compounds, organic heterocyclic compounds, benzene compounds, organic nitrogen compounds, nucleosides, and complex lipids, which can inform previously established genomic, transcriptomic, and proteomic maps. We examined the metabolic specialization and interconnectivity of the mouse brain using microregions of the sagittal brain as an example, offering insights into brain function based on metabolic levels. It is interesting to note that substances that have been identified in the past as dispersed inside a certain anatomical structure can be identified as micro-regional substructures in high-resolution MSI. This finding could provide light on the regulatory functions that various cell types play in brain activity. Furthermore, distinct metabolites found in a given microregion can potentially point to significant molecules controlling that region's functionality. Less polar metabolites (such as sterol lipids, phenylpropanoids, and polyketides) were not discovered by AFADESI in this investigation, largely due to the solvent composition. However, adding DMF (N,N-dimethylformamide), NMF (N-methylformamide) [59], and trifluoroacetic acid [60] to the spray solvents or using in situ derivatization [61,62] could boost the sensitivity of detecting less polar metabolites. Furthermore, introducing secondary ionization, such as DESI-PI-MSI, is another effective way to increase the ionization efficiency of nonpolar molecules in DESI [63]. Overall, various brain microregions have varied concentrations of most metabolites, according to our high-resolution metabolomics approach. Furthermore, these metabolites' distribution patterns are tightly linked to the physiological operations of certain brain regions, demonstrating the metabolic specialization and interconnection of the mouse brain.
Ethical statement
Animal experiments were approved by the Animal Protection and Welfare Committee of Chinese Academy of Medical Sciences and Institute of Materials Research, Peking Union Medical College (No. 00009484).
Declaration of competing interest
The authors declare that they have no known competing financial interests or personal relationships that could have appeared to influence the work reported in this paper.
The authors would like to thank financial support from the National Natural Science Foundation of China (Nos. 82473887 and 21927808), the Scientific and Technological Innovation Program of Shanghai (No. 23DZ2202500) and the CAMS Innovation Fund for Medical Sciences (No. 2021–1-I2M-026). We thank Luming Biotechnology Co., Ltd. for providing technical support for HRLC-MS metabolomics, lipidomics, and GC–MS analysis.
Supplementary materials
Supplementary material associated with this article can be found, in the online version, at doi:10.1016/j.cclet.2025.111153.
[1]
S.W. Oh, J.A. Harris, L. Ng, et al., Nature 508 (2014) 207–214. doi: 10.1038/nature13186
Figure 1
High-resolution AFADESI scanning strategy and condition optimization. (A) Fine probe design and point-by-point rasterized ablation scanning (RAS). (B) MSI of cerebellum under applying different ratios of ACN/H2O as spray solvents. (C) Optical images of the scan widths at different spray solvent flow rates. (D) Ion intensities at m/z 146.0446 and m/z 309.2797 at different spray solvent flow rates. (E) MS images of the distribution of different ions in the cerebellum at 40 µm and 100 µm steps. (F) Individual pixel size in the image at 40 µm step. (G) Nissler stained the image of the cerebellum.
Figure 2
Overview of the mouse brain atlas dataset. (A) The number of brain metabolites identified by applying different techniques. (B) Classify the metabolite diversity of all annotated metabolites across assays. (C) Classify the metabolite diversity of annotated metabolites by MSI. (D) MS images of metabolites in the brain.
Figure 3
Metabolic correlation and differential analysis between brain regions. (A) Correlation circos plot of different brain regions. (B) Metabolite-metabolite correlation circos plot of different brain regions. (C) Bubble plot of differential pathways in different brain regions.

 DownLoad:


 下载:
下载:


 下载:
下载:
