Frontiers Science Center for Transformative Molecules, School of Chemistry and Chemical Engineering, Shanghai Jiao Tong University, Shanghai 200240, China
b.
Henan Yujing Energy, Zhengzhou 450000, China
c.
Department of Electrical Engineering, Shanghai Jiao Tong University, Shanghai 200240, China
simonhao@sjtu.edu.cn (W. Hao). 1 These authors contributed equally to this work.
Received Date:
27 January 2025 Accepted Date:
20 March 2025 Revised Date:
16 March 2025 Available Online:
01 July 2026
Abstract:
Lithium plating and gas evolution during fast charging of graphite-based lithium-ion batteries (LIBs) are among the pivotal challenges contributing to rapid capacity loss. However, the mechanisms underlying gas generation and corresponding mitigation strategies in electrolytes comprising mixed organic molecules and Li salts remain underexplored. Herein, we employed first-principles studies to simulate the lithiation process of electrolytes and predicted gas formation at anode interfaces with Li plating. Our results emphasize the critical role of Li salts in initiating solvent molecule decomposition and the exacerbation of interfacial degradation under conditions of elevated temperature and prolonged annealing, giving rise to the production of CO, C2H4, CH4, and H2, along with a significant increase in SEI's electronic conductivity. Moreover, our computations highlight that ethylene carbonate (EC) in commercial electrolytes is the overarching cause of interface instability and gas evolution. Experimental validations demonstrate that reducing the EC content in electrolytes results in an enhancement of the specific capacity of LiNi0.8Co0.1Mn0.1O2graphite full cells from 158.13 mAh/g to 182.53 mAh/g, and an improvement in capacity retention from 72.0% to 80.4% over 130 cycling at 3 C. This research provides a theoretical framework for designing fast-charging electrolytes with stable interfaces and minimal gas generation.
The ever-increasing demand for long-range electric vehicles (EVs) and large-scale electronic devices stimulates the design and development of fast-charging lithium-ion batteries (LIBs) [1,2]. Specifically, the United States Advanced Battery Consortium (USABC) has proposed that charging 80% of the total battery capacity within 15 min is a tangible benchmark for fast-charging LIBs. A pivotal factor contributing to the fast-charging performance of LIBs is the stable anode interface coating with solid electrolyte interphase (SEI), facilitating the Li intercalation into graphite and mitigating side reactions [3-5]. Therefore, considerable efforts have been directed towards interfacial engineering with electrolyte design to enhance fast-charging performance, achieving charging rates of up to 3 C without notable gas expansion [6]. However, the low lithium-intercalation potential of graphite anodes contributes to the Li plating in LIBs under fast-charging conditions [7-10]. With high reactivity, the accumulation of Li metal at the anode interface leads to subsequent electrolyte degradation and gas evolution, eventually giving rise to a cascade of safety concerns [8,11].
Recently, many experiments have utilized both ex-situ and in-situ techniques, including optical images, in-situ differential electrochemical mass spectrometry (DEMS) [12], and gas chromatography-mass spectrometry (GC–MS) [13,14], to detect and observe the gas evolution on lithium metal surfaces [6]. Extensive efforts have been dedicated to summarizing gas-producing pathways [15] and suppressing and mitigating gas formation. Li et al. introduced a high-concentration ethyl acetate (EA)-based electrolyte to form a dense and uniform SEI, effectively preventing side reactions and gas evolution at low temperatures [16]. Wang et al. designed a highly stable Li anode incorporating silver nanowires in patterned ditches, enabling prolonged cycling of the LiFePO4 (LFP) pouch cells without gas generation, as evidenced by ultrasonic transmission mapping tests [17]. Additionally, the use of electrolyte film-forming agents and novel Li salts can further stabilize the Li metal anode and reduce gas generation [18-20]. Despite these efforts, the inherent temporal and spatial limitations hinder the experimental observation of both the gas initiation site and the property evolution at the anode interface [21]. Decoupling the gas-generation mechanisms of individual components at the Li interface in electrolyte systems would greatly facilitate the strategic design of fast-charging electrolytes [22,23].
To delve into the underlying mechanism of gas evolution between Li metal and commercial electrolyte, researchers have employed quantum mechanics methods to unveil the interfacial reactions and dynamics at the anode interface. These studies have investigated the stability and electronic structure of electrolyte molecules, such as ethylene carbonate (EC), propylene carbonate (PC), dimethyl carbonate (DMC), and lithium hexafluorophosphate (LiPF6, LPF), adsorbed on the Li surface, demonstrating their reduction tendencies [24,25]. Pure solvent and cooperation of Li salt configurations are studied based on ab initio molecular dynamics (AIMD), MD, and reactive force-field (ReaxFF) calculations to allow redox reaction simulations [26,27]. Prominently, Li-electrolyte interfaces have been analyzed to understand the chemistry and the Li-ion transport properties, describing the effect of charged interfaces on electrolyte degradation [28,29]. Nonetheless, previous studies primarily focus on energy variations and charge transfer, neglecting gas evolution and its influence on interface stability. Therefore, to fully comprehend gas generation mechanisms under Li plating, intensive studies are needed to investigate electrolyte degradation behavior interlinked with Li metal, considering the catalytic effects of Li0 and Li+.
In this work, we use first-principles simulations to examine the optimal configurations of the EC-DMC-LPF mix electrolyte and elucidate reaction-induced gas evolution at the Li/electrolyte interface. Our findings indicate EC is the primary contributor to gas generation under typical operating conditions. Whether the application of elevated temperatures and prolonged annealing times may influence gas generation and electrolyte degradation is then discussed by analyzing structural, energetic, and electronic properties. Finally, the effect of decreasing EC content on improving full-cell performance throughout battery cycling is investigated systematically, resulting in enhanced specific capacity and capacity retention of NCM811|graphite full cells. Specifically, the specific capacity increased from 158.13 mAh/g to 182.53 mAh/g, and capacity retention improved from 72.0% to 80.4% over 130 cycling at 3 C. Our work provides new insights into designing fast-charging electrolytes with stable interfaces and minimal gas generation.
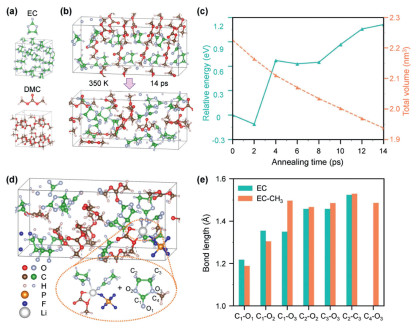
To generate a realistic electrolyte configuration, we initially considered the pure solvents composed of EC and DMC. As depicted in Fig. 1a, the optimized configurations of pure EC and DMC exhibit densities of 1.32 g/cm3 and 1.07 g/cm3, respectively, which align closely with experimental findings. Subsequently, an EC-DMC mixed solvent is formulated by combining 10 EC and 8 DMC molecules to maintain a 1:1 vol ratio between EC and DMC. As illustrated in Fig. 1b, the mixed solvent undergoes annealing at 350 K for a total duration of 14 ps, with increments of 2 ps. In Fig. 1c, the total energy increases by approximately 0.11% compared to the unmixed solvents, accompanied by a volume shrink of about 12.95%. This suggests the potential for electrolyte layering upon prolonged standing. Furthermore, a LiPF6 (LPF) molecular is introduced into the mixed solvent as Li salt at a concentration of about 1 mol/L. The introduction of LPF primarily distorted the vicinal molecular, with the dissolved Li+ adopting a 5-coordinate structure, thereby facilitating transesterification between DMC and EC. As shown in Fig. 1d, an EC molecule is methylated by adjacent DMC, with other EC and DMC molecules remaining largely unaffected and integrity. The bond length analysis revealed a significant extension of the C1-O3 bond in the methylated EC, benefiting the ring-opening process of that EC (Fig. 1e, Fig. S1 and Table S1 in Supporting information). This methylated EC preferentially decomposes at the Li/electrolyte interface, accelerating gas generation under Li plating conditions. To investigate the electronic properties of the solvent systems, we employ the density of states (DOS) analysis (Fig. S2 in Supporting information). EC and DMC molecules possess wide band gaps, with their conduction band minimum (CBM) located at 4.46 eV and 4.50 eV, respectively. The CBM of the mixed solvent shifts downward to 3.87 eV due to the molecular interaction and orbitals degeneration, which broaden the CB. Upon incorporating LPF, the CBM further decreases to 3.16 eV, accompanied by the formation of localized states within the band gap, associated with the coordination atoms of Li+.
Figure 1
Figure 1.
(a) Molecule and electrolyte configurations of EC and DMC. (b) Structure of EC-DMC mixed solvent annealed at 350 K for 14 ps. (c) Energy and volume variation of the EC-DMC mixed solvent under annealing. (d) Structure of EC-DMC-LPF mixed electrolyte with enlarged solvation structure of Li+ ion and methylated EC. (e) Bond length comparison of EC framework before and after methylation.
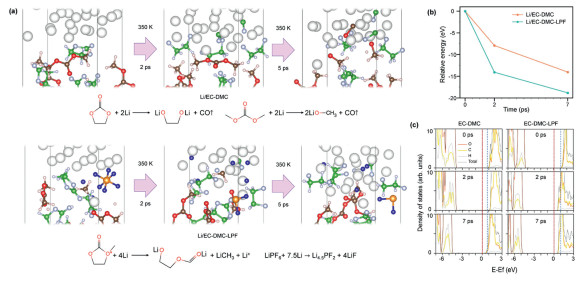
Fig. 2 illustrates the progression of the interface between Li metal and EC-DMC (Li/EC-DMC) and the interface between Li metal and EC-DMC-LPF (Li/EC-DMC-LPF) at 350 K, representing the peak operating temperature of the energy storage system [30,31]. The interfacial configuration is established with careful consideration of the adsorption energy of each molecule within the electrolyte, with a particular emphasis on the preference of LPF for adsorption onto the Li metal surface (Table S2 in Supporting information). As depicted in Fig. 2a, both interfaces, with and without the addition of LPF, exhibit irreversible reactions between Li metal and the electrolytes, resulting in the formation of a solid electrolyte interphase (SEI) and the emission of gaseous molecules. The ester groups within EC and DMC undergo reduction to CO and lithium alkoxides at the Li metal interface, thereby constructing an SEI comprising organic constituents. The incorporation of LPF modifies the reduction process by decomposing prior to EC and DMC molecules (Fig. S3 in Supporting information), yielding LiF and PF24.5− for the creation of an inorganic SEI. This SEI layer retards the interfacial lithiation of EC and DMC; specifically, only the ring-opening of EC is observed within 7 ps (Fig. S4 in Supporting information). It is worth noting that our simulation temperature is higher than the normal operation condition. Therefore, our simulation accelerates aging scenarios at the interface, leading to a significant increase in gas production, which is further verified with experiment observation (Figs. S5 and S6 in Supporting information)
Figure 2
Figure 2.
(a) Structure, (b) energy, and (c) projected and total density of states evolutions at the Li/EC-DMC and the Li/EC-DMC-LPF annealed under 350 K for 2 ps and 7 ps. The vertical red and blue dashed line indicates the position of the Fermi level and initial CBM, respectively.
Fig. 2b presents the energetic variations at the Li/EC-DMC and the Li/EC-DMC-LPF during the lithiation degradation process, indicating that spontaneous lithiation occurs at bot interfaces. Notably, the energy of the Li/EC-DMC-LPF decreases more rapidly within the first 2 ps, compared to the interface without LPF, suggesting a preferential energetic tendency for the lithiation of LPF due to the formation of LiF. Following the establishment of a LiF-rich SEI, the energy decline between 2 ps and 7 ps is slower in the presence of LPF, confirming that such SEI effectively curtails further interfacial lithiation. Additionally, The DOS analysis reveals the electronic degradation of these interfaces (Fig. 2c and Fig. S7 in Supporting information). Initially, the CBM of the Li/EC-DMC is positioned at 0.85 eV and shifts downwards to 0.68 eV after annealing for 7 ps. Similarly, with LPF, the CBM decreased from 1.04 eV to 0.59 eV. Despite a narrowing of the band gap, both interfaces maintain a sizable gap. Our findings imply that although Li plating at the anode results in gas generation and electrolyte degradation, it may not be an overarching cause for battery short-circuiting or thermal runaway under typical operation conditions of energy storage systems.
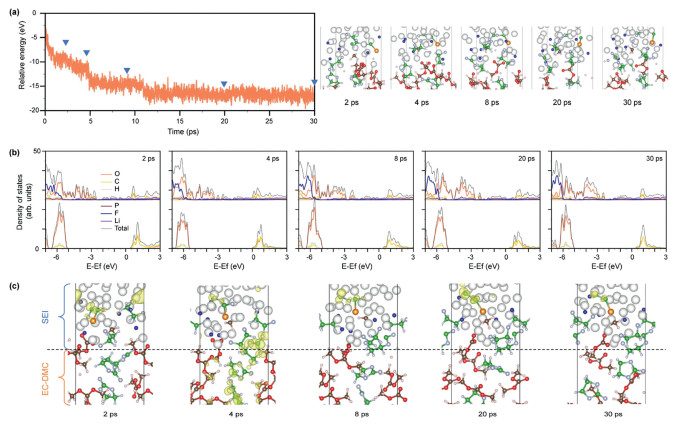
To examine the prolonged impact of Li plating on gas generation, the Li/EC-DMC-LPF undergoes additional annealing for 30 ps, during which we meticulously documented the evolution of energy and structure. Despite the formation of a relatively stable SEI enriched with LiF, the lithiation process at the interface remained incompletely suppressed. As depicted in Fig. 3a, the interfacial energy experiences a steep decline within the first 1 ps, with the reduction of PF24.5− to Li3P and LiF. Following a minor plateau, the energy decreases by approximately 1.87 eV with the generation of CO. Subsequently, the energy drops by about 3.22 eV and then 2.50 eV with the opening of the EC rings and the formation of C. After annealing for 12.5 ps, the energy fluctuates around −17.11 eV, indicating the attainment of energetic equilibrium in the interfacial lithiation process. Notably, the P-C bond forming between P and CO undergoes gradual cleavage during interfacial evolution. The balance configuration reveals the presence of H· and CH3· radicals, hinting at the potential formation of H2, CH4, and C2H6 under Li plating conditions.
Figure 3
Figure 3.
(a) Structure and energy evolutions of the Li/EC-DMC-LPF under 350 K for 30 ps. Insets show the typical configurations during annealing. (b) Projected and total density of states evolutions and (c) structures for the SEI and EC-DMC layers in the typical configurations.
The evolution of interfacial electronic properties is studied by dividing the interface into SEI and EC-DMC layers (Figs. 3b and c). Specifically, the SEI layer is defined as extending from the highest Li atom bonded with electrolyte atoms to the lowest electrolyte atoms in the electrolyte molecule bonded with Li atom; The EC-DMC layer is regarded as comprising free electrolyte molecules. A significant proportion of Li atoms in the SEI layer persist in the neutral state, imparting metallic characters and high electronic conductivity to this layer. In contrast, the CMB of the electrolyte layer undergoes only a slight downward shift from 0.44 eV to 0.42 eV, displaying its insulating nature. Band-decomposed charge density analysis reveals that the peak near the CBM is primarily attributed to the anti-bonding of CO within the SEI layer, thereby validating the insulating property of the electrolyte layer. These simulation outcomes unequivocally demonstrate that the interfacial reactions reach an equilibrium state, with the unreacted electrolyte maintaining insulation, highlighting the stability of the energy storage battery at standard operating temperatures.
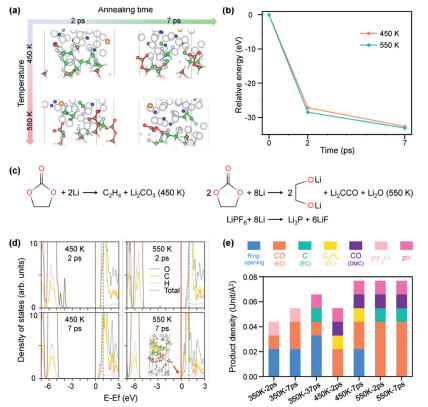
The gas evolution and thermal runaway occur intensely under elevated temperatures, expediting the decomposition of electrolyte molecules at the Li metal interface. The Li/EC-DMC-LPF are subjected to annealing at 450 K and 550 K, mimicking the thermal runaway temperature and the boiling point of the solvent, respectively. Fig. 4a illustrates that PF6− is comprehensively reduced to Li3P and LiF, with the decomposition of solvent molecules and gas generation at the Li metal interface. In addition to CO, H· and CH3· derived from EC and DMC, C2H4 formed through EC reduction is discernible at 450 K. Moreover, the reduction of CO into C is observed at 550 K, suggesting an enhancement in the electronic conductivity of the electrolyte. These reduction processes contribute to the formation of inorganic components, such as Li2CO3 and Li2O, within the SEI (Fig. S8 in Supporting information). The charge of the CCO cluster is also determined by Bader charge analysis. (Fig. S9 in Supporting information). An increase in temperature also promotes the lithiation rate, evident from more pronounced energy declines. Figs. 4b and c summarize the decomposition pathway and demonstrate that the relative total energies decrease to –27.17 eV and –28.50 eV at 2 ps for 450 K and 550 K, respectively, markedly faster than those under 350 K (–14.08 eV at 2 ps). These energies further diminish to –32.66 eV and –33.13 eV at 7 ps, indicating the saturation of interfacial reactions.
Figure 4
Figure 4.
(a) Structure evolutions and (b) relative energy variation of the Li/EC-DMC-LPF annealed under 450 K and 550 K for 2 ps and 7 ps. (c) The reaction of the solvent and Li salt at 450 and 500 K. (d) Projected and total density of states of the Li/EC-DMC-LPF annealed under 450 K and 550 K for 2 ps and 7 ps. The inset shows the band-decomposed charge density isosurfaces (±0.006 e/Å3) for states near the Fermi level as indicated with an arrow. The vertical red and blue dashed line indicates the position of the Fermi level and initial CBM, respectively. (e) The summary of decomposed product density at the interface between Li metal and EC-DMC-LPF.
Fig. 4d illustrates the electronic property evolution of the EC-DMC layer at 450 K revealing a decrease in the CBM from 1.04 eV to 0.37 eV after 7 ps of annealing, lower than the CBM at 350 K by 0.22 eV. Moreover, the CBM at 550 K drops to –0.09 eV, accompanied by charge dispersion throughout the system, indicating that electrons can transfer from Li metal to the electrolyte layer, potentially leading to short-circuiting. Furthermore, the interfacial reactions at various temperatures and annealing times are summarized in Fig. 4e based on different products. In general, elevated temperature and prolonged annealing time augment the degree of reduction, leading to enhanced gas generation at the Li metal interface.
To experimentally verify the gas-generation behavior in practical batteries, we assembled a pouch cell with NCM811 as the cathode and Li metal as the anode and conducted quantitative studies on gas evolution during the cycling process (Fig. S10 in Supporting information). It could be seen that the pouch cells significantly inflate after cycling (Fig. S11 in Supporting information). To further identify the source of CO2, we conducted tests on single-layer Li|Li pouch cells to exclude the interference of gas generation from the cathode, indicating that CO2 primarily originates from the cathode (Figs. S12 and S13 in Supporting information). Our experimental results agree well with calculation prediction, showing gas generation with molecular weights of 28, 16, and 2, corresponding to the CO/C2H4, CH4, and H2, respectively. In-situ differential electrochemical mass spectrometry (DEMS) analysis revealed that CO and C2H4 accounted for 78% of total gas content (Figs. S14 and S15 in Supporting information). Additionally, a small amount of CH4 and H2 are detected, which is consistent with our results from the theoretical calculations. The accumulation of CO, C2H4, H2, and CH4 may undermine the integrity of SEI and boost electronic conductivity, fostering further reduction between Li plating and the electrolyte, ultimately triggering thermal runaway in energy storage batteries.
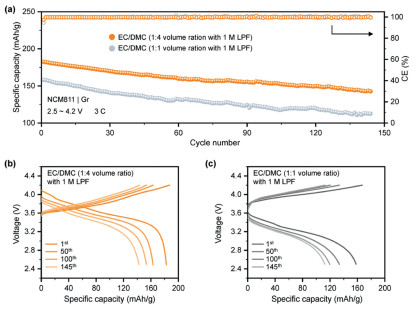
Based on the preceding calculation analysis, EC is identified as the principal factor contributing to the excessive gaseous generation and electrochemical degradation in batteries. To validate the proposed gas evolution mechanism, we manipulate the EC content in the electrolyte and measure their cycling performance. Specifically, the control and experimental electrolytes composed of EC/DMC (1:1, v/v) with 1 mol/L LPF and EC/DMC (1:4, v/v) with 1 mol/L LiPF6, respectively, are employed for the full cells. A three-electrode setup utilizing Li metal as a reference electrode was implemented to accurately measure the anode potential in LiNi0.8Co0.1Mn0.1O2|graphite (NCM811|Gr) during cell cycling, avoiding interference from NCM811 cathode (Fig. S16 in Supporting information) [10]. Li plating on graphite is discernible in cells applying both electrolytes under fast-charging conditions (3 C) (Figs. S17 and S18 in Supporting information). As predicted, EC content dilution mitigates side reactions, thereby lowering the polarization of cells with the electrolyte containing less EC. Additionally, the high-rate long-cycle performances of NCM811|Gr full cells are assessed, showing that the specific capacity increases from 158.13 mAh/g to 182.53 mAh/g with less EC content under 3 C cycling. The cycling stability is also improved when EC concentration decreases. As shown in Fig. 5a, the electrolyte with less EC content maintains a capacity retention rate of 80.4% after 130 cycles, while the electrolyte with a high concentration of EC only achieves 72.0% under the same cycling conditions. Moreover, the voltage curves of full cells with low EC concentration at the 1st, 50th, and 100th cycles exhibit minimal deviation in voltage hysteresis (Figs. 5b and c), indicating a stable graphite interface. Meanwhile, electrochemical impedance spectroscopy (EIS) was employed to further investigate the impedance changes of batteries cycled in different electrolytes. The batteries using electrolytes with lower EC content exhibited lower impedance, which also corresponded to the smaller polarization observed during the cycling (Fig. S19 in Supporting information). To deepen the understanding of interfacial stability, time-of-flight secondary ion mass spectrometry (TOF-SIMS) is employed to unveil the element distribution of Li on cycled graphite (Fig. S20 in Supporting information). The Li− mapping reveals insights into the reaction between Li metal and electrolytes via representing interfacial morphology, demonstrating a more uniform Li deposition layer in less EC content electrolytes. Additionally, we compared the gas generation behavior of cells cycled with electrolytes containing pure DMC electrolyte. As the EC content decreases, gas production initiated by the Li plating is significantly reduced, which verifies that EC dominates the gas generation at the anode (Figs. S21 and S22 in Supporting information).
Figure 5
Figure 5.
(a) Cycling performance of the NCM811|Gr full-cells using EC/DMC (1:4, v/v) with 1 mol/L LPF and EC/DMC (1:1, v/v) with 1 mol/L LPF at 3 C. Voltage curves of the NCM811|Gr full-cells using (b) EC/DMC (1:4, v/v) with 1 mol/L LPF and (c) EC/DMC (1:1, v/v) with 1 mol/L LPF at 3 C.
Scanning electron microscopy (SEM) and X-ray photoelectron spectroscopy (XPS) are utilized to gain direct insights into the Li plating on the Gr anode surface. The SEM images afford a clear visualization of the Li plating morphology on the Gr anode surface after cycling. In electrolytes with lower EC content (EC/DMC (1:4, v/v) with 1 mol/L LPF), fewer interfacial side reactions are observed, resulting in diminished Li plating due to decreased battery polarization (Figs. S23a and b in Supporting information). In contrast, the phenomenon of Li plating is more pronounced in electrolytes with higher EC content (EC/DMC (1:1 vol ratio) with 1 mol/L LPF) (Figs. S23c and d in Supporting information). Furthermore, the stability of anode interfaces can also be confirmed through XPS analysis. Examination of the C 1s XPS spectra reveals that in electrolytes with lower EC content, there is a significant decrease in organic components (C—C), indicating the suppression of interfacial side reactions. Additionally, a more abundant presence of LiF is observed, suggesting a more stable interfacial SEI (Fig. S24 in Supporting information)
In summary, we employed computational simulations to forecast the gas evolution and electrochemical degradation of electrolytes at the anode interface during Li plating, with subsequent experimental validation. Our analysis of the solvent decomposition process revealed that Li metal spontaneously reduces the EC, DMC, and LPF molecules, thereby facilitating the production of gases such as CO, C2H4, CH4, and H2 during battery cycling. Furthermore, elevated temperatures and prolonged annealing exacerbate interfacial degradation, accompanied by a marked surge in electronic conductivity. These electrolyte degradations could ultimately precipitate short-circuiting and thermal runaway. Based on the results of the calculation, EC in commercial electrolytes is predicted to undergo preferential reduction under Li plating, resulting in the formation of CO and C2H4 and contributing to interface instability. Our experimental results confirm that decreasing the EC content in electrolytes results in an improvement of the specific capacity from 158.13 mAh/g to 182.53 mAh/g and capacity retention from 72.0% to 80.4% over 130 cycling at 3 C in NCM811|Gr full cells. These findings not only offer a theoretical methodology for designing fast-charging electrolytes but also present a promising branch for interface engineering aimed at minimizing gas generation.
Declaration of competing interest
The authors declare that they have no known competing financial interests or personal relationships that could have appeared to influence the work reported in this paper.
Figure 1
(a) Molecule and electrolyte configurations of EC and DMC. (b) Structure of EC-DMC mixed solvent annealed at 350 K for 14 ps. (c) Energy and volume variation of the EC-DMC mixed solvent under annealing. (d) Structure of EC-DMC-LPF mixed electrolyte with enlarged solvation structure of Li+ ion and methylated EC. (e) Bond length comparison of EC framework before and after methylation.
Figure 2
(a) Structure, (b) energy, and (c) projected and total density of states evolutions at the Li/EC-DMC and the Li/EC-DMC-LPF annealed under 350 K for 2 ps and 7 ps. The vertical red and blue dashed line indicates the position of the Fermi level and initial CBM, respectively.
Figure 3
(a) Structure and energy evolutions of the Li/EC-DMC-LPF under 350 K for 30 ps. Insets show the typical configurations during annealing. (b) Projected and total density of states evolutions and (c) structures for the SEI and EC-DMC layers in the typical configurations.
Figure 4
(a) Structure evolutions and (b) relative energy variation of the Li/EC-DMC-LPF annealed under 450 K and 550 K for 2 ps and 7 ps. (c) The reaction of the solvent and Li salt at 450 and 500 K. (d) Projected and total density of states of the Li/EC-DMC-LPF annealed under 450 K and 550 K for 2 ps and 7 ps. The inset shows the band-decomposed charge density isosurfaces (±0.006 e/Å3) for states near the Fermi level as indicated with an arrow. The vertical red and blue dashed line indicates the position of the Fermi level and initial CBM, respectively. (e) The summary of decomposed product density at the interface between Li metal and EC-DMC-LPF.
Figure 5
(a) Cycling performance of the NCM811|Gr full-cells using EC/DMC (1:4, v/v) with 1 mol/L LPF and EC/DMC (1:1, v/v) with 1 mol/L LPF at 3 C. Voltage curves of the NCM811|Gr full-cells using (b) EC/DMC (1:4, v/v) with 1 mol/L LPF and (c) EC/DMC (1:1, v/v) with 1 mol/L LPF at 3 C.

 DownLoad:

 下载:
下载:


 下载:
下载:
