Citation:
He Ma, Kang Liang, Weizong Wang, Zhengping Ding, Lin Shi, Yurong Ren, Qian Zhao, Shoukun Xu. Enhanced low-temperature performance of Si/C composite anode materials with graphite (1010) surface: Insights from DFT and AIMD simulations[J]. Chinese Chemical Letters,
2026, 37(7): 111125.
doi:
10.1016/j.cclet.2025.111125
Enhanced low-temperature performance of Si/C composite anode materials with graphite (1010) surface: Insights from DFT and AIMD simulations
English
Enhanced low-temperature performance of Si/C composite anode materials with graphite (1010) surface: Insights from DFT and AIMD simulations
School of Materials Science and Engineering, Changzhou Key Laboratory of Intelligent Manufacturing and Advanced Technology for Power Battery, Changzhou University, Changzhou 213164, China
b.
School of Computer Science and Artificial Intelligence, Changzhou University, Changzhou 213164, China
Received Date:
03 January 2025 Accepted Date:
20 March 2025 Revised Date:
05 March 2025 Available Online:
15 July 2026
Abstract:
Silicon/graphite (Si/C) composites, which combine the advantages of Si anodes and commercial graphite anodes, are promising anode materials for high-energy-density lithium-ion batteries (LIBs). Despite experimental and theoretical studies on the electrochemical characteristics of different silicon crystal surfaces, there have been limited investigations on the electrochemical and mechanical properties of Si composite anode materials with different graphite crystal planes, such as the electrode interfaces between Si(111) and graphite (0001), as well as amorphous Si and graphite (1010). In this study, models of Si/C anode interfaces for LIBs were constructed to explore the mechanical-electrochemical-low-temperature performance by density functional theory (DFT) calculations and ab initio molecular dynamics (AIMD) simulations. The calculation results indicate that upon Li intercalation into the graphite (1010) surface, the electrical conductivity, electrochemical adsorption, and interfacial mechanical strength of the Si/C composite are significantly enhanced, with a separation work that is 2.3 times higher than that of Si/C on the graphite (0001) surface. More importantly, AIMD simulations at low temperatures reveal that the interface between graphite (1010) and amorphous Si forms a solid electrolyte interphase (SEI) rich in organic components, which significantly improves the Li-diffusion kinetics. This discovery provides new insights for the design and optimization of Si/C anode materials for low-temperature LIBs.
The Si anode has emerged as one of the most potential anode materials for lithium-ion batteries (LIBs) due to its high capacity and abundant crustal abundance [1–5]. However, the widespread application of Si anode is constrained by several formidable challenges. These include mechanical volume changes during alloying with Li, instability of the solid electrolyte interface (SEI) resulting in irreversible capacity loss [6–8], and difficulties associated with Li-ion migration and desolvation at low temperatures, all of which are particularly difficult to overcome [9]. To address the challenges of Si anodes, a widely used strategy is to combine high-capacity Si with graphite, forming silicon-carbon (Si/C) composites. This approach improves overall performance and stability [10–14]. In Si/C anodes, graphite enhances structural stability, while nanoscale Si reduces pulverization, extending battery cycle life [15–17]. Currently, experimental Si/C anodes LIBs attained remarkable results, including high coulomb efficiency [18,19] and long cycle life [20,21].
Recently, the interface issues within the Si/C anode have been extensively investigated. Through both theoretical and experimental approaches, anisotropic electrochemical behaviors pertaining to various crystallographic orientations of Si anodes have been investigated and reported, elucidating the superior reversibility and relatively homogeneous kinetics exhibited of the Si(111) surface [22,23]. Shen et al. studied the configuration, electronic properties, and Li-intercalation behavior of Si nanoclusters deposited on monolayer graphene [24]. Wang et al. designed and reported the silicene-derived g-SiC5 material, with first-principles calculations revealing a theoretical capacity of up to 1520 mAh/g, which facilitates high electronic and Li+ conductivity, enabling high-rate performance with negligible volume expansion [25]. The Ouyang’s team investigated the influence of the distance between the Si surface and monolayer graphene in the Si/C anode on the lateral migration of Li+. As the distance decreased from 4.715 Å to 3.844 Å, the Li+ migration barrier also decreased from 0.115 eV to 0.067 eV, and the Li+ migration coefficient at 300 K was calculated to be 2.50 × 10⁻⁵ cm2/s [26]. Meanwhile, crystalline plane-oriented etching engineering of graphite anode materials has been utilized in low-temperature studies for LIBs [27]. These research findings provide a solid theoretical foundation for the rational design of Si/C composites as novel anode materials for high-performance LIBs.
Furthermore, numerous studies have demonstrated that due to the anisotropic crystal growth, the graphite (1010) and (0001) crystal planes exhibit varying degrees of atomic packing density and binding forces along different directions, resulting in distinct physical, electrochemical and mechanical properties [28–30]. While extensive studies have been devoted to the investigation of the Si/C anode, studies on the diverse graphite crystal planes at the Si/C interface remains inadequate. The physical intercalation mechanisms, interfacial effect, and composition of the SEI film at low temperatures for graphite with different crystal planes in contact with Si or Li have not been thoroughly explored.
In this study, atomic-scale simulations based on density functional theory (DFT) were conducted to gain insights into the intercalation and electrochemical activity within graphite/Li/Si composites featuring different crystal planes. A systematic analysis was performed on the interactions between crystalline silicon (Si(111)), amorphous silicon (a-Si), and graphite surfaces, specifically the (0001) surface (C(0001)) and the (1010) surface (C(1010)), with Li, as well as the evolution of the SEI film at low temperatures. Results show that the a-Si/C(1010) anode interface exhibits improved low-temperature performance, electrochemical properties, and mechanical stability compared to Si(111)/C(0001) after Li intercalation. This work provides valuable insights for designing graphite and Si materials as high-capacity, high-stability electrode composites for LIBs in low-temperature applications.
All DFT calculations and ab initio molecular dynamics (AIMD) simulations were performed using the Vienna Ab-initio Simulation Package (VASP) software. The Si(111) surface with an FCC structure was optimized using the DFT method to form the Si(111)/C(0001) surface with graphite (0001). The parameters for Si(111)/C(0001) are a = 13.03 Å, b = 7.53 Å, and c = 15.07 Å, resulting in a lattice mismatch of 4.07%, which is within the acceptable tolerance of 5%. For the C(1010) surface, relaxation was applied to the Si atoms in the 32-atom Si(111) configuration. The atoms were randomized from their initial crystalline configuration. After relaxation, the a-Si/C(1010) interface was constructed with graphite (1010), yielding parameters of a = 12.7825 Å, b = 6.8 Å, and c = 35 Å, with a lattice mismatch of only 1.05% (Fig. S1 in Supporting information). The electrochemical stability of both Si/C anode configurations was verified. The stability of Li intercalation at different locations within the Si/C composite material was represented by the Li binding energy (ΔE), which is expressed as [31]:
where ELi+Si/C represents the total energy of the structure after Li intercalation into Si(111)/C(0001) or a-Si/C(1010). ESi/C denotes the energy of the Si/C structure prior to Li intercalation, and Ebulk-Li is the energy of a single Li atom. For the calculation of charge differences, the POTCAR settings were configured using the Projector Augmented Wave (PAW) method [32] within the Perdew-Burke-Ernzerhof (PBE) approximation [33]. The formula for charge density difference is [34]:
where ρLi+Si/C, ρLi, and ρSi/C represent the charge densities of the Si/C anode after Li intercalation, the charge density of Li in the same framework, and the charge density of the Si/C anode, respectively. To further investigate the interface evolution process between the composite Si/C anode and electrolyte at low temperatures, the simulation box was filled with ethylene carbonate (EC), ethyl methyl carbonate (EMC), diethyl carbonate (DEC), fluoroethylene carbonate (FEC), and lithium hexafluorophosphate (LiPF6), with each component being added in accordance with their actual proportions and densities. The optimized structure alleviated intermolecular stresses, yielding a Si/C||electrolyte interface that closely approximates reality.
The plane-wave cutoff energy of 500 eV was employed, with an energy convergence criterion of 10–5 eV for electronic self-consistent iterations and 0.01 eV/Å for ionic step convergence. After optimization, a 2 × 3 × 2 K-point grid centered at the Γ-point was used for the Si(111)/C(0001) structure, and a 2 × 2 × 1 K-point grid centered at the Γ-point with a Gaussian broadening of 0.05 eV was adopted for the a-Si/C(1010) structure.
For the AIMD studies, the canonical ensemble (NVT) was employed with temperature control via the Nosé-Hoover thermostat. The energy cutoff for plane-wave expansion was set to 450 eV. All structural optimizations adhered to convergence criteria, namely, residual forces <0.01 eV/Å and energy changes per atom <10–5 eV. A Gaussian smearing method with a broadening parameter of 0.5 was applied. In the Monkhorst-Pack scheme, a 2 × 1 × 1 K-point grid was used for AIMD simulations to sample the Brillouin zone. The simulation time step was set to 1 fs. An electric field of 0.07 eV/Å was applied along the Z-axis to the electrolyte/electrode model to simulate electric field effects related to battery charging [35–37]. Quantitative analysis of electronic charge changes during SEI film growth at low temperatures was performed using Bader charge analysis, which determines the Bader total charge around atoms defined by zero-flux surfaces. The random migration of Li at the Si/C anode interface can be described statistically using the mean square displacement (MSD). The MSD is calculated using the following formula [38]:
$
M S D=\left\langle\left[r_i\left(t+t_0\right)-r_i\left(t_0\right)\right]^2\right\rangle=\frac{1}{N} \sum\limits_{i=1}^N\left[r_i\left(t+t_0\right)-r_i\left(t_0\right)\right]^2
$
(3)
where N represents the total number of Li, the angular brackets denote the statistical average, ri(t + t0) and ri(t0) are the displacements of the Li at t + t0 and t0 times. The diffusion coefficient DLi at a particular pressure is derived from the slope of the MSD according to the Einstein relation [26].
$
D=\lim \limits_{t \rightarrow \infty} \frac{M S D}{d t}
$
(4)
where t represents the total diffusion time and d denotes the dimensionality. To analyze the mechanical stability of Si/C, the separation work of Si/C composites with various structures was calculated, the formula for calculating the separation work is as follows [39]:
Wsep=EslabSi+EslabC−ESi/CAi
(5)
where the total energy of different the lithiation degrees is denoted as ESi/C, and Ai is the contact area between the graphite layer and the Si layer.
During the alloying and intercalation reactions of Li in Si/C anodes, the preferred reaction sites are the interlayer positions at the Si/C interface, particularly within graphite hexagonal rings and at graphite C–C bridge sites, followed by the interior of the graphite, and finally alloying with Si, which leads to silicon lattice distortion (Fig. S2 in Supporting information). Our findings align with experimental observations, revealing different lithiation potentials for silicon and graphite in Si/C anodes, with graphite lithiation occurring at 0.1–0.2 V vs. Li/Li+ and Si lithiation at 0.3–0.5 V vs. Li/Li+. Therefore, during charging, Li intercalation preferentially occurs in the graphite region, followed by the Si region [40]. This further validates the authenticity and rationality of our Si/C interface model.
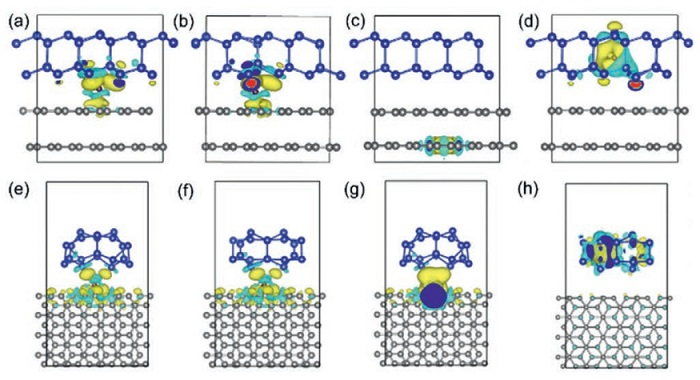
The differential charge density analysis was used to investigate changes in charge distribution, and the results are shown in Fig. 1. The cyan regions represent charge depletion, while the yellow regions indicate charge accumulation. Figs. 1a and b clearly show charge transfer at the Si(111)/C(0001) interface, with Li intercalation into the graphite layer leading to charge accumulation and the formation of strong chemical bonds. In contrast, Figs. 1c and d demonstrate an electron shielding effect at the Si(111)/C(0001) interface, where Li intercalation into the Si lattice fails to induce interfacial charge redistribution, leading to reduced electron conduction [39].
Figure 1
Figure 1.
Differential charge density of the Li intercalation at various positions in Si(111)/C(0001) anode: (a) Top of C; (b) C–C bridge site; (c) within graphite hexagonal ring and (d) center of Si tetrahedron. Charge differences of Li intercalation at various positions in a-Si/C(1010) anode: (e) Top of C; (f) C–C bridge site; (g) graphite hexagonal ring and (h) center of Si tetrahedron.
For the a-Si/C(1010) anode (Figs. 1e-g), the shielding effect is suppressed due to abundant dangling bonds and defects at the C(1010) interface. Notably, Li intercalation within graphite hexagonal rings establishes clear charge transfer pathways between Si and graphite layers, accompanied by robust covalent bond formation (Fig. 1g). This configuration enables graphite to contribute capacity while dangling bonds enhance electronic conductivity and stability.
Direct Li intercalation into the Si layer (Figs. 1d and h) also triggers shielding effects. Compared to Si(111)/C(0001), the a-Si/C(1010) anode possesses a more complex interface, exhibiting lower binding energy upon Li binding, a more stable structure, and more active electrons, which collectively enhance the electronic conductivity of Si-based materials.
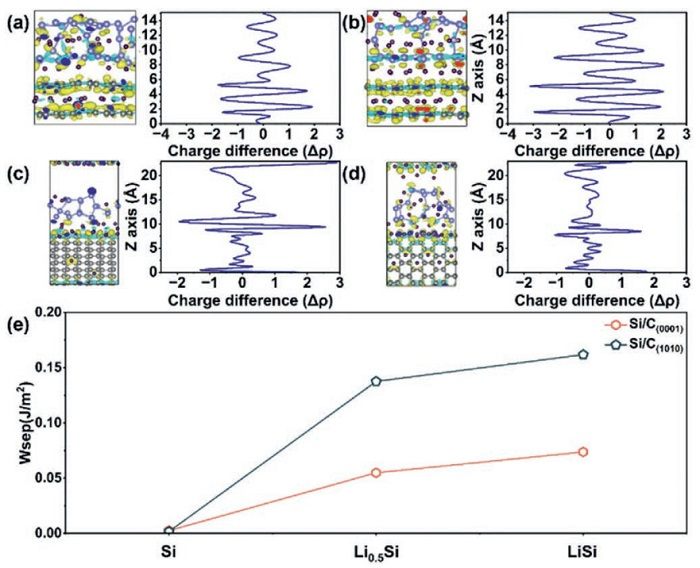
Using AIMD simulations, we investigate the separation work of Si/C interfaces under various degrees of lithiation, thereby exploring the mechanical performance of these interfaces. Additionally, we conduct a detailed study on the Li extraction and intercalation processes at the Si/C anode interface. The snapshots of the Li0.5Si(111)/C(0001), LiSi(111)/C(0001), Li0.5a-Si/C(1010), and Lia-Si/C(1010), along with corresponding differential charge analyses along the Z-axis and separation work calculations are shown in Fig. 2. Snapshots of the Si(111)/C(0001) interface in Figs. 2a and b reveal a significant electron shielding effect at the interface. In contrast, snapshots of the a-Si/C(1010) interface in Figs. 2c and d show abundant charge accumulation regions, with electrons having more transmission pathways, indicating superior electronic conductivity of the a-Si/C(1010) anode. Differential charge analysis along the Z-axis further confirms that electrons at the a-Si/C(1010) interface are more active.
Figure 2
Figure 2.
The lithiation results of Si/C anodes, along with the differential charge distribution along the Z-axis, after 10 ps AIMD simulations for the following configurations: (a) Li0.5Si(111)/C(0001); (b) LiSi(111)/C(0001); (c) Li0.5a-Si/C(1010) and (d) Lia-Si/C(1010). (e) Values of separation work under various degrees of lithiation.
Furthermore, the separation work of two Si/C structures under different degrees of lithiation were calculated (Fig. 2e). A higher calculated value indicates greater difficulty in separating the materials and better stability. The results demonstrate that as the separation work increases, the mechanical toughness also increases. The initial separation work values for Si(111)/C(0001) and a-Si/C(1010) are 0.003 and 0.002 J/m2, respectively, suggesting that there is little difference in mechanical properties between the two before lithiation. During the lithiation process, the inserted lithium atoms become positively charged lithium ions, which attract graphite through Coulombic forces, leading to a continuous increase in separation work. After inserting 1 mol of Li into a-Si/C(1010), the separation work value becomes 2.3 times that of Si(111)/C(0001). Therefore, from a mechanical perspective, the a-Si/C(1010) composite structure can exhibit stronger cycling performance.
To evaluate the low-temperature performance of Si(111)/C(0001) and a-Si/C(1010) composite anodes, the Si/C||electrolyte interfaces were constructed. Subsequently, AIMD simulations were performed to study SEI film formation. FEC decomposition was focused on at the anode-electrolyte interface, and we compared our findings with previous work (Fig. 3) [41,42].
Figure 3
Figure 3.
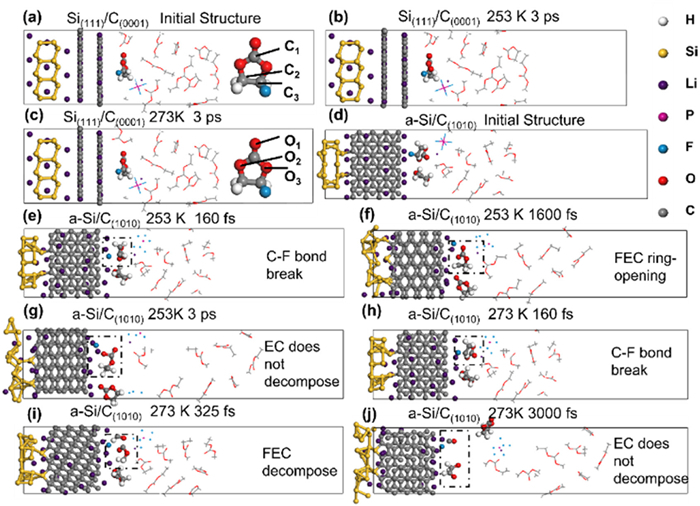
Evolution of the Si/C||electrolyte interface at low temperatures (253 K and 273 K) via 3 ps AIMD Simulations. Si(111)/C(0001)||electrolyte: (a) Initial structure; (b) After 3 ps at 253 K; (c) After 3 ps at 273 K. a-Si/C(1010)||electrolyte interface: (d) Initial structure; (e) After 160 fs at 253 K; (f) After 1.6 ps at 253 K; (g) After 3 ps at 253 K; (h) After 160 fs at 273 K; (i) After 325 fs at 273 K; (j) After 3 ps at 273 K. Color code: Hydrogen (white), silicon (yellow), carbon (gray), oxygen (red), phosphorus (pink), lithium (purple), and fluorine (cyan).
AIMD simulations of the initial Si(111)/C(0001)||electrolyte structure revealed no FEC decomposition after 3 ps of relaxation at low temperatures (Figs. 3a-c).
Figs. 3d-g show the initial structure of the a-Si/C(1010) interface and its evolution at 253 K. At 160 fs, Li+ ions attack the C1–O1 bond in FEC, triggering electron transfer and C3-F bond cleavage (Fig. 3e). By 1600 fs, FEC undergoes ring-opening via C3–O3 bond scission (Fig. 3f), ultimately decomposing into LiF and ·OCOOCH2CH (Fig. 3g).
Figs. 3h-j depict the evolution of the a-Si/C(1010) interface at 273 K. Fig. 3h shows that at 160 fs, the C3-F bond in FEC breaks. Fig. 3i displays that at 325 fs, FEC undergoes ring-opening, and the C1–O2 and C1–O3 bonds also break, forming a CO group and an •OC2H3O fragment. This decomposition pattern is consistent with previous reports by Pan [43]. The SEI evolves further under electric fields, forming CH2OCHOLi, LiF, and CO (Fig. 3j). Therefore, FEC remains confined and does not decompose at the Si(111)/C(0001) interface, leading to poor low-temperature performance. In contrast, FEC preferentially decomposes at the a-Si/C(1010) interface, protecting the electrolyte solvent. Rich organic components are generated in both SEI films. These organic fragments further polymerize on the SEI film surface to form soluble cross-linked structures, which can inhibit silicon expansion and stabilize the SEI film [41,42,44]. Furthermore, in simulations of SEI film growth at the a-Si/C(1010)||electrolyte interface, Si exhibits a maximum volumetric expansion of 110.3%. This value is notably lower than typical Si-based anodes in practical applications, the C(1010) mitigates Si expansion, albeit at the expense of capacity.
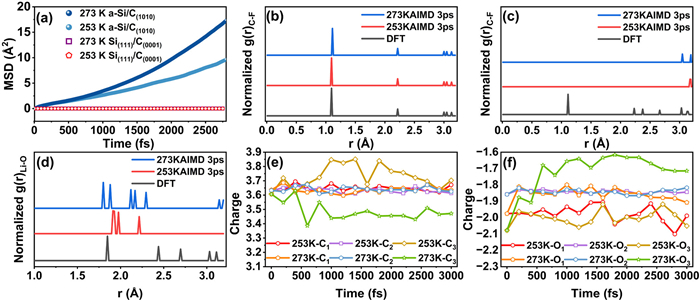
To further investigate the structural characteristics of the a-Si/C(1010) interface, we conducted studies on the MSD of Li, radial distribution functions (RDFs) for C-F and Li-O pairs, and Bader charge analysis of C and O atoms (Fig. 4). By analyzing the MSD of Li at two types of Si/C interfaces, the diffusion coefficients of Li are calculated at various temperatures and interfaces (Fig. 4a). At low temperatures, the diffusion coefficient of Li at the Si(111)/C(0001) interface is below 10–15 cm2/s, indicating poor Li migration due to the low temperature and poor interfacial conductivity. At 273 K, the diffusion coefficient of Li at the a-Si/C(1010) interface is 9.19 × 10⁻⁵ cm2/s, while at 253 K, it is 6.32 × 10⁻⁵ cm2/s, which is close to previously reported values [26]. Therefore, the a-Si/C(1010) anode material exhibites better low-temperature performance.
Figure 4
Figure 4.
Structural characteristics of the Si/C interface: (a) MSD of Li at low temperatures. In the Si(111)/C(0001)||electrolyte interface system: (b) The radial distribution function (RDF) for C-F atoms; In the a-Si/C(1010)||electrolyte interface system: RDFs for (c) C-F and (d) Li-O atom Pairs; (e) Charge evolution of C atoms; (f) Charge evolution of O atoms.
Fig. 4b shows the RDF between C and F atoms at the Si(111)/C(0001) anode interface, indicating no breakage of the C-F bond. Figs. 4c and d display the RDFs for C-F and Li-O atoms at the a-Si/C(1010) anode interface, respectively, with the breakage of the C-F bond indicating the decomposition of FEC molecules. At 273 K, the first and second g(r) peaks for Li-O pairs were observed at 1.80 Å and 1.88 Å, respectively, while at 253 K, they were located at 1.93 Å and 1.98 Å, with the first peak of initial structure at 1.85 Å. This suggests the initial formation of the SEI film at the a-Si/C(1010) anode interface.
To further understand the charge evolution during the formation of the SEI film at the low-temperature a-Si/C(1010) anode, Bader analysis was used to investigate the charges surrounding C and O atoms (Figs. 4e and f).
The FEC molecule’s most reactive site is C3 (F-bonded), as shown in Fig. 4e. After 3 ps of AIMD simulation at 253 K, C3 lost 0.1 e, while after 3 ps of AIMD simulation at 273 K, C3 gains 0.13 e. This corresponds to different decomposition products, with sp3-hybridized C3 losing electrons during the simulation at 253 K and C3═O gaining electrons during the simulation at 273 K. Fig. 4f also indicates that different temperatures lead to differences in the composition of the SEI film. At 253 K and 1600 fs, O1 and O3 in FEC were observed to gain 0.12 e and 0.11 e, respectively, indicating ring-opening decomposition of FEC, which is consistent with the previous results in Fig. 3f. Fig. 4f also shows that within the first 600 fs, the charge surrounding O3 increases from −2.07 e to −1.67 e, which is related to the formation of organic components of the SEI film from the decomposition of FEC.
Compared to pure Si anodes, where uncontrolled SEI growth and mechanical degradation dominate at low temperatures, the a-Si/C(1010) composite leverages its defective carbon matrix to regulate SEI composition and uniformity. The LiF-rich SEI (Figs. 3g and j) enhances ionic conductivity as evidenced in Fig. 4a. Furthermore, unlike conventional graphite anodes, which suffer from Li plating and sluggish kinetics [45–47], the a-Si/C(1010) interface promotes kinetically favorable FEC decomposition, ensuring rapid Li+ desolvation and reduced interfacial resistance. This defect-engineered strategy uniquely balances capacity retention and low-temperature adaptability, surpassing the limitations of both pure Si and graphite systems.
This study investigates the Li insertion behavior and the composition of SEI films at low temperatures for Si(111)/C(0001) and a-Si/C(1010) anode interfaces using DFT calculations and AIMD simulations. When comparing the a-Si/C(1010) and Si(111)/C(0001), we observed significant differences. The a-Si/C(1010) interface is abundant in structural defects, which serve as active sites to facilitate Li+ adsorption and electron transfer, reducing the activation energy for FEC decomposition. In contrast, the ordered Si(111)/C(0001) interface lacks such defects, resulting in weak electron localization and a lack of driving force for FEC decomposition. From a kinetic perspective, the defects at the a-Si/C(1010) interface induce Li+ migration, accelerating the rupture of the solvation shield and promoting direct intercalation between Li+ and FEC, thereby forming a hybrid organic-inorganic bilayer SEI through kinetically favorable pathways. Conversely, the Si(111)/C(0001) interface inhibits FEC activation, exacerbating interfacial resistance. Furthermore, the defect-rich a-Si/C(1010) interface maintains high FEC decomposition activity at low temperature, whereas the Si(111)/C(0001) interface, lacking active sites, is temperature-sensitive, resulting in SEI passivation. Therefore, these different SEI formation mechanisms originate from the interplay between a-Si/C(1010) and Si(111)/C(0001). Defect-rich interfaces enable targeted FEC decomposition, SEI stabilization, and enhanced low-temperature performance, highlighting the critical role of atomic-level interface engineering in Si/C anode design.
The differential charge density analysis highlights that interfacial atomic configuration critically govern charge transfer and electron shielding effects in Si/C composites. The weakened shielding at defective a-Si/C(1010) interfaces, driven by dangling bonds, enables robust covalent bonding and enhanced electron conduction. This underscores the importance of tailoring defect-rich interfaces to mitigate electron shielding, optimize Li+ pathways, and stabilize composite structures. These insights provide a design principle for high-performance Si-based anodes: engineering disordered or defective carbon matrices to synergistically improve conductivity, capacity, and structural integrity.
Furthermore, after Li intercalation into the a-Si/C(1010) structure, the separation work significantly increases, being 2.3 times that of the Si(111)/C(0001) anode. Consequently, the a-Si/C(1010) anode exhibits more stable cycling performance. More importantly, simulations of the Si(111)/C(0001)||electrolyte interface at low temperatures reveal no formation of SEI film components. However, the a-Si/C(1010)||electrolyte interface, after undergoing AIMD simulations, produces essential SEI film components such as LiF and CH2OCHOLi, with more pronounced lithium-ion diffusion behavior at the interface. This suggests superior low-temperature performance for the a-Si/C(1010) anode.
To guide future designs, we propose three optimization strategies: (1) Defect engineering to amplify interfacial charge delocalization; (2) Surface functionalization of graphite to stabilize LiF-rich SEI; (3) Hybrid interface design. Combining amorphous Si with defective carbon surfaces promotes hybridization of electronic states. Future studies should prioritize synthesis of defect-rich C(1010) matrices, in situ characterization of SEI evolution at subzero temperatures, and machine learning-guided interface design to improve ionic/electronic transport. These efforts will bridge theoretical insights with practical Si/C anode manufacturing. In summary, Si/C composites with the graphite (1010) surface is a promising anode material that enhances the low-temperature stability, electronic conductivity, and mechanical stability of lithium-ion batteries.
Declaration of competing interest
The authors declare that they have no known competing financial interests or personal relationships that could have appeared to influence the work reported in this paper.
This work was supported by the National Natural Science Foundation of China (Nos. U22A20420, 52203292, 52203291), the Program for International S&T Cooperation Projects of Changzhou City (No. CZ20240026).
Supplementary materials
Supplementary material associated with this article can be found, in the online version, at doi:10.1016/j.cclet.2025.111125.
S.H. Pan, S. Nachimuthu, B.J. Hwang, et al., Colloid Interface Sci. 649 (2023) 804–814.
[44]
Y. Jin, N.J.H. Kneusels, P.C.M.M. Magusin, et al., J. Am. Chem. Soc. 139 (2017) 14992–15004. doi: 10.1021/jacs.7b06834
[45]
Y. Wang, J. Liu, H. Ji, et al., Adv. Mater. 37 (2025) 2412155.
[46]
Y. Huang, C. Wang, H. Lv, et al., Adv. Mater. 36 (2024) 2308675.
[47]
C. Wei, H. Fei, Y. Tian, et al., Chem. Lett. 31 (2020) 980–983
Figure 1
Differential charge density of the Li intercalation at various positions in Si(111)/C(0001) anode: (a) Top of C; (b) C–C bridge site; (c) within graphite hexagonal ring and (d) center of Si tetrahedron. Charge differences of Li intercalation at various positions in a-Si/C(1010) anode: (e) Top of C; (f) C–C bridge site; (g) graphite hexagonal ring and (h) center of Si tetrahedron.
Figure 2
The lithiation results of Si/C anodes, along with the differential charge distribution along the Z-axis, after 10 ps AIMD simulations for the following configurations: (a) Li0.5Si(111)/C(0001); (b) LiSi(111)/C(0001); (c) Li0.5a-Si/C(1010) and (d) Lia-Si/C(1010). (e) Values of separation work under various degrees of lithiation.
Figure 3
Evolution of the Si/C||electrolyte interface at low temperatures (253 K and 273 K) via 3 ps AIMD Simulations. Si(111)/C(0001)||electrolyte: (a) Initial structure; (b) After 3 ps at 253 K; (c) After 3 ps at 273 K. a-Si/C(1010)||electrolyte interface: (d) Initial structure; (e) After 160 fs at 253 K; (f) After 1.6 ps at 253 K; (g) After 3 ps at 253 K; (h) After 160 fs at 273 K; (i) After 325 fs at 273 K; (j) After 3 ps at 273 K. Color code: Hydrogen (white), silicon (yellow), carbon (gray), oxygen (red), phosphorus (pink), lithium (purple), and fluorine (cyan).
Figure 4
Structural characteristics of the Si/C interface: (a) MSD of Li at low temperatures. In the Si(111)/C(0001)||electrolyte interface system: (b) The radial distribution function (RDF) for C-F atoms; In the a-Si/C(1010)||electrolyte interface system: RDFs for (c) C-F and (d) Li-O atom Pairs; (e) Charge evolution of C atoms; (f) Charge evolution of O atoms.

 DownLoad:

 下载:
下载:


 下载:
下载:
