Citation:
Weiyan Hou, Zonglin Yi, Hongtao Yu, Wanru Jia, Liqin Dai, Junjie Yang, Jingpeng Chen, Lijing Xie, Fangyuan Su, Cheng-Meng Chen. Fractal dimension revealed from SAXS as a descriptor of structural disorder in hard carbon anodes of sodium ion battery[J]. Chinese Chemical Letters,
2026, 37(7): 111124.
doi:
10.1016/j.cclet.2025.111124
Fractal dimension revealed from SAXS as a descriptor of structural disorder in hard carbon anodes of sodium ion battery
English
Fractal dimension revealed from SAXS as a descriptor of structural disorder in hard carbon anodes of sodium ion battery
chencm@sxicc.ac.cn (C.-M. Chen). 1 These authors contributed equally to this work.
Received Date:
20 January 2025 Accepted Date:
20 March 2025 Revised Date:
18 March 2025 Available Online:
15 July 2026
Abstract:
The disordered structure plays an essential role in high capacity of hard carbon. However, the lack of universal descriptor for characterizing the structural disorder of hard carbon limit advancements in understanding and optimizing its sodium diffusion performance in sodium ion batteries (SIBs). Herein, fractal dimension (D) revealed by small angle X-ray scattering (SAXS) is identified as a descriptor of hard carbon’s structural disorder under the data-driven methods, correlating it with electrochemical and structural features. Porod’s law, TEM and XRD are used to determine the correlation between D and the microstructure of hard carbon. The results reveal that as D increases, pseudo-graphitic domains decrease and carbon layers become more curved, which result in more closed pores. Meanwhile, the diffusion coefficient in different potential below 0.1 V vs. Na+/Na suggest that D are unfavorable to sodium ions diffusion as the diffusion coefficients decrease with D increase and result in a reduce of slope capacity percentage in SIBs. D are used in analyze the sodium ion storage behavior by ex-situ SAXS, which suggests that carbon layers with larger D have more structural defects as nucleation sites. In addition, theoretical plateau capacity utilization (TCU) is proposed based on D and reveal the accessibility of closed pore of hard carbon. This work provides a foundation for bridging the gap between structural characterization and practical performances, and guiding the structural design of hard carbon with high sodium storage and kinetic performance.
In recent decades sodium-ion batteries (SIBs) are considered as a promising alternative energy storage method to lithium-ion batteries, particularly in light of the limited availability of lithium resources and the growing demand for large-scale energy storage [1-3]. Hard carbon is a promising anode material for SIBs with a series of disordered structures such as defects, large interlayer distance, and abundant pores, which can provide high sodium storage capacity [4-7]. Therefore, finding ways to characterize structural disorder is important for modulating the structure of hard carbon and thus obtaining hard carbon materials with high reversible capacity. Several characterization methods can provide partial information about the structure, such as interlayer distance from XRD, degree of graphitization and defects from Raman, and open pores from gas adsorption and desorption. However, all of these characterization methods are deficient in scale range and cannot provide structural information across scales, so different characterization methods will support different sodium storage mechanisms and will not be able to describe structural disorder. Therefore, there is a need to find a cross-scale and universal method.
Small angle X-ray scattering (SAXS) is a cross-scale characterization method. The presence of electron density difference within a material leads to a small angle shift in the incident X-rays and thus to scattering, and the electron density difference at different scales leads to different angle shifts in the rays [8,9]. In the study of hard carbon, SAXS is often used as a characterization method to qualitatively assess the size and content of closed pores in a series of hard carbon samples, with higher peaks in the SAXS curve representing more pores, and peaks further to the right representing smaller pore sizes [10-12]. There are also a number of characteristic studies utilizing in situ small-angle X-ray scattering to explore the sodium storage mechanism of hard carbon. Morikawa et al. found a broad peak near q ≈ 2.0–2.1 Å−1 of the SAXS curve in the low-voltage region, suggesting that sodium is densely confined in the nanopore [13]. Iglesias et al. explored the order of filling of pores of different sizes during sodiated process by in situ small-angle X-ray scattering [14]. Meanwhile, a range of structural information at different scales can be obtained by model fitting of SAXS curves and data analysis. The basic Porod’s law and Guinier’s law can obtain information about the phase interface and the average grain size of the material, respectively [15,16], but these models are rather basic and have not yet been exposed to disorder. Simon et al. develop a full range of SAXS fitting models for carbon materials, where a variety of pore structural parameters can be obtained from the Teubner-Strey model in the middle Q section. The fa, which represents the connectivity of the pores, is considered a descriptor of the degree of disorder in the hard carbon [17]. Yun et al. used the porosity calculated by the Teubner-Strey model described above to obtain the coefficient of capacity utilization by comparing it to the Na volume fraction calculated from the capacity of plateau capacity of fully sodiated hard carbon, and found that the I2D/IG value describes the carbon layer’s looseness, representing the ease with which sodium ions can enter the hard carbon [18,19]. These studies or models analyze the microstructure of the material step by step in depth. Since the closed pores are surrounded by carbon layers, the study of disorder is exposed to carbon layer scale. However, the studies on the disorder of hard carbon are still limited to the scale of closed pores and do not reach the scale of carbon layer structure.
In this work, we find the fractal dimension (D) as a quantitatively generalized descriptor of the degree of disorder in hard carbon and explore the relationship between the D and the structure of hard carbon through a data-driven approach [20,21]. The D is proportional to the proportion of amorphous domains in hard carbon, which characterizes the degree of disorder in the arrangement of carbon layers. As a result, the increase of D leads to the deterioration of the sodium ion diffusion kinetics of the hard carbon, and consequently leads to a decrease in the capacity of the slope region and the percentage of the capacity of the slope region. In addition, we found the relationship between the sodium storage structure of hard carbon and the D, interlayer distance and porosity, which provides theoretical guidance for the structural design of hard carbon with high sodium storage and kinetic performance.
Materials characterization: The morphology of hard carbons was acquired using JEM-2100F High-resolution transmission electron microscope (HRTEM, JM-2001F, Japan). X-ray diffraction (XRD, D8 Advance, Bruker, Germany) and Raman microscopy (RENISHAW inVia Microscope Raman) were employed to characterize the microcrystalline structures and defects of HCs. Pore structure analysis was performed using CO2 as an adsorbent on a Micromeritics TriStar Ⅱ 3020 analyzer.
Electrochemical measurements: The electrodes were fabricated by applying a slurry of 93 wt% of active materials, 2 wt% of Super P, 2 wt% of carboxymethyl cellulose (CMC) and 3 wt% of styrene-butadiene rubber (SBR) to copper foil. The average loading mass of active materials was 5 mg/cm2. The CR2032 coin cells were assembled in a glove box (H2O, O2 < 0.1 ppm) with the electrodes, counter-electrodes (sodium metal), separators (glass fibers) and electrolyte (1.0 mol/L NaPF6 in EC/DEC = 1:1 wt%). The discharge and charge tests and galvanostatic intermittent titration technique (GITT) tests were conducted using the LAND CT2001 battery tester (LAND, Wuhan, China) within a voltage range of 0‒2 V. The discharge process was carried out by means of multiple discharges at small currents, in order to ensure complete sodiation of the hard carbon by repeated discharges to 0 V at 0.2 C, 0.15 C, 0.12 C, 0.08 C, 0.06 C, 0.05 C, 0.04 C, 0.03 C, 0.02 C, 0.015 C, 0.012 C, 0.01 C, 20 μA, and 10 μA in turn. Charge to 2 V at 0.1 C.
SAXS Analysis: SAXS curves in the range of 0.015–1.1 Å−1 were measured using Xeuss 2.0 (Xenocs) under Cu Kα radiation. The power is 30 W, the wavelength is 1.54189 Å, and the exposure time is 150 s. The detector is Pilatus 3R 300 K, with a single pixel size of 172 μm. All acquired SAXS curves were calibrated to volume scattering cross sections (I in cm−1) by the standard method of the NIST (National Institute of Standards and Technology) glassy carbon standard sample (SRM 3600, SN: A37), and then converted to specific scattering cross sections (I in cm2/g) by normalizing to the effective bulk density ρ, which was determined by the sample attenuation method.
Model fitting of SAXS curves: The mid-angle region of the SAXS data (scattering vectors ranging from 1 Å−1 to 10 Å−1) was fitted using the Teubner-Strey model developed by Damien Saurel et al. The fitting process aimed to accurately illustrate the internal pore structure of the material. A series of pore structure parameters are obtained from the model: fa is the pore’s connectivity, ξ is a correlation length that limits the extension of the order, r is the average pore radius, d is the pore-pore distance, and φ is the pore volume fraction. More details of the fit and calculations are available in Supporting information (Fig. S1 and Method S1 in Supporting information).
The fractal dimension is obtained by fitting the straight-line part from the tail of the middle part of the SAXS curve and the absolute value of its slope is the fractal dimension.
Creation of data sets: The dataset used in this study consists of 83 different hard carbon samples derived from both commercial and self-synthesized precursors. The precursors include biomass, asphalt, and coal, all of which were subjected to heat treatment at temperatures ranging from 1400 ℃ to 1500 ℃. Each sample was characterized by a total of 23 features, including 9 electrochemical performance characteristics (e.g., specific capacity, initial coulombic efficiency) and 14 structural characteristics (e.g., interlayer distance, true density), all obtained through experimental measurements.
Machine learning: To predict the target variable, we employed six machine learning models: Linear Regression, Support Vector Machine (SVM), Bayesian Regression, Random Forest, Decision Tree, and Extreme Gradient Boosting (XGBoost). Before model training, missing values in the dataset were imputed using the Mice Forest package, which applies multiple imputation by chained equations (MICE) with random forests. To ensure the reliability of the imputed data, we computed the Pearson correlation heatmaps for the dataset before and after data augmentation to evaluate the effect of imputation on variable relationships (Fig. S2 in Supporting information). The comparison revealed that the correlations between variables changed minimally after imputation, indicating that the data augmentation process preserved the intrinsic relationships among the dataset features and maintained high reliability.
After data imputation, the dataset was randomly split into a training set and a test set with a ratio of 80:20. Model training and hyperparameter tuning were conducted on the training set, and the test set was reserved for evaluating model performance. To ensure robust evaluation and minimize overfitting, five-fold cross-validation was applied during training, and model performance was assessed based on the variance (R2) and root mean square error (RMSE). Both metrics were calculated for the training and test sets to evaluate predictive accuracy. The RMSE was computed as:
where yi and $\hat{y}_i$ represent the observed and predicted values, respectively. Detailed hyperparameter configurations for each model are provided in Table S1 (Supporting information). All models were implemented using Python (version 3.12), leveraging the scikit-learn library for SVM, Random Forest, and Decision Tree, xgboost for XGBoost, and statsmodels for Linear Regression.
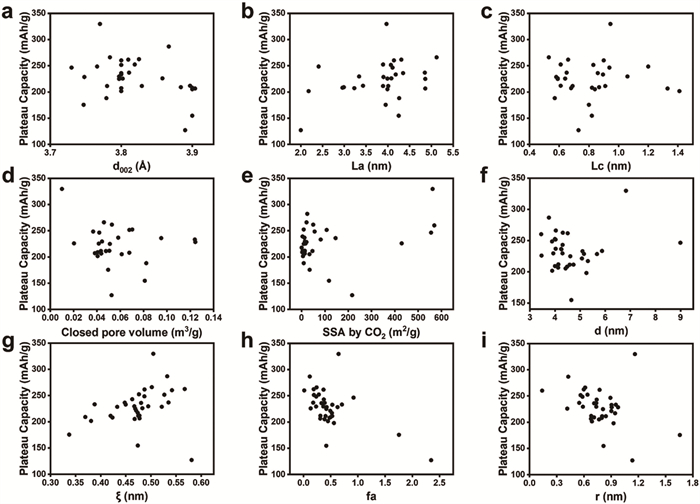
In past studies, the sodium storage mechanism in hard carbon anodes has been explored extensively, and the “adsorption-intercalation-pore filling” model is now widely recognized, from which the plateau capacity below 0.1 V is provided by intercalation and pore filling of Na [13,22-25]. However, the extensive statistical results of the structural and electrochemical performance of commercial hard carbon in Fig. 1 indicate that plateau capacity has poor correlations with closed pore volume or interlayer distance. Meanwhile, La and Lc representing microcrystalline structures, and specific surface area by CO2 adsorption and desorption tests, representing open pore structures, are not correlated with plateau capacity. The lack of correlation proves that closed pore volumes and interlayer distances cannot effectively characterize the micro-nano-scale disorder of hard carbon. Whereas the micro- and nanoscale is a very sensitive characterization range for small-angle X-ray scattering, we attempt to use SAXS fitting to get a series of structural parameters of hard carbon. The mid-angle region of the SAXS data (scattering vectors ranging from 1 Å−1 to 10 Å−1) was fitted using the Teubner-Strey model developed by Damien Saurel et al. [17]. The fitting process aimed to accurately illustrate the internal pore structure of the material. A series of pore structure parameters are obtained from the model: fa is the pore’s connectivity, ξ is a correlation length that limits the extension of the order, r is the average pore radius, d is the pore-pore distance, and φ is the pore volume fraction. More details of the fit and calculations are available in Supporting information (Fig. S1 and Method S1). The fractal dimension is obtained by fitting the straight-line part from the tail of the middle part of the SAXS curve and the absolute value of its slope is the fractal dimension. The correlations between structural parameters and the plateau capacity of hard carbon are shown in Fig. 1.
Figure 1
Figure 1.
The relationship among plateau capacity and structural parameters. (a) Interlayer distance. (b) Crystallite size along the a-axis. (c) crystallite size along the c-axis. (d) Closed pore volume. (e) Specific surface area for CO2 gas adsorption. (f–i) d, ξ, fa and r fitting from SAXS curve.
As shown in Figs. 1f–i, d and fa are concentrated from 3 nm to 6 nm and from 0 to 0.7, respectively, while r is concentrated from 0.5 nm to 1 nm, and none of them has a clear linear relationship with the plateau capacity. The above results indicate that the structural parameters related to graphite microcrystals and pore structure cannot characterize the disordered structure of hard carbon.
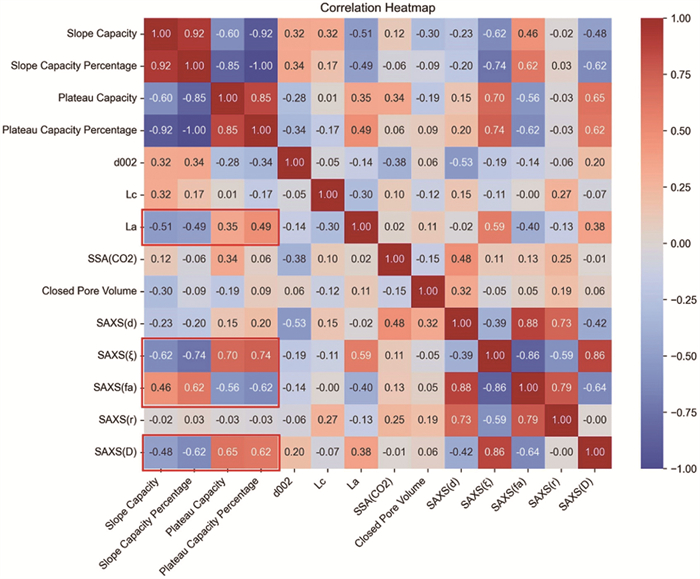
In order to discover more correlations between structure and performance of commercial hard carbon, we use Pearson’s correlation heatmaps to visually compare the correlation among structural characterization results and electrochemical capacity parameters. As shown in Fig. 2, we have found that the D has a relatively high correlation with the plateau capacity, slope capacity, and their percentage in commercial hard carbon, with a correlation coefficient of 0.65 with the plateau capacity, a lower correlation coefficient of 0.48 with the slope capacity, and a correlation coefficient of 0.62 with the percentage of slope capacity of the plateau region. And ξ also has a high correlation with capacity parameter. The Pearson correlation coefficient with the slope capacity is 0.62, with the plateau capacity is 0.70, and with the capacity percentage is as high as 0.74. Meanwhile, there are medium correlations between graphite La and capacity parameters, with correlation coefficients of 0.35 for La with plateau capacity, 0.51 with slope capacity and 0.49 with capacity share. Meanwhile, fa, as a disorder descriptor in the previous study [18], also has a relatively high correlation coefficient of 0.56 with the plateau capacity, 0.46 with the slope capacity and 0.62 with the percentage of capacity, which are in the medium correlation level. However, combining the scatter plots of Figs. 1b, g and h we find that the correlation between the two and the plateau capacity is not strong, and there are outliers or extreme values distorting the correlation coefficient, which leads to an increase in the correlation coefficient. It is important to note that the high correlation between the series of parameters obtained from the small-angle X-ray scattering fitting is due to the fact that the same parameters are used in the calculation of these parameters.
Figure 2
Figure 2.
Pearson correlation heatmap among structure and performance parameters of commercial hard carbon. The correlation between important factors and capacity are surrounded by a red boxed line.
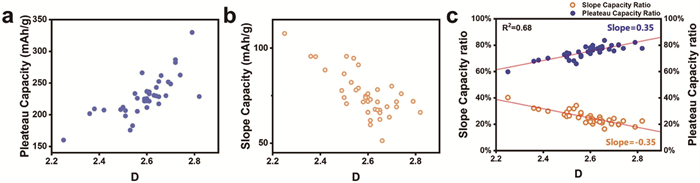
We present in Fig. 3 the D of the studied commercial hard carbon in relation to the plateau capacity, slope capacity and the percentage of plateau and slope capacity. The D distribution ranges from 2.25 to 2.82 and is concentrated between 2.5 and 2.7 in commercial hard carbon. Plateau capacity is the capacity below 0.1 V during discharging process of sodium-ion batteries, which is the main origin of the capacity of hard carbon anode. The plateau capacity of commercial hard carbon in Fig. 3a shows a clear upward trend with increasing D, from 160 mAh/g with D = 2.25 to 329.77 mAh/g with D = 2.79. The distribution of these plateau capacities is about 20–60 mAh/g with similar values of D. Slope capacity refers to the capacity of sodium-ion battery above 0.1 V. It reflects the continuous voltage change area during Na diffusion in discharging process, which has a direct influence on the kinetic performance and capacity of the battery. The results in Fig. 3b show that the slope capacity of the studied commercial hard carbon shows a decreasing trend with increasing D, decreasing from 107.7 mAh/g at D = 2.25 to ≈70 mAh/g at D ≈ 2.8. The percentage of plateau capacity and slope capacity can reflect the contribution of the plateau and slope region to the total capacity, and the results in Fig. 3c show that the overall plateau capacity ratio for commercial hard carbon is greater than 60%, which is consistent with the results of previous studies. As the D increases, the plateau capacity ratio increases from ≈60% to >80%, while the slope capacity ratio decreases from ≈40% to <20%. It is worth noting that the correlation between the D and the capacity percentage is much stronger compared to the absolute value of the capacity, indicating D can be used as a descriptor of the capacity percentages.
Figure 3
Figure 3.
Correlation between fractal dimension and electrochemical performance. (a) Plateau capacity, (b) slope capacity, (c) the percentage of slope capacity and plateau capacity.
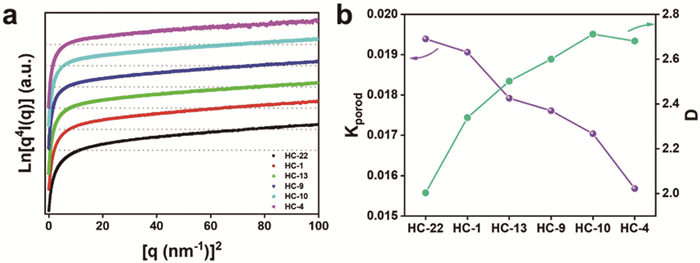
In the following, we further explore the structural information revealed by the fractal dimension in hard carbon in conjunction with various characterization methods and theories. In Fig. 4, we analyze SAXS results of hard carbon via Porod’s law analyze whether the phase interfaces within hard carbon are sharp or not and their causes [26].
Figure 4
Figure 4.
(a) The Porod curve of 6 selected commercial hard carbon with different D. (b) Trends in D and Porod’s slope.
When the system that produces the scattered signal has a sharp phase interface, the linear part in Porod curve will be horizontal. Otherwise, the curves will be shifted upward, which means another scattered signal existed. Fractal dimension is a mathematical and geometric concept that represents the self-similarity across scales and can reflect the ability of shapes to fill space up [8,9,27,28].
We select a series of six commercial hard carbon materials with different fractal dimensions and compare their Porod curves obtained from their SAXS results to find the origin of the fractal dimension of hard carbon. We present the Porod curves for these commercial hard carbons in Fig. 4a. It is clear that the Porod curves of all the commercial hard carbons shift upward, indicating that there is no sharp phase interface in the scattering regime of the hard carbon between the carbonaceous phase and the pores. At the same time, it suggests that the microstructure of the carbon material has smaller-sized regions of electron density inhomogeneity in addition to the micropores, i.e., small-scale disordered structures at the interface are created when the carbon layers are bent and crosslinked. This result is consistent with the short-range ordered but long-range disordered structural characteristics of hard carbon materials.
In order to compare the Porod curve quantitatively, we fit the linear part of the Porod curve, thus obtaining the slope which reveals small-scale disordered structures. Fig. 4b shows the slope of the Porod curve versus the fractal dimension, and we find that the positive offset of Porod’s law decreases as the fractal dimension increases. This indicates that this small-scale inhomogeneous region of electron density is decreasing as the fractal dimension increases.
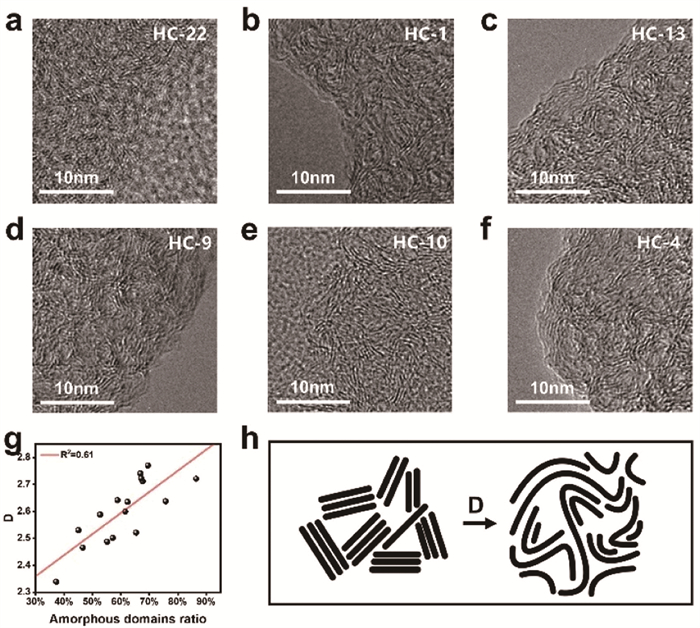
In order to investigate the reason behind this negative correlation, we have analyzed and compared the TEM images of these commercial hard carbons [29,30]. As shown in Figs. 5a–f, commercial hard carbons with different fractal dimensions exhibit completely different microstructural morphologies. The fractal dimensions of these six commercial hard carbons are 2.03, 2.25, 2.50, 2.60, 2.68 and 2.71, respectively. It is obvious that the smaller the fractal dimension of the hard carbon, more parallel-arranged graphite microcrystalline structures exist. When the fractal dimension is as small as 2.03, the TEM image shows a character with more pseudo-graphitic domains, which contains less curved carbon layers and favors the diffusion of sodium ions in the interlayers, resulting in a higher slope capacity of the hard carbon. At the same time, as the fractal dimension increases, pseudo-graphitic domains decrease and the layers become more curved, thus enclosing into richer closed pores, which provide a higher plateau capacity. As a supplement, the diffusion coefficients of different commercial hard carbons at different potentials below 0.1 V are compared in Fig. S4 (Supporting information). It is obvious that the diffusion coefficients for all potentials except 0.08 V decrease with the increase of D, indicating that the increase in fractal dimension is unfavorable to the diffusion of sodium ions. Meanwhile, the upward trend at 0.08 V indicates that it is easier to enter the carbon phase as D increase because there will be more diffusion paths.
Figure 5
Figure 5.
(a–f) TEM images of 6 selected commercial hard carbons. (g) correlation between D and the percentage of amorphous domains fitting from XRD. (h) Schematic of the variation of carbon layer structure with fractal dimension.
The X-ray diffraction patterns of hard carbon exhibits broadened peaks due to its long-range disordered nature. In order to distinguish the contribution of pseudo-graphitic and amorphous domains, the (002) peaks of hard carbon are divided into three parts based on the interlayer distance: (1) The graphitic domains with d < 0.36 nm, a structure which is unable to provide Na storage capacity, (2) the pseudo-graphitic domains with 0.36 < d < 0.4 nm, a structure with mostly paralleled carbon layers and larger interlayer distance, (3) amorphous domains with d > 0.4 nm, which includes large interlayer distances due to turbostratic carbon layers and closed pores [23,31]. Fig. S3 (Supporting information) shows the classical commercial hard carbon XRD peak fitting results, where the red and blue regions represent the amorphous and pseudo-graphitic domains, respectively. All commercial hard carbons have few graphite-like region peaks.
According to the comparison results of TEM, we have found connections between D and structural disorder. Therefore, we further compare the areal percentage of amorphous domains obtained from XRD peak fitting and fractal dimension. As shown in Fig. 5g, the percentage of the amorphous region and fractal dimension show a very obvious positive correlation, and with the increase of the percentage of amorphous region, the fractal dimension increases from 2.3 to 2.8. Based on these findings, we propose a mechanism for the microstructural evolution of hard carbon as the fractal dimension increases. As shown in Fig. 5h, with the increase of D, pseudo-graphite domains are decreasing with the increasing of amorphous domains that form due to the bending of the carbon layer with a large number of closed pores. The increase of closed pores and turbostratic carbon layers provide more sodium ions storage sites which leads to an increase of plateau capacity percentage [32,33]. At the same time, the diffusion of sodium ions is blocked, result in poor kinetic performance and decrease of slope capacity percentage [34].
In summary, the fractal dimension can be used as a descriptor of hard carbon disorder, which is related to the disordered carbon layers and is strongly correlated with the percentage of the plateau and the slope region. With the increase of fractal dimension, the microstructure of hard carbon changes from relatively parallel-arranged carbon layers to curved ones with widely different orientations, which leads to the formation of more closed pores with high plateau capacity percentage, but complex diffusion path of sodium ions that results in sluggish ionic diffusion and low slope capacity percentage. Relatively, hard carbon with smaller fractal dimensions has a more ordered microstructure, which limit the storage of sodium ions but in favor of the diffusion, leading to a higher slope capacity percentage and a higher ICE [35,36]. The electrochemical properties of many soft carbons show good kinetic properties, and the fact that the fractal dimensions of soft carbons are usually 2 and below is a further evidence of the effect of fractal dimension on the kinetics [37,38].
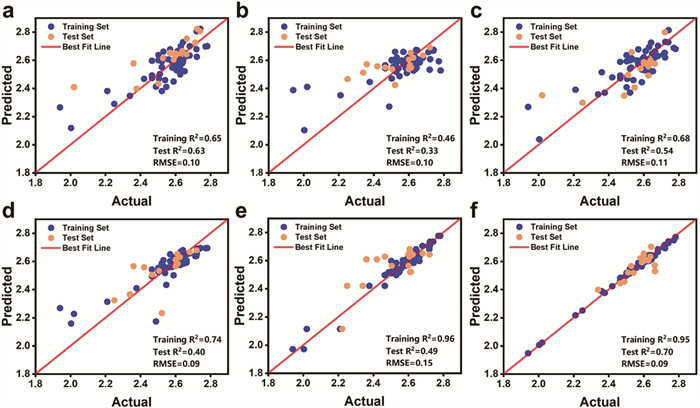
In order to further explore the structural information hidden in the fractal dimension, along with its correlation with other structural features, we used machine learning to find the relationship between some structural parameters of hard carbon and the fractal dimension. We train six machine learning models: Linear Regression, Support Vector Machine, Bayesian, Random Forest, Decision Tree and XGBoost. Before training, all hyperparameters were tuned and the results are displayed in the support information (Table S1). Figs. 6a–f show the training results of these six machine learning models, where the blue and green dots represent the training and test set, respectively. As shown in Figs. 6a–c, Linear Regression, Support Vector Machine and Bayesian are clearly not suitable to this study, with both the training and test sets being awful and 5-fold cross-validated RMSE being at low levels. In Fig. 6e, the decision tree model exhibits typical overfitting, with a very high score of the training set (R2 as high as 0.96) but very discrete in the test set (R2 only 0.49), and an RMSE = 0.15. The Random Forest and XGBoost models show better training results (Figs. 6d and f). Both the training and test sets are more centrally distributed on the prediction line. Among them, the training set variance of the XGBoost model reaches 0.95, which is 0.21 higher than that of the Random Forest model, while the test set variance is 0.70, which is better than the Random Forest model, which indicates that the XGBoost model is the most suitable model for the present study, which can be used for the subsequent prediction and modulation of fractal dimensions.
Figure 6
Figure 6.
Training set (blue plot), teat set (orange plot) and best fit line (red line) of result for machine learning models. (a) Linear Regression, (b) Support Vector Machine, (c) Bayesian, (d) Random Forest, (e) Decision Tree, (f) XGBoost.
In order to make the XGBoost model more interpretable, we conduct a more in-depth analysis of the correlation between features and targets using the Shapley Additive Explanations (SHAP). As shown in Fig. S5 (Supporting information), D is positively correlated with d002 and Lc, and negatively correlated with La and fa. This result provides us with possibility to qualitatively regulate the fractal dimension number, which means that we can achieve the purpose of regulating the fractal dimension number by adjusting the layer spacing, graphite microcrystalline structure and pore connectivity.
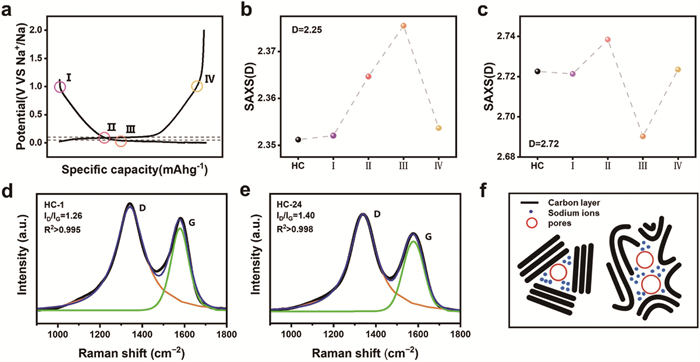
After discovering D as the descriptor of microstructural disorder in hard carbon, it is necessary to explore theoretical application of it in sodium ion storage processes. Firstly, in order to explore the sodium storage mechanism of hard carbon from the point of view of disorder, we select two kinds of hard carbon with discrepant fractal dimensions, and investigate the variation patterns of their D values at different state of charge/discharge (Figs. 7a-c). During the charging and discharging process, the two kinds of hard carbons show different patterns of fractal dimension change. From potential I to II, the fractal dimension of both hard carbons increases to a certain extent, which is due to the fact that the electron density in the carbon phase gradually increases with the sodiation in slope region (> 0.1 V), while the electron density in the closed pores remains unchanged (kept at 0). It leads to an increase in electron density difference that causes a rise in the shoulder-like peak of the SAXS curve in Fig. S6 (Supporting information) and a larger fractal dimension [39]. However, the trend of the fractal dimension of the two hard carbons is completely opposite from potential Ⅱ to Ⅲ. HC-1 (D = 2.35) increases its fractal dimension during this process, while HC-24 (D = 2.72) becomes smaller. According to the relationship between fractal dimension and carbon layer structure, for HC-1, the closed pores are mainly surrounded by pseudo-graphite domains. Therefore, sodium ions enter the pore with little nucleation sites and uniformly stacked inside the pore, which leads to the smaller size of the scatter structure that generates the electron density difference. And the change of structure is reflected in the SAXS curves as a decrease in the shoulder-like peaks, and thus leads to a decrease in the fractal dimension. In contrast, there are a large number of structural defects in the closed pore of HC-24 as nucleation sites, where sodium ions storage and form clusters [40]. These clusters cut the closed pores into more small closed pores, which leads to an increase in the fractal dimension. In addition, the Raman spectra of HC-1 and HC-24 are shown in Figs. 7d and e, in which the ratio of D and G-peak intensities (ID/IG) represent the density of defects. And the ID/IG value of HC-24 (1.40) is larger than HC-1 (1.26), which suggest that HC-24 is much less graphitized with more structural defects [41]. As shown in Fig. 7f, the sodium ions gradually diffuse from the pore entrance to the interior of the pore after entering the closed pore from the pseudo-graphite domains because there are no nucleation sites as the pore walls are regular. In contrast, there are number of nucleation sites inside the closed pores formed by amorphous domains. As a result, sodium ions form clusters at a large number of nucleation sites within the closed pore, thereby cutting the closed pores into more small ones [42].
Figure 7
Figure 7.Ex-situ SAXS of HC-1 and HC-24. (a) Schematic diagram of hard carbon in different potentials. (b, c) Trends of D in HC-1 and HC-24 at different potentials. (d, e) Raman shift of HC-1 and HC-24. (f) Mechanism of the variation of different D with potentials change.
Secondly, D of hard carbons is applied to assess their accessibility of the theoretical plateau capacity. We assumed that all sodium storage structures within the hard carbon phase are filled with sodium and calculated the specific capacity at this point and defined it as the theoretical capacity (Ctp). Then, the theoretical capacity utilization (TCU) of hard carbon can be obtained by calculating the ratio of the plateau capacity to the theoretical capacity, which in turn assesses whether the sodium storage structure of the hard carbon is fully occupied by sodium [19].
The theoretical plateau capacity of commercial hard carbons is calculated using Eq. 2 [18]:
where DNa, CV,Na and Φpore are the theoretical sodium density, theoretical volumetric capacity of sodium and the closed pore volume fraction, respectively. And closed pore volume fraction is obtained from the Teubner-Strey model fitting of the SAXS data, which is deduced from [17]:
$
\phi_{\text {pore }}=I_0 \frac{\rho_{\text {struc }}}{8 \pi(\Delta S L D)^2} \xi^{-3}\left(1+\left(\frac{2 \pi \xi}{d}\right)^2\right)^2
$
(3)
where ρstruc is the structural density and approximated as the particle density in this study, which is calculated using Eq. 4:
where ρgraphite, d002(graphite) and d002(hardcarbon) are the density of graphite (2.26 g/cm3), interlayer distance of graphite (0.334 nm), and interlayer distance of commercial hard carbon samples, respectively. The reason for utilizing the interlayer distance calculation is that it reveals the microstructural features of the hard carbon better than other methods [43].
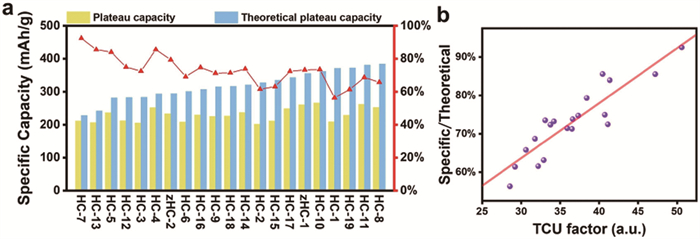
As shown in Fig. 8a, the yellow bars are the theoretical capacity, and the green bars are the plateau capacity in the fully sodiated hard carbon. While the theoretical capacity ranges from 228.4 mAh/g to 383.7 mAh/g, the measured plateau capacity barely reaches 260 mAh/g from 211.3 mAh/g, which indicates it does not increase obviously in pace of the theoretical capacity. This result suggests that even the commercial hard carbons with excellent performance in practical applications does not fully utilize all the theoretical capacity, which means it is feasible to further improve the plateau capacity by increasing the available closed pore through structural design [44].
Figure 8
Figure 8.
(a) Plateau capacity (yellow bars), theoretical plateau capacity (blue bars) and TCU (red polyline) of commercial hard carbons. (b) The TCU factor vs. TCU values plots of commercial hard carbons.
As shown in the red line in Fig. 8a, the TCU of these commercial hard carbon show a decreasing trend as the theoretical capacity increases. In the previous study, plateau capacity is reported to be provided by insertion and pore filling of sodium ions, but the accessibility of closed pores is also a factor of plateau capacity as we have discussed.
On the basis of the experimental results, a simple equation was designed to better understand the interrelation between the TCU, Φpore, and d002(hardcarbon) value, as shown in (5), (6), where a and b consists of D, d002(hardcarbon), and Φpore, and indicates the accessibility of the sodium storage capacity to the hard carbon structure. As can be seen in Fig. 8b, the plot of TCU factor versus TCU for commercial hard carbon shows a strong linear relationship (R2 = 0.81), and therefore, the TCU factor is a key structural indicator of the TCU value. From TCU factor, it is obvious that the large interlayer distance and loose graphite structure are beneficial for the sodium ions to enter the closed pores, which leads to an increase of TCU. At the same time, the increase of closed pore volume fraction is unfavorable to the accessibility of closed pores [44,45]. These results suggest that a single increase in pore size is detrimental to hard carbon capacity, and that expanding the interlayer spacing is a good way to do so. In the structural design of hard carbon materials, expand the interlayer distance by adding cross-linking structures or heteroatoms and control the fraction of closed pore is an effective way to improve TCU for a high plateau capacity [46].
In this study, we identify fractal dimension (D) as a descriptor for the disorder of hard carbon. Benefitting from the method of data analysis, the strong correlation between D and the capacity percentage is found. Porod’s law, TEM and XRD are used to determine the correlation between D and the microstructure of hard carbon. The results reveal that D can represent the degree of disorder in the arrangement of carbon layers. With D increases, pseudo-graphitic decrease and carbon layers become more curved, which result in more closed pores. The diffusion coefficient in different potential below 0.1 V suggest that D is unfavorable to sodium ions diffusion as the diffusion coefficients decrease with D increase and result in a reduce of slope capacity percentage in SIBs. Further machine learning determines the feasibility of XGBoost in D-value prediction, and the results show that there are correlations between D and ξ, fa, La. D are used in analyze the sodium ion storage behavior by ex-situ SAXS, which suggests that carbon layers with larger D have more structural defects as nucleation sites. As a result, closed pores are cut into more smaller ones. In addition, theoretical plateau capacity utilization (TCU) is proposed based on D and reveal the accessibility of closed pore of hard carbon. This work provides a foundation for bridging the gap between structural characterization and a theoretical guidance for the structure of hard carbon with high sodium storage and kinetic performance.
Declaration of competing interest
The authors declare that they have no known competing financial interests or personal relationships that could have appeared to influence the work reported in this paper.
This work was supported by the National Natural Science Foundation of China (No. 22379157), CAS Project for Young Scientists in Basic Research (No. YSBR-102), ICC CAS (No. SCJC-XCL-2023–13), and ICC CAS (No. SCJCXCL-2023–10), Talent Projects for Outstanding Doctoral Students to Work in Shanxi Province (No. E3SWR4791Z), Fundamental Research Program of Shanxi Province (No. 202403021222485).
Supplementary materials
Supplementary material associated with this article can be found, in the online version, at doi:10.1016/j.cclet.2025.111124.
[1]
X. Fan, X. Kong, P. Zhang, et al., Energy Storage Mater. 69 (2024) 103386. doi: 10.1016/j.ensm.2024.103386
Figure 1
The relationship among plateau capacity and structural parameters. (a) Interlayer distance. (b) Crystallite size along the a-axis. (c) crystallite size along the c-axis. (d) Closed pore volume. (e) Specific surface area for CO2 gas adsorption. (f–i) d, ξ, fa and r fitting from SAXS curve.
Figure 2
Pearson correlation heatmap among structure and performance parameters of commercial hard carbon. The correlation between important factors and capacity are surrounded by a red boxed line.
Figure 3
Correlation between fractal dimension and electrochemical performance. (a) Plateau capacity, (b) slope capacity, (c) the percentage of slope capacity and plateau capacity.
Figure 5
(a–f) TEM images of 6 selected commercial hard carbons. (g) correlation between D and the percentage of amorphous domains fitting from XRD. (h) Schematic of the variation of carbon layer structure with fractal dimension.
Figure 6
Training set (blue plot), teat set (orange plot) and best fit line (red line) of result for machine learning models. (a) Linear Regression, (b) Support Vector Machine, (c) Bayesian, (d) Random Forest, (e) Decision Tree, (f) XGBoost.
Figure 7Ex-situ SAXS of HC-1 and HC-24. (a) Schematic diagram of hard carbon in different potentials. (b, c) Trends of D in HC-1 and HC-24 at different potentials. (d, e) Raman shift of HC-1 and HC-24. (f) Mechanism of the variation of different D with potentials change.
Figure 8
(a) Plateau capacity (yellow bars), theoretical plateau capacity (blue bars) and TCU (red polyline) of commercial hard carbons. (b) The TCU factor vs. TCU values plots of commercial hard carbons.

 DownLoad:

 下载:
下载:


 下载:
下载:
