State Key Laboratory of Advanced Electromagnetic Technology, School of Electrical and Electronic Engineering, Huazhong University of Science and Technology, Wuhan 430074, China
b.
School of Chemistry and Chemical Engineering, Huazhong University of Science and Technology, Wuhan 430074, China
c.
Key Laboratory of Artificial Olfaction of Shaanxi Higher Education Institutes, the Academy of Advanced Interdisciplinary Research, Xidian University, Xi’an 710126, China
d.
State Key Laboratory of Inorganic Synthesis and Preparative Chemistry, College of Chemistry, Jilin University, Changchun 130012, China
Received Date:
11 July 2024 Accepted Date:
18 March 2025 Revised Date:
13 March 2025 Available Online:
15 July 2026
Abstract:
Argyrodite-based all-solid-state batteries exhibit significant potential as energy storage devices across a wide temperature zone. The Li-ion and electronic conductivities in the cathode mixture is crucial factor in determining the corresponding electrochemical performances. Here, an effective charge carrier distribution is tailored by introducing Li3InCl6 electrolyte with wider voltage stability surrounding the bare LiNi0.7Co0.2Mn0.1O2 to promote ionic conductivity and mixing carbon additives to enhance electronic conductivity. The Li3InCl6@LiNi0.7Co0.2Mn0.1O2/Li5.5PS4.5Cl1.5/Li-In battery exhibits superior electrochemical performance at various C-rates over a wide operating temperature range due to the enhanced charge carrier conducting rates. It delivers high charge/discharge capacities, superior rate capability and exceptional cycling performance. Specifically, the battery delivers initial discharge capacities of 202 mAh/g at 0.2 C and retains a discharge capacity of 162 mAh/g at 2 C with a capacity retention of 91.8% over 500 cycles when cycled at room temperature. Moreover, due to the Li3InCl6 coating layer and the carbon additive in the cathode, it exhibits higher discharge capacities and superior cycling performances when operated at -20 and 60 ℃. This work presents a guideline for fabricating high-performance all-climate solid-state lithium batteries via tailoring the charger carriers conducting pathway in the electrode structure.
High energy density, extended cycle life, and high safety are vital requirements for lithium-ion batteries due to the rapid development of electric vehicles, hybrid electric vehicles, and portable applications [1-6]. Because of the flammability and potential for leakage, conventional lithium-ion batteries with organic liquid electrolytes cannot meet safety requirements [7-11]. All-solid-state batteries are thought to be the next generation of batteries given that they offer a higher theoretical energy density and do not face the drawbacks of conventional liquid batteries [12-19]. Argyrodites, exemplifying sulfide solid electrolytes, have attracted considerable scholarly interest due to their superior ionic conductivity, commendable mechanical characteristics, and reduced sintering temperature. Notwithstanding these benefits, argyrodites exhibit vulnerabilities, including limited electrochemical windows and suboptimal compatibility with cathode materials [20-22]. These limitations culminate in batteries that deliver inadequate energy capacity and suffer from precipitous failure rates.
A viable approach to enhancing the poor interface compatibility between positive electrode materials and sulfide electrolytes involves the application of a coating layer onto the surface of the cathode material. The employment of coating materials, including Li2ZrO3 [9,23], LiNbO3 [24], and Li4Ti5O12 [25], enhances the electrochemical performance of batteries. A prevailing issue associated with the use of coating materials is that it does not substantially improve the energy density of all-solid-state batteries [9]. Recently, the introduction of halide electrolytes, characterized by a broad electrochemical window and superior compatibility with the cathode, has been reported to resolve the challenge of insufficient energy density [26-29]. The characteristic of this type of battery is to replace the ion additive in the composite positive electrode with halide and changes the separator to a halide/sulfide bilayer configuration. The use of halide electrolytes such as Li3InCl6 [30-34], Li2In1/3Sc1/3Cl4 [35], Li2Sc2/3Cl4 [36], Li2ZrCl6 [37], and Li2.6Zr0.4Ho0.6Cl6 [38], have been proven to significantly enhance the charge/discharge capacity of batteries. The problem is that such bilayer separator batteries may lead to poor cycling performance [9,39,40]. The causative factors for battery failure may include the irreversible H2-H3 phase transition of the positive electrode material [41], degradation of the positive electrode material’s surface structure [42], chemical incompatibility between sulfides and halide electrolytes [39,40,43], as well as contact failure between the positive electrode material and the electrolyte [44].
Among the factors mentioned above, contact-related issues may hold a higher degree of significance. This is because, in solid-state batteries, the cathode section’s ionic conduction pathways are limited due to the poor wettability in solid electrolytes, unlike liquid electrolytes. Consequently, enhancing the ionic conductivity at the solid-solid interfaces within the cathode mixture is crucial for battery performance. Unfortunately, traditional mechanical mixing provides limited pathways for lithium ion migration in cathode mixtures. In comparison, employing halide electrolyte mechanical ball milling coating not only simplifies the preparation method but also, due to the high ionic conductivity of the electrolyte, significantly improves the overall lithium ion transport channels and active contact points within the cathode mixture [45]. This is conducive to enhancing the lithium ion conductivity of the entire cathode mixture, thereby improving the battery’s performance, especially in terms of rate capability.
The electronic conductivity is of great importance for the performance of all-solid-state batteries utilizing high-nickel ternary cathodes as the active material [46,47]. As the nickel content increases and the cobalt content decreases, the inherent electronic conductivity of the material declines. This reduction leads to lower electronic conductivity throughout the cathode composite, thereby constraining the electrochemical performance of the solid-state batteries. This limitation is particularly severe under conditions of long-term and high-rate cycling.
In this work, we implemented two strategies, mechanical ball milling coating and carbon additive, to enhance charge carrier distributions in the cathode mixture. Three configurations of batteries were designed to reveal the effect of Li-ion conductivity and electronic conductivity on battery electrochemical performance. The results indicate that optimized electron and Li-ion transport networks contribute to improving electrochemical performance. The optimized Li3InCl6@LiNi0.7Co0.1Mn0.2O2-Li3InCl6-VGCF/Li3InCl6/Li5.5PS4.5Cl1.5/Li-In battery displays the best electrochemical performance, with a capacity of 91.8% at 2 C after 500 cycles.
The Li5.5PS4.5Cl1.5 and Li3InCl6 electrolytes selected for this paper were prepared using previously reported synthesis methods [9,48]. As shown in Figs. S1a and b (Supporting information), major diffraction peaks from the XRD patterns of prepared Li5.5PS4.5Cl1.5 and Li3InCl6 materials are well indexed with the standard structure and no obvious impurities are detected [49,50]. This indicates that pure target phases are synthesized in this work. GSAS refinement results show lattice parameters c values of 9.8120 Å and 6.3755 Å for Li5.5PS4.5Cl1.5 and Li3InCl6 electrolytes, respectively. This result once again confirm that we have successfully prepared the pure target solid electrolytes. The prepared Li5.5PS4.5Cl1.5 electrolyte delivers a Li-ion conductivity of 8.0 mS/cm and an electronic conductivity of 2.7 × 10⁻⁵ mS/cm (Figs. S1c and d in Supporting information). The obtained Li3InCl6 electrolyte shows Li-ion and electronic conductivities of 1.9 mS/cm and 9.8 × 10⁻⁶ mS/cm, respectively, deduced from the results illustrated in Figs. S1c and d. These solid electrolytes show high ionic conductivity but poor electronic conductivity, making them suitable candidates for solid-state lithium batteries.
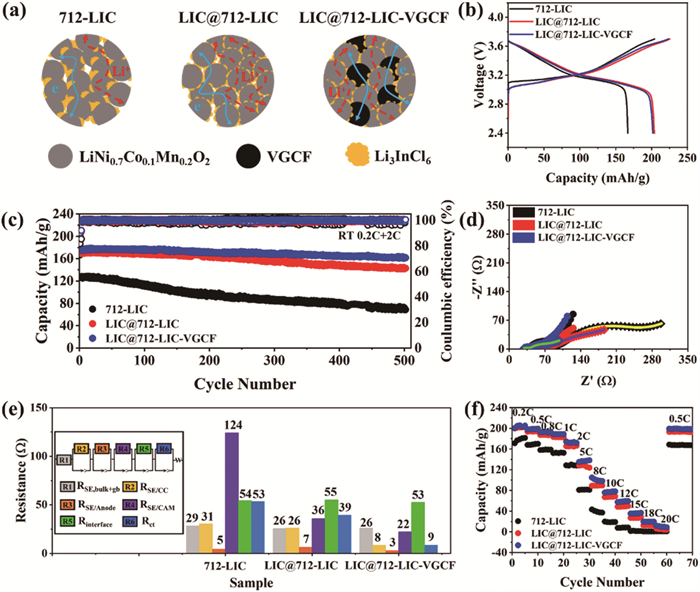
Li3InCl6 with high oxidation stability can be used to facilitate the elucidation of factors affecting cycling performance. Therefore, Li3InCl6 electrolyte was tailored in the cathode mixture to form three kinds of cathode mixtures. Firstly, LiNi0.7Co0.1Mn0.2O2 was directly mixed with Li3InCl6 in a ZrO2 ball mill tank at a low speed (LiNi0.7Co0.1Mn0.2O2-Li3InCl6). Secondly, a small amount of Li3InCl6 was coated on the surface of LiNi0.7Co0.1Mn0.2O2 using a high revolution and then the prepared mixture was mixed with Li3InCl6 in ZrO2 ball mill tank at a low revolution (Li3InCl6@ LiNi0.7Co0.1Mn0.2O2-Li3InCl6). Thirdly, the prepared mixture was combined with Li3InCl6 and VGCF in ZrO2 ball mill tank with a low rpm (Li3InCl6@ LiNi0.7Co0.1Mn0.2O2-Li3InCl6-VGCF) as depicted in Fig. 1a. The normalized XRD results of LiNi0.7Co0.1Mn0.2O2 and Li3InCl6@LiNi0.7Co0.1Mn0.2O2 are shown in Fig. S3a (Supporting information). It can be seen that the crystallinity of LiNi0.7Co0.1Mn0.2O2 coated with Li3InCl6 has not significantly changed, which means that high rotational speed has not damaged the structure of LiNi0.7Co0.1Mn0.2O2. In addition, the SEM images of LiNi0.7Co0.1Mn0.2O2 and Li3InCl6@LiNi0.7Co0.1Mn0.2O2 particles are shown in Figs. S3b-e (Supporting information). It can be seen that mechanical ball milling did not alter the size and morphology of cathode particles. The corresponding EDS line scan results illustrate that weak signals of In and Cl can be found anywhere along the direction of the scanning line, indicating a thin Li3InCl6 coating layer on the surface of LiNi0.7Co0.1Mn0.2O2 particles. Three kinds of battery configurations based on the above cathodes and Li5.5PS4.5Cl1.5 electrolyte are constructed. All batteries were cycled between 2.4 V and 3.7 V (vs. Li-In, corresponding to 3.0 and 4.3 V vs. Li+/Li) to investigate the electrochemical performances. As shown in Fig. 1b, these batteries show similar initial charge/discharge curves when cycled at a current density of 0.126 mA/g (0.2 C). However, the Li3InCl6@ LiNi0.7Co0.1Mn0.2O2 cathodes with and without carbon additives exhibit slightly smaller differences in charge/discharge voltage plateaus than the LiNi0.7Co0.1Mn0.2O2-Li3InCl6 cathode, suggesting that the Li3InCl6 electrolyte coated LiNi0.7Co0.1Mn0.2O2 exhibits smaller voltage polarization in the cathode mixture with faster Li-ion transport dynamics. Compared to the cathode mixture consisting of classic mechanically mixed LiNi0.7Co0.1Mn0.2O2 active materials and Li3InCl6 electrolyte, the Li3InCl6 coated material provides more ionic diffusion pathways for Li-ions, leading to faster Li-ion conductivity for the cathode. The LiNi0.7Co0.1Mn0.2O2-Li3InCl6, Li3InCl6@ LiNi0.7Co0.1Mn0.2O2-Li3InCl6, and Li3InCl6@LiNi0.7Co0.1Mn0.2O2-Li3InCl6-VGCF cathodes deliver initial discharge capacities of 167, 204, and 202 mAh/g, respectively, with corresponding Coulombic efficiencies of 81.7%, 90.5%, and 90.3% at room temperature. The superior discharge capacities and higher initial Coulombic efficiencies of the latter two batteries indicate that the Li3InCl6 electrolyte coating strategy promotes Li+ transport, resulting in excellent battery performance. For the subsequent cyclability test at 2.0 C (Fig. 1c), the LiNi0.7Co0.1Mn0.2O2-Li3InCl6 experiences a rapid capacity fading over 500 cycles, and maintains a discharge capacity of 72 mAh/g with a capacity retention of 57.4%. In contrast, the cathodes containing Li3InCl6@LiNi0.7Co0.1Mn0.2O2 materials exhibit significantly higher discharge capacities and a slower rate of capacity degradation compared to the LiNi0.7Co0.1Mn0.2O2-Li3InCl6 over the following 500 cycles. Specifically, the Li3InCl6@LiNi0.7Co0.1Mn0.2O2-Li3InCl6 shows a discharge capacity of 143 mAh/g for the 500th cycle with a capacity retention of 84.7%. While after introducing the carbon electronic additives in the cathode mixture, the Li3InCl6@LiNi0.7Co0.1Mn0.2O2-Li3InCl6-VGCF consistently displays the highest discharge capacities among the three batteries during the cycling test at 2.0 C, and it delivers a discharge capacity of 162 mAh/g with a capacity retention of 91.8% after 500 cycles. In addition, EIS spectra were performed on these batteries before and after 500 cycles to investigate the resistance variations. The EIS spectra of these batteries and the equivalent circuit graph applied to fit the impedance are shown in Figs. 1d and e, respectively. Based on the analysis results of DRT, the EIS impedance spectrum consists of six parts. They are bulk and grain boundary impedance of the solid electrolyte (RSE, bulk+gb), the resistance between the ionic additives in cathode mixture and the current collector (RSE/CC), the resistance between solid electrolyte and anode (RSE/Anode), the resistance between solid electrolyte and cathode material (RSE/CAM), the resistance of Li3InCl6/Li5.5PS4.5Cl1.5 interface, and the charge transfer resistance of electrodes. For cell LiNi0.7Co0.1Mn0.2O2-Li3InCl6, the resistance between cathode and solid electrolyte accounts for the largest percentage of the total impedance, and this impedance is much greater than cells Li3InCl6@ LiNi0.7Co0.1Mn0.2O2-Li3InCl6 and Li3InCl6@LiNi0.7Co0.1Mn0.2O2-Li3InCl6-VGCF. This implies that the deterioration of the cathode side may be the main reason for the difference in electrochemical performance between cell LiNi0.7Co0.1Mn0.2O2-Li3InCl6 and the latter two types of cells. As shown in Figs. 1d and e, the total resistance of the battery with LiNi0.7Co0.1Mn0.2O2-Li3InCl6 cathode increase from 37.4 Ω before cycling to 296.0 Ω after 500 cycles. In contrast, the total resistance of the Li3InCl6@ LiNi0.7Co0.1Mn0.2O2-Li3InCl6 cell increases from 42.2 Ω in the standing state to 189.0 Ω after the same cycles. For the Li3InCl6@LiNi0.7Co0.1Mn0.2O2-Li3InCl6-VGCF, the resistance values before and after 500 cycles are 41.8 Ω and 121.0 Ω, respectively. The cathodes with Li3InCl6 coating layer exhibit significantly lower resistances before and after long duration cycling compared to the LiNi0.7Co0.1Mn0.2O2-Li3InCl6 cathode. In addition, the rate capability of these batteries are also measured and the corresponding results are shown in Fig. 1f. For the rate capability tests, these batteries were cycled from 0.2 C to 20 C at room temperature. The LiNi0.7Co0.1Mn0.2O2-Li3InCl6 cathode delivers discharge capacities of 171 mAh/g at 0.2 C, 168 mAh/g at 0.5 C, 158 mAh/g at 0.8 C, 152 mAh/g at 1.0 C, 129 mAh/g at 2.0 C, 81 mAh/g at 5.0 C, 43 mAh/g at 8.0 C, 20 mAh/g at 10.0 C, 8 mAh/g at 12.0 C, 2 mAh/g at 15.0 C, 1 mAh/g at 18.0 C, 1 mAh/g at 20.0 C, and 169 mAh/g when the charge/discharge C-rate recovers to 0.5 C, respectively. In contrast, the Li3InCl6@LiNi0.7Co0.1Mn0.2O2-Li3InCl6 cathode shows corresponding discharge capacities of 200, 194, 187, 184, 166, 128, 89, 67, 49, 27, 13, 6, and 193 mAh/g at these chosen C-rates, respectively. While for the Li3InCl6@LiNi0.7Co0.1Mn0.2O2-Li3InCl6-VGCF cathode with enhanced electronic conductivity displays much higher discharge capacities of 201, 198, 193, 189, 174, 135, 105, 76, 58, 35, 20, 12, and 199 mAh/g at the same testing conditions, respectively. It seems that these cathodes including Li3InCl6@LiNi0.7Co0.1Mn0.2O2 active materials exhibit superior rate capability than the battery with the LiNi0.7Co0.1Mn0.2O2-Li3InCl6 cathode due to the enhanced Li-ion conductivity for the mixtures. While the Li3InCl6@LiNi0.7Co0.1Mn0.2O2-Li3InCl6-VGCF cathode shows better rate performance than the Li3InCl6@LiNi0.7Co0.1Mn0.2O2-Li3InCl6 cathode in Fig. 1f due to the accelerated electronic conductivity resulting from the introduction of carbon additives.
Figure 1
Figure 1.
(a) Schematic represents Li+ and electronic conducting in three kinds of composite cathode electrodes. (b) The initial charge/discharge curves and (c) the corresponding cycle performance of the LiNi0.7Co0.1Mn0.2O2-Li3InCl6/Li3InCl6/Li5.5SP4.5Cl1.5/Li-In, Li3InCl6@LiNi0.7Co0.1Mn0.2O2-Li3InCl6/Li3InCl6/Li5.5SP4.5Cl1.5/Li-In and Li3InCl6@LiNi0.7Co0.1Mn0.2O2-Li3InCl6-VGCF/Li3InCl6 /Li5.5SP4.5Cl1.5/Li-In all-solid-state lithium batteries when cycled first at 0.2 C and then followed at 2 C between 2.4 V and 3.7 V (vs. Li-In). (d) The Nyquist plots of these batteries before and after 500 cycles. (e) Equivalent-circuit model and corresponding fitting values applied to impedance curves after cycling. (f) The rate capability test results of three kinds of batteries. All electrochemical tests were performed at room temperature.
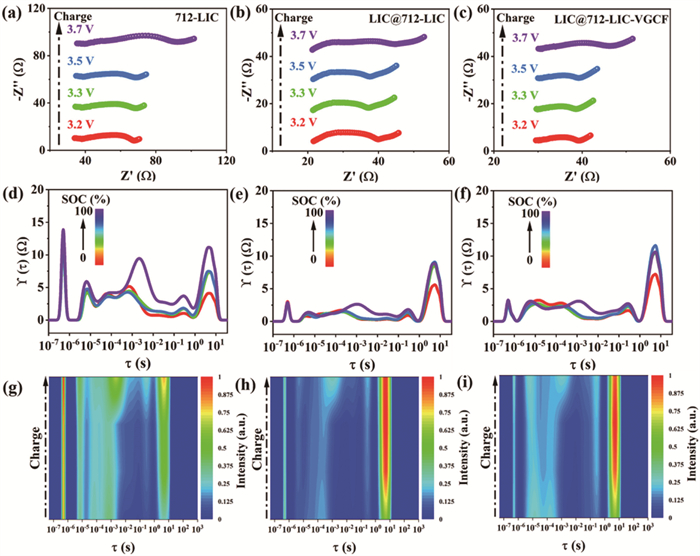
In-situ electrochemical impedance spectroscopy (EIS) was measured to reveal the changes at various interfaces of the battery during cycling. As shown in Fig. 2, the battery with a LiNi0.7Co0.1Mn0.2O2-Li3InCl6 cathode shows the largest total charge resistance during the first cycle, followed by the Li3InCl6@LiNi0.7Co0.1Mn0.2O2-Li3InCl6 cathode, while the Li3InCl6@LiNi0.7Co0.1Mn0.2O2-Li3InCl6-VGCF cathode exhibits the lowest total charge resistance. To further investigate the contribution of each interface resistance on total resistance, the impedance data were fitted using the distribution of relaxation time (DRT). The peaks observed in the time intervals of 10–7–10–6 s, 10–6–10–5 s, 10–5–10–4 s, 10–4–10–1 s, 10–1–100 s and 100–101 s are attributed to the bulk and grain boundary resistances of the solid electrolyte, the impedance between the ionic additives in the composite cathode and the current collector, the resistance of the solid-state electrolyte/Li-In anode, the impedance of the solid-state electrolyte/cathode and the impedance of Li3InCl6 and Li5.5PS4.5Cl1.5, the charge transfer resistance (Rct) at each electrode, and diffusion resistance, respectively [13,51]. The main difference between the LiNi0.7Co0.1Mn0.2O2-Li3InCl6 cathode and the latter two types of cells is the peak located at 10–4–10–1 s, which contains the resistance of the solid-state electrolyte/cathode and the resistance of Li3InCl6 and Li5.5PS4.5Cl1.5. Considering the interface between Li3InCl6 and Li5.5PS4.5Cl1.5 does not deteriorate rapidly, the high resistance of peak located in 10–4–10–1 s is therefore mainly resulting from solid-state electrolyte/cathode. This means that coating a thin Li3InCl6 layer on the surface of LiNi0.7Co0.1Mn0.2O2 particles improves the contact between the cathode and the Li3InCl6 electrolyte particles and reduces the contact resistance. In fact, based on the impedance results from the DRT fitting of the three types of batteries after cycling (Fig. S4a in Supporting information) and the equivalent circuit fitting results above, RCAM/SE is the main reason for electrochemical performance failure of the LiNi0.7Co0.1Mn0.2O2-Li3InCl6 cathode. In addition, the Rct values of the three types of cells after cycling also show significant differences. The addition of carbon conductive additives maintains a small Rct value during the long cycling process (Fig. 1e and Fig. S4a), while the Li3InCl6 coating layer on the surface of LiNi0.7Co0.1Mn0.2O2 particles effectively reduces the increase in Rct during cycling. It is well established that Rct is highly linked to electron conduction at the surface of cathode material [52]. The inclusion of conductive additives increases the electron conductivity, which ultimately leads to the observed difference in electrochemical cycling performance between the Li3InCl6@LiNi0.7Co0.1Mn0.2O2-Li3InCl6 and Li3InCl6@LiNi0.7Co0.1Mn0.2O2-Li3InCl6-VGCF cathodes, as previously descripted. To investigate whether battery failure is caused by changes in cathode material structure before and after cycling, we conducted XRD testing on composite cathode particles before and after cycling. As shown in Fig. S4b (Supporting information), except for the Li3InCl6@LiNi0.7Co0.1Mn0.2O2-Li3InCl6 composite cathode pellet before cycling, the peak intensity of the (003) peak of the other five composite cathode pellets is significantly enhanced compared to the LiNi0.7Co0.1Mn0.2O2 powder (Fig. S3a). The significant enhancement of peak intensity (003) suggests the possibility of the preferred orientation, but from our SEM results (Figs. S3b and c), it appears that the preferred orientation does not exist. The reason for the significant increase in peak intensity of sample (003) may be due to the rotation of cathode particles under high pressure, which leads to an increase in the relative exposed area of the (003) crystal plane. The full width at half maxima (FWHM) of cathode material was compared before and after cycling, and it was discovered that there were no noticeable differences. In addition, no significant by-product peaks resulting from electrochemical cycling were seen. The results above demonstrated that electrochemical cycling wasn’t changing the structure of the cathode material. Fig. S5 (Supporting information) further shows the DC polarization test results of ion/electron blocking batteries to illustrate the effects of ion conductive additive Li3InCl6 and electron conductive additive. It can be clearly seen that the conductivity of the composite positive electrode is improved with the addition of Li3InCl6 and VGCF.
Figure 2
Figure 2.
Impedance spectra under different (a-c) charge states (SOC) and (d-f) the corresponding DRT calculated from EIS measurements at different states of the initial cycle. (g-i) 2D intensity color map of the DRT curves.
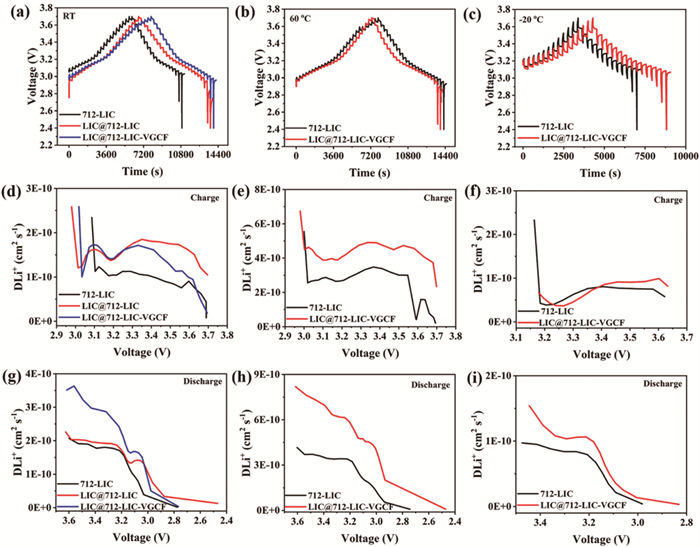
X-ray photoelectron spectroscopy (XPS) was used to investigate whether electrolyte is oxidized due to electrochemical cycling, and the results are shown in Fig. S6 (Supporting information). It can be clearly seen that the binding energy positions of the In and Cl peaks after cycling were not shifted relative to those before cycling, indicating that Li3InCl6 was not undergoing oxidative degradation. The Li+ diffusion capacity of the composite cathode of each cell was further examined to explore the reason for the difference in RCAM/SE values. Galvanostatic intermittent titration technique (GITT) was conducted to quantify Li+ diffusivity of LiNi0.7Co0.1Mn0.2O2-Li3InCl6, Li3InCl6@LiNi0.7Co0.1Mn0.2O2-Li3InCl6, and Li3InCl6@LiNi0.7Co0.1Mn0.2O-Li3InCl6-VGCF three kinds of cathode. Fig. 3a displays the typical charge/discharge GITT curves of the LiNi0.7Co0.1Mn0.2O2 cathode at 0.1 C. Obviously, Li3InCl6@LiNi0.7Co0.1Mn0.2O2-Li3InCl6 and Li3InCl6@LiNi0.7Co0.1Mn0.2O2-Li3InCl6-VGCF show the smaller polarization compared with LiNi0.7Co0.1Mn0.2O2-Li3InCl6, implying cathode particle with thin Li3InCl6 coating layer having faster Li+ kinetics than the counterpart without Li3InCl6 coating layer. Furthermore, there is a strong correlation between the Li+ transport resistance within the solid-state battery and the voltage decrease following a current interruption [53]. Equation published in the literature [53,54] can be used to quantitatively calculate the electrode Li+ diffusion of three different cell configurations.
Figure 3.
GITT curves and the corresponding DLi+ calculations for the LiNi0.7Co0.1Mn0.2O2-Li3InCl6/Li5.5PS4.5Cl1.5/Li-In, Li3InCl6@LiNi0.7Co0.1Mn0.2O2-Li3InCl6/Li5.5PS4.5Cl1.5/Li-In, Li3InCl6@LiNi0.7Co0.1Mn0.2O2-Li3InCl6-VGCF/Li5.5PS4.5Cl1.5/Li-In at r.t., 60 ℃ and −20 ℃, respectively. (a-c) GITT curves at each temperature for three configurations of cells. (d-f) DLi+ calculations in the charging state of three configurations of cells. (g-i) DLi+ calculations in the discharging state of three battery configurations.
where τ is the relaxation time (2 h), mNCM712 is the mass of single crystal LiNi0.7Co0.1Mn0.2O2 (the particle size and morphology are shown in Fig. S3 in Supporting information) in the cathode composite. VNCM712 is the molar volume of single crystal LiNi0.7Co0.1Mn0.2O2 (33.93 cm3/mol), MNCM712 is the molar mass of host materials, and the host material is single crystal LiNi0.7Co0.1Mn0.2O2 (96.91 g/mol). ΔEs is the steady-voltage change after 2 h of relaxation. ΔEτ is the change in the transient-voltage change after 30 min charge/discharge process.
The calculated results are shown in Figs. 3d-i. Figs. 3d and g compare the Li+ diffusivity of LiNi0.7Co0.1Mn0.2O2-Li3InCl6, Li3InCl6@LiNi0.7Co0.1Mn0.2O2-Li3InCl6, and Li3InCl6@LiNi0.7Co0.1Mn0.2O2-Li3InCl6-VGCF as a function of the different depth of charge (DOC) and depth of discharge (DOD), respectively in room temperature. The overall trend of Li+ diffusion coefficient variation during charging is to decrease with the increase of DOC, accompanied by a small increase in some voltage ranges. It can be clearly seen that, Li3InCl6@LiNi0.7Co0.1Mn0.2O2-Li3InCl6 and Li3InCl6@LiNi0.7Co0.1Mn0.2O2-Li3InCl6-VGCF show more significant increase in Li+ diffusion coefficient compared to LiNi0.7Co0.1Mn0.2O2-Li3InCl6 in the ranges of 3.0 V to 3.1 V and 3.2 V to 3.3 V. The average Li+ diffusivity for LiNi0.7Co0.1Mn0.2O2-Li3InCl6, Li3InCl6@LiNi0.7Co0.1Mn0.2O2-Li3InCl6, and Li3InCl6@LiNi0.7Co0.1Mn0.2O2-Li3InCl6-VGCF is 9.86 × 10⁻¹¹, 1.58 × 10⁻¹⁰, and 1.33 × 10⁻¹⁰ cm2/s in charge state. Li+ diffusivity of Li3InCl6@LiNi0.7Co0.1Mn0.2O2-Li3InC6 and Li3InCl6@LiNi0.7Co0.1Mn0.2O2-Li3InCl6-VGCF are about 1.60 and 1.35 times faster compared with LiNi0.7Co0.1Mn0.2O2-Li3InCl6. As shown in Fig. 3g, Li+ diffusion coefficient of all three configurations of cells declines with the increase of DOD. The average Li+ diffusion coefficient of LiNi0.7Co0.1Mn0.2O2-Li3InCl6, Li3InCl6@LiNi0.7Co0.1Mn0.2O2-Li3InCl6, and Li3InCl6@LiNi0.7Co0.1Mn0.2O2-Li3InCl6-VGCF is 1.35 × 10⁻¹⁰, 1.51 × 10⁻¹⁰, and 2.09 × 10⁻¹⁰ cm2/s, respectively. The advantage of the thin Li3InCl6 layer on cathode particle surface is more obvious at 60 ℃. The average Li+ diffusivity of cell LiNi0.7Co0.1Mn0.2O2-Li3InCl6 in charge and discharge states are 2.46 × 10⁻¹⁰ and 2.49 × 10⁻¹⁰ cm2/s, respectively. While cell Li3InCl6@LiNi0.7Co0.1Mn0.2O2-Li3InCl6-VGCF shows much higher Li+ diffusion coefficient of 4.32 × 10⁻¹⁰ and 5.10 × 10⁻¹⁰ cm2/s, respectively in charge and discharge states, corresponding to the ultra-high initial discharge capacity at 60 ℃. However, the coating layer causes a slight increase in Li+ diffusion coefficient at −20 ℃. This may be due to low Li+ conductivity of Li3InCl6 at low temperatures, and the exist of Li3InCl6 separator of Li3InCl6 limits the migration of Li+ in the cell. The above data all indicate that cathode particles with a thin Li3InCl6 coating layer can obviously boost the Li+ transport kinetics in solid-state batteries, thereby enhancing the electrochemical performance of all-solid-state batteries.
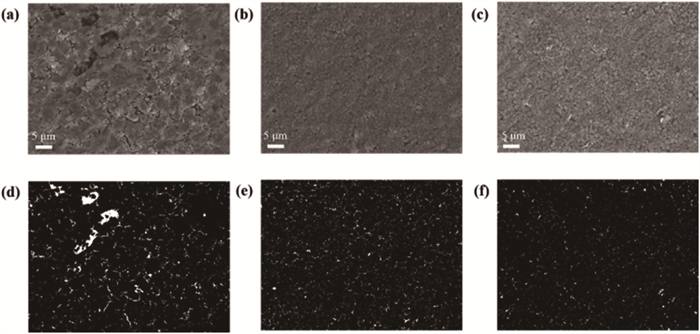
The before and after cycling SEM images of LiNi0.7Co0.1Mn0.2O2-Li3InCl6, Li3InCl6@LiNi0.7Co0.1Mn0.2O2-Li3InCl6, and Li3InCl6@LiNi0.7Co0.1Mn0.2O2-Li3InCl6-VGCF were measured to further investigate the factor leading to difference in electrochemical performance of above three type of configurations cells. All images were processed by the Image J program to investigate the changes in porosity before and after cycling. As shown in Fig. 4a, battery LiNi0.7Co0.1Mn0.2O2-Li3InCl6 has many cracks and multiple holes of different sizes after cycling. The contact between particles is visually much worse than before cycling. On the contrary, the contact between particles of Li3InCl6@LiNi0.7Co0.1Mn0.2O2-Li3InCl6, and Li3InCl6@LiNi0.7Co0.1Mn0.2O2-Li3InCl6-VGCF appears more closely visually (Figs. 4b and c). The data analyzed by program Image J shows that the porosity of cell LiNi0.7Co0.1Mn0.2O2-Li3InCl6 is 5.71% (Fig. 4d), which is much higher compared with the cell with a value of 1.96% before cycling (Fig. S7d in Supporting information). While the porosity of cell Li3InCl6@LiNi0.7Co0.1Mn0.2O2-Li3InCl6 before and after cycling is 1.64% (Fig. S7e in Supporting information) and 3.44% (Fig. 4e), respectively, and the increase in porosity caused by cycling is much smaller than cell LiNi0.7Co0.1Mn0.2O2-Li3InCl6. Compared to LiNi0.7Co0.1Mn0.2O2-Li3InCl6, Li3InCl6@LiNi0.7Co0.1Mn0.2O2-Li3InCl6 has a much more efficient Li+ percolation network. Such network alleviates contact loss due to the anisotropic volume change of the cathode materials during the charge/discharge process, reduces the increase of porosity, and ultimately leads to the improvement in cycling performance (Fig. 1c). As decapitated in Fig. 4f and Fig. S7f (Supporting information), the porosity of Li3InCl6@LiNi0.7Co0.1Mn0.2O2-Li3InCl6-VGCF before and after cycling is 1.54% and 1.56%, respectively. Such increment in porosity is much smaller compared with Li3InCl6@LiNi0.7Co0.1Mn0.2O2-Li3InCl6. This may be because although the Li3InCl6 coating on surface LiNi0.7Co0.1Mn0.2O2 particles surface is island shaped, the coating area accounts for a high proportion, which leads to a reduction in the electron diffusion path. The reduction of electron transport in cathode particles surface may lead to the local overpotential increase, and may results in the increase of porosity. After adding VGCF to the composite cathode, the electron transfer ability of composite cathode is improved. Cell Li3InCl6@LiNi0.7Co0.1Mn0.2O2-Li3InCl6-VGCF therefore has the best cycling performance (Fig. 1c) resulting from good Li+ and electron percolation and diffusion network.
Figure 4
Figure 4.
The SEM images and the corresponding porosity measurement diagrams of cycled LiNi0.7Co0.1Mn0.2O2-Li3InCl6, Li3InCl6@LiNi0.7Co0.1Mn0.2O2-Li3InCl6, and Li3InCl6@LiNi0.7Co0.1Mn0.2O2-Li3InCl6-VGCF batteries. (a, c) SEM images of LiNi0.7Co0.1Mn0.2O2-Li3InCl6. (b, e) SEM image of Li3InCl6@LiNi0.7Co0.1Mn0.2O2-Li3InCl6. (c, f) SEM image of Li3InCl6@LiNi0.7Co0.1Mn0.2O2-Li3InCl6-VGCF.
Finally, the electrochemical performances of the assembled LiNi0.7Co0.1Mn0.2O2-Li3InCl6/Li3InCl6/Li5.5PS4.5Cl1.5/Li-In and Li3InCl6@LiNi0.7Co0.1Mn0.2O2-Li3InCl6-VGCF/Li3InCl6/Li5.5PS4.5Cl1.5/Li-In cells cycled over a wide operating temperature range are also investigated. As shown in Fig. S8a (Supporting information), the LiNi0.7Co0.1Mn0.2O2-Li3InCl6/Li3InCl6/Li5.5PS4.5Cl1.5/Li-In cell delivers an initial discharge capacity of 115 mAh/g at 0.1 C when operated at −20 ℃ and retains 86.3% of its original value after 50 cycles. In contrast, the Li3InCl6@LiNi0.7Co0.1Mn0.2O2-Li3InCl6-VGCF/Li3InCl6/Li5.5PS4.5Cl1.5/Li-In shows a discharge capacity of 117 mAh/g for the first cycle and maintains higher discharge capacities over 50 cycles (Fig. S8b in Supporting information). The improved battery performance is attributed to the enhanced Li-ion conductivity and electronic conductivity. As operating temperature increases to 60 ℃ (Fig. S8c in Supporting information), the Li3InCl6@LiNi0.7Co0.1Mn0.2O2-Li3InCl6-VGCF/Li3InCl6/Li5.5PS4.5Cl1.5/Li-In cell exhibits a slightly higher initial discharge capacity than that of the LiNi0.7Co0.1Mn0.2O2-Li3InCl6/Li3InCl6/Li5.5PS4.5Cl1.5/Li-In cell when cycled at 0.2 C. After that, both batteries were cycled with an increased C-rate of 2 C. As depicted in Fig. S8d (Supporting information), the Li3InCl6@LiNi0.7Co0.1Mn0.2O2-Li3InCl6-VGCF/Li3InCl6/Li5.5PS4.5Cl1.5/Li-In cell exhibits higher discharge capacities compared to the LiNi0.7Co0.1Mn0.2O2-Li3InCl6/Li3InCl6/Li5.5PS4.5Cl1.5/Li-In cell over the following 350 cycles. The latter cell shows a discharge capacity retention of 80.4% after 350 cycles, whereas the former battery retains a higher discharge capacity of 200 mAh/g with a capacity retention of 91.3% under the same test conditions. Furthermore, the rate capabilities of both cells at elevated temperatures were also investigated. As illustrated in Fig. S8e (Supporting information), both cells show increased voltage polarizations in the cathode mixtures with increased charge/discharge C-rates. The Li3InCl6@LiNi0.7Co0.1Mn0.2O2-Li3InCl6-VGCF cathode exhibits smaller polarizations compared to the LiNi0.7Co0.1Mn0.2O2-Li3InCl6 cathode when cycled at the same C-rates due to the enhanced Li-ion and electronic conductivity caused by the electrolyte coating and the addition of carbon additive. During the rate performance tests, the LiNi0.7Co0.1Mn0.2O2-Li3InCl6 cathode shows discharge capacities of 185 mAh/g at 0.2 C, 177 mAh/g at 0.5 C, 169 mAh/g at 0.8 C, 164 mAh/g at 1.0 C, 145 mAh/g at 2.0 C, 113 mAh/g at 5.0 C, 92 mAh/g at 8.0 C, 79 mAh/g at 10.0 C, 68 mAh/g at 12.0 C, 52 mAh/g at 15.0 C, and 176 mAh/g when the charge/discharge C-rates recovers to 0.5 C at 60 ℃, respectively. In contrast, the Li3InCl6@LiNi0.7Co0.1Mn0.2O2-Li3InCl6-VGCF cathode delivers discharge capacity values of 204, 202, 195, 191, 175, 147, 123, 107, 91, 70, and 199 mAh/g at these corresponding C-rates, respectively. The Li3InCl6@LiNi0.7Co0.1Mn0.2O2-Li3InCl6-VGCF cathode exhibits superior rate performance than that of the LiNi0.7Co0.1Mn0.2O2-Li3InCl6 cathode when cycled at elevated temperatures.
In summary, we have optimized charge carrier distributions in the LiNi0.7Co0.1Mn0.2O2 and Li3InCl6 cathode mixture by improving Li-ion conductivity and electronic conductivity. Firstly, a Li3InCl6 coating layer has been successfully introduced to surround the active particles to enhance Li-ion conductivity via a simple mechanical ball milling coating route. Additionally, the participation of carbon additive in the mixture improves the electronic conductivity. The Li3InCl6 coating layer provides more diffusion pathways for Li-ions, while the VGCF in the mixture leads to enhanced electronic conductivity. These adjustments result in accelerated charge carrier conducting capability. Therefore, the tailored Li3InCl6@LiNi0.7Co0.1Mn0.2O2-Li3InCl6-VGCF cathode shows superior electrochemical performance over a wide operating temperature range. Specifically, the LiNi0.7Co0.1Mn0.2O2-Li3InCl6 cathode delivers much lower initial discharge capacity (167 mAh/g) and Coulombic efficiency (81.7%) compared to the Li3InCl6@LiNi0.7Co0.1Mn0.2O2-Li3InCl6 cathode (204 mAh/g, 90.5%) and the Li3InCl6@LiNi0.7Co0.1Mn0.2O2-Li3InCl6-VGCF cathode (202 mAh/g, 90.3%) when cycled at 0.2 C under room temperature. When cycled at 2.0 C, the LiNi0.7Co0.1Mn0.2O2-Li3InCl6 cathode shows a discharge capacity of 72 mAh/g with a rapid capacity degradation of 57.4% after 500 cycles, while the Li3InCl6@LiNi0.7Co0.1Mn0.2O2-Li3InCl6 and Li3InCl6@LiNi0.7Co0.1Mn0.2O2-Li3InCl6-VGCF cathodes retain discharge capacities of 143 mAh/g and 162 mAh/g after 500 cycles, with corresponding capacity retention values of 84.7% and 91.8%, respectively. The improved electrochemical performance is attributed to the enhanced charge carrier conducting capability resulting from the Li3InCl6 coating layer surrounding the LiNi0.7Co0.1Mn0.2O2 active materials and the addition of carbon electronic conductive additives in the cathode mixture. Moreover, this improvement results in higher discharge capacities and superior cycling performances of the battery working over a wide temperature range at −20 and 60 ℃.
Declaration of competing interest
The authors declare that they have no known competing financial interests or personal relationships that could have appeared to influence the work reported in this paper.
This work was supported by the National Key Research and Development Program of China (No. 2021YFB2500200). We also thank the National Natural Science Foundation of China (No. 52177214) for supporting our work. We gratefully acknowledge the Analytical and Testing Center of HUST, Instrumental Analysis Center of Xidian University and Comprehensive Experimental Center for Chemistry and Bioscience in Xidian University allow us to use the facilities.
Supplementary materials
Supplementary material associated with this article can be found, in the online version, at doi:10.1016/j.cclet.2025.111113.
J.S. Horner, G. Whang, D.S. Ashby, et al., ACS Appl. Energy Mater. 4 (2021) 11460–11469. doi: 10.1021/acsaem.1c02218
Figure 1
(a) Schematic represents Li+ and electronic conducting in three kinds of composite cathode electrodes. (b) The initial charge/discharge curves and (c) the corresponding cycle performance of the LiNi0.7Co0.1Mn0.2O2-Li3InCl6/Li3InCl6/Li5.5SP4.5Cl1.5/Li-In, Li3InCl6@LiNi0.7Co0.1Mn0.2O2-Li3InCl6/Li3InCl6/Li5.5SP4.5Cl1.5/Li-In and Li3InCl6@LiNi0.7Co0.1Mn0.2O2-Li3InCl6-VGCF/Li3InCl6 /Li5.5SP4.5Cl1.5/Li-In all-solid-state lithium batteries when cycled first at 0.2 C and then followed at 2 C between 2.4 V and 3.7 V (vs. Li-In). (d) The Nyquist plots of these batteries before and after 500 cycles. (e) Equivalent-circuit model and corresponding fitting values applied to impedance curves after cycling. (f) The rate capability test results of three kinds of batteries. All electrochemical tests were performed at room temperature.
Figure 2
Impedance spectra under different (a-c) charge states (SOC) and (d-f) the corresponding DRT calculated from EIS measurements at different states of the initial cycle. (g-i) 2D intensity color map of the DRT curves.
Figure 3
GITT curves and the corresponding DLi+ calculations for the LiNi0.7Co0.1Mn0.2O2-Li3InCl6/Li5.5PS4.5Cl1.5/Li-In, Li3InCl6@LiNi0.7Co0.1Mn0.2O2-Li3InCl6/Li5.5PS4.5Cl1.5/Li-In, Li3InCl6@LiNi0.7Co0.1Mn0.2O2-Li3InCl6-VGCF/Li5.5PS4.5Cl1.5/Li-In at r.t., 60 ℃ and −20 ℃, respectively. (a-c) GITT curves at each temperature for three configurations of cells. (d-f) DLi+ calculations in the charging state of three configurations of cells. (g-i) DLi+ calculations in the discharging state of three battery configurations.
Figure 4
The SEM images and the corresponding porosity measurement diagrams of cycled LiNi0.7Co0.1Mn0.2O2-Li3InCl6, Li3InCl6@LiNi0.7Co0.1Mn0.2O2-Li3InCl6, and Li3InCl6@LiNi0.7Co0.1Mn0.2O2-Li3InCl6-VGCF batteries. (a, c) SEM images of LiNi0.7Co0.1Mn0.2O2-Li3InCl6. (b, e) SEM image of Li3InCl6@LiNi0.7Co0.1Mn0.2O2-Li3InCl6. (c, f) SEM image of Li3InCl6@LiNi0.7Co0.1Mn0.2O2-Li3InCl6-VGCF.

 DownLoad:

 下载:
下载:


 下载:
下载:
