Received Date:
11 February 2025 Accepted Date:
18 March 2025 Revised Date:
08 March 2025 Available Online:
01 July 2026
Abstract:
Hard carbon materials are currently the only practical anode materials for commercial sodium-ion battery production, due to their advantages such as high volumetric capacity, low discharge potential, and low production cost. However, hard carbon typically faces issues like low initial Coulombic efficiency (ICE), poor rate performance, and structural instability during cycling, on account of its disordered and porous structure. To address these challenges, this study designs and implements a surface modification strategy to coat hard carbon with a carbon layer derived from the pyrolysis of liquid paraffin. This modified layer significantly reduces the surface defect sites, promotes the ordering of the material's surface structure, and effectively fills the pores of the material. As a result, the ICE of surface-modified hard carbon can be improved from 80% to 90%, with an increased reversible capacity to 310 mAh/g, while also enhancing the rate and cycling performance. This method offers a simple yet efficient approach for structural modification and performance optimization of hard carbon anode materials for developing advanced sodium-ion battery technologies.
Sodium-ion batteries (SIBs) are promising applications in fields such as large-scale energy storage and transportation power, and have strong competitiveness in these areas [1,2]. The anode is one of the pivotal components that affect the electrochemical performance of SIBs [3]. Hard carbon (HC), as a low-cost material with stable structure and performance [4], has attracted significant attention from researchers in the field of SIBs. It is currently the mainstream anode material for SIBs, but still faces several issues [5]. For example, the low initial Coulombic efficiency (ICE) leads to the loss of some sodium-ions in the anode, which impacts the energy density and cycle life of the battery. Its rate performance also needs improvement, especially under high-rate charge/discharge conditions, where sodium-ion dynamics are limited, affecting the battery's output power and response speed. Furthermore, long-term cycling may result in structural changes and performance degradation, affecting the cycling stability and service life of the battery [6-8].
To address the aforementioned challenges of HC anode materials, surface coating of HC is a direct and effective approach [9]. By applying a thin and uniform layer of functional materials, such as graphene, carbon nanotubes, or metal oxides, on the surface of the HC anode, it can prevent side reactions between the HC anode and the electrolyte, reducing sodium ion loss. Additionally, it can provide extra sodium-ion storage sites, thereby improving the specific capacity of the battery. Meanwhile, the high conductivity of the coating materials can accelerate the transport of electrons and sodium ions, enhancing the rate performance of the battery [10,11]. Lin et al. used three-dimensional porous graphene bulk (PGM) as a model material [12] and grew approximately 1 nm Al2O3 nanoclusters on the graphene defects. The Al2O3 coating effectively reduced surface defects of the HC and mitigated the harmful etching of HF on the solid electrolyte interface (SEI), leading to significant improvements in the ICE, rate performance, and cycling stability of PGM. Xie et al. [13] prepared a suite of hard-soft carbon composite materials (FP-MP 5:21000) using biomass and waste oil as low-cost anode materials for SIBs. The synergistic effect between hard carbon and soft carbon effectively suppressed the formation of the SEI and enhanced the reversible sodium storage capacity. As a result, the composite materials achieved a reversible capacity of 282 mAh/g and an ICE of 80% at a current density of 30 mA/g. Although significant progress has been made in the surface coating modification of HC anodes, there are still some issues and challenges [14]. For example, improper control of process parameters during the coating process may result in uneven distribution of the coating layer on the surface of the HC anode, and sometimes even deteriorate the rate performance and cycling stability of the battery [15]. A coating layer that is either too thick or too thin may either elongate the Na+ diffusion path therefore, reducing rate performance or reduce the effectiveness of protecting the HC anode from electrolyte corrosion therefore lowering the cycling stability and safety of the battery. In addition, high-performance coating materials are often expensive. Therefore, further optimization of coating methods and process conditions is needed, along with the search for cost-effective coating materials with excellent electrochemical performance, to enhance the performance of SIB anode materials and reduce costs.
In this study, we performed surface coating modification on commercial HC by using inexpensive liquid paraffin (LP), which was thermally treated to form a derived carbon layer on the surface of the HC. This modification improved the ICE (from 80% to 90%) and reversible capacity (from 270 mAh/g to 310 mAh/g), while also enhancing the rate performance. At a current density of 500 mA/g, the capacity was significantly improved. The capacity retention after 200 cycles was 97.5%. The study shows that this improvement is due to the fact that the liquid paraffin-derived carbon layer can, on one hand, increase the ordering of the carbon layers on the surface of the hard carbon, enhancing the material's conductivity and thus optimizing the rate performance. On the other hand, it can reduce the surface defects and specific surface area of the HC, filling some of the pores in the HC, which in turn reduces the irreversible capacity loss during cycling, leading to higher ICE, stable cycling performance, and higher reversible capacity. Furthermore, we further validated the sodium-ion storage mechanism as "adsorption-intercalation-filling" through in situ Raman and ex situ XRD testing.
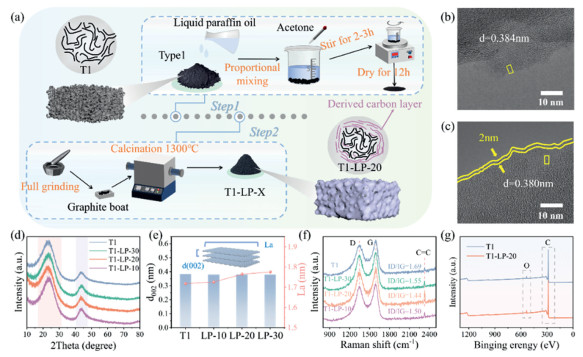
The liquid paraffin derived carbon coating strategy to engineer the surface of HC T1 is shown in Fig. 1a. LP and T1 were first uniformly dispersed in acetone in a certain proportion, and then dried under stirring, before carbonized at 1300 ℃ to deposit the LP derived ordered carbon layer on the surface of T1 (see Supporting information for experimental methods). The properties of products, especially the derived carbon coating, were then studied. The morphologies of the original T1 and carbon-coated T1 materials, namely T1-LP-30, T1-LP-20, and T1-LP-10, are all microparticles with irregular shapes (Fig. S3 in Supporting information). Introducing LP into the reaction system or coating T1 particles with LP derived carbon layer did not change the morphology of pristine particles. TEM images (Figs. 1b and c) further revealed the structure of T1 particles and LP derived carbon coating (on T1-LP-10). T1 has a low degree of graphitization, with only a small amount of small graphite layers and curved graphite sheets, which are stacked in a disordered manner. In contrast, the carbon derived from LP exhibited a highly ordered graphitic structure. When the mass ratio of T1 to LP was 30:1 (T1-LP-30, Fig. S4a in Supporting information), the amount of LP added was insufficient to form continuous carbon layers with observable thickness on the surface of T1. When the ratio changed to 20:1 (T1-LP-20, Fig. 1c), uniform LP-derived carbon coating layers approximately 2 nm formed. When the ratio further decreased to 10:1 (T1-LP-10, Fig. S4b in Supporting information), the carbon coating layers further thickened to around 4 nm. Fig. S5 (Supporting information) shows the TEM images of T1 and T1-LP-20 at a higher magnification to better observe the carbon coating. The schematics in Fig. S6 (Supporting information) showing the key differences in heterostructures of T1 and T1-LP-X based on the above observations, demonstrating the successful coating of graphitic carbon layers with controllable and uniform thickness by the pyrolysis of varying amounts of LP (other effects of LP-assisted surface engineering such as pore-filling or pore size modification will be discussed in later sections). Meanwhile, we calculated the interlayer spacing of the four materials using TEM, which is in agreement with the XRD results. All four samples still possess dominant amorphous carbon structures, demonstrated by their XRD patterns in Fig. 1d. The graphitic carbon coating derived from LP did not significantly change the average crystal structures of products. Two X-ray diffraction peaks near 24° and 43° correspond to the (002) and (100)/(101) crystal planes of amorphous carbon, respectively. The average carbon layer spacings d(002) and average crystallite widths (La) of the graphite crystals along the a-axis of four samples were calculated using the Bragg diffraction formula below, schematized and summarized in Fig. 1e, the specific values are shown in Table S4 (Supporting information):
d(002)=λ/2sinθ
(1)
Figure 1
Figure 1.
(a) The preparation flowchart of T1-LP-X (X = 10, 20, or 30). TEM image of (b) T1 and (c) T1-LP-20. (d) XRD spectra. (e) Interlayer spacing and La values. (f) Raman spectra of T1 andT1-LP-X. (g) XPS survey spectra of T1 and T1-LP-20.
where λ = 1.5405 Å (Cu Kα radiation) and θ is the diffraction angle [16]. This summary of d(002) and La indicates that adding LP has a minor effect on average interlayer spacings of products (pure or mainly T1), but promotes the gradual increase of the crystallite size parameter (La), indicating more ordered structures [17]. The average carbon layer spacing d(002) of T1 and T1-LP-20 are 0.384 nm and 0.380 nm respectively, consistent with interlayer spacings observed by TEM. Although the carbon layer spacing of T1-LP-20 slightly decreases by ~1%, it remains within a suitable range for reversible electrochemical sodium ion insertion and extraction [18,19].
The degree of disorder of carbon-based products were evaluated by Raman spectra (Fig. 1f). All samples exhibit two distinct characteristic peaks at 1344 cm−1 and 1590 cm−1, which correspond to the D peak and G peak, respectively [20]. The D peak arises from disorder and defects in the structure while the G band is caused by the stretching vibration of sp2 hybridized carbon atoms in graphite carbon [21]. Therefore, the area ratio of D peak to G peak (ID/IG) typically reflect the degree of disorder of carbon materials, with larger ratio indicating higher degree of disorder. The smallest ID/IG value of T1-LP-20 indicates that the addition of LP effectively reduces surface defects through our modification process, preventing these defects from becoming catalytic sites for side reactions, and enhances the ordering of the surface carbon of T1 [22]. The highest degree of graphitization of T1-LP-20 among all samples was proved, as it shows the highest peak intensity around 2300 cm−1, corresponding to the stretching vibration of C=C bonds. Both T1 and T1-LP-20 are composed of carbon mainly and rich in oxygen on surface, as proved by the sharp and intense C 1s and O 1s peaks in their XPS spectra in Fig. 1g. XPS elemental analysis reveals an oxygen content reduced from 4.1% in T1 to 3.5% in T1-LP-20. Fig. S7 (Supporting information) shows the XPS C 1s spectra of T1 and T1-LP-20, with peaks located at 284.8, 286.0, and 289.0 eV corresponding to C—C, C—O, and C═O, respectively [23]. The fitting results indicate that the peak areas of C—O and C═O in T1-LP-20 have decreased, suggesting that the reduction in oxygen content mainly leads to a decrease in C—O and C═O. The specific values are shown in Table S5 (Supporting information). Reducing surface O functional groups plays a significant role in suppressing potential side reactions during the charge and discharge processes. Moreover, the reduction in oxygen content is not significant, which not only helps improve the ICE but also leads to the formation of a thinner and more stable SEI film, thereby enhancing cycling stability [24,25]. All characterization results in Fig. 1 demonstrate that the surface engineering of T1 has been achieved by LP-derived carbon coating layers with are highly graphitic structure and controllable thickness. This modification strategy not only adjusts the carbon layer structure of T1, reducing surface defects and improving the ordering of the surface carbon layer, but also forms a long-range ordered carbon layer that blocks the contact between graphene edges and the electrolyte. This further reduces the occurrence of side reactions and significantly improves the ICE.
The effects of the LP-derived carbon layer on the pore structure of T1 were further analyzed through N2 and CO2 adsorption-desorption tests. Both T1 and T1-LP-20 show strong interaction between the material and nitrogen, indicated by N2 adsorption-desorption isotherms that tend toward the Y-axis at low pressures (Fig. S8a in Supporting information) [26]. Additionally, the adsorption amount increases slowly with increasing pressure. The N2 adsorption-desorption isotherms indicate that, with the introduction of LP, the specific surface area (SSA) decreased from 5.36 m2/g of T1 to 3.10 m2/g of T1-LP-20. Fig. S8b (Supporting information) shows the CO2 adsorption-desorption isotherms, where the SSA decreased significantly from 60.85 m2/g of T1 to 26.41 m2/g of T1-LP-20, suggesting the presence of large amounts of CO2 accessible micropores that N2 cannot access. The comparison of pore size distribution (Fig. S8c in Supporting information) and micropore size distribution (Fig. S8d in Supporting information) between T1 and T1-LP-20 reveals significant differences. Specifically, the pore volume in the 2–8 nm range is noticeably reduced for T1-LP-20, indicating that the LP-derived carbon significantly affects the mesopores in T1. Furthermore, the total open pore volume of T1 decreased from 0.0096 m3/g to 0.0067 m3/g after modification (Table S6 in Supporting information), indicating that the LP-derived carbon can modify the pore structure of T1 without significantly sacrificing the open pores (only a 30% volume reduction). As shown in the schematic (Fig. S9 in Supporting information), the open pores of T1-LP-20, after modification by LP-derived carbon, remain intact and are not completely filled. These results indicate that the LP-derived carbon layer effectively reduces the specific surface area of T1 while blocking a portion of the open pores, thus decreasing the total volume of open pores. With the reduction of open pore volume, the material's surface area in contact with the environment is reduced, leading to a decrease in irreversible capacity loss due to reactions between the electrolyte and the material. Particularly, during the cycling of sodium-ion batteries, the reduction of open pores helps reduce capacity decay caused by the decomposition of the electrolyte or side reactions.
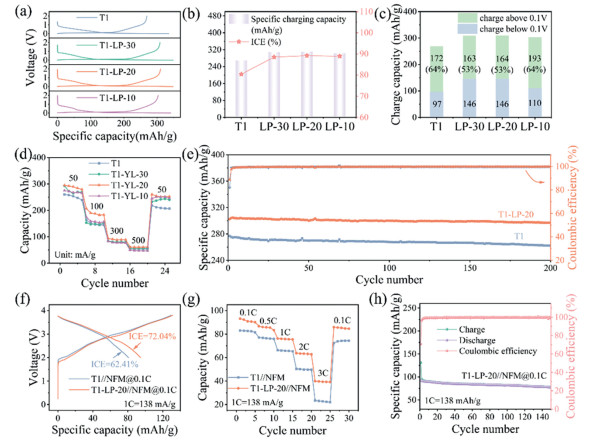
To verify the impact of LP carbonization deposition on sodium-ion storage performance of hard carbon T1, the electrochemical properties of T1-LP-X and T1 were tested (Fig. 2). Fig. 2a shows similar slope and plateau voltage potentials but varying ICEs and capacities in first charge-discharge curves of all samples (the key performance indicators shown in Table S7 in Supporting information). Fig. 2b summarizes and compares their ICEs and the first-cycle charge capacities. Both ICE and initial charge capacity of T1-LP-X were improved, from 80% and 269 mAh/g of T1 to 90% and 310 mAh/g of T1-LP-20. The lower ICE of T1 may be related to its high SSA and a portion of open pore volume, as indicated by the N2 adsorption-desorption test. This results in a larger electrochemically active surface between the electrolyte and the electrode [27], leading to a more pronounced SEI. In contrast, T1-LP-20, due to the presence of carbon coating layers derived from LP, has a reduced SSA therefore decreased irreversible capacity and higher ICE. Fig. S10 (Supporting information) shows the first charge-discharge curve of T1 directly carbonized at 1300 ℃ for 2 h, along with the XRD and Raman spectra of T1-1300. The ICE of T1-1300 is 83%, and the charge capacity is 282 mAh/g. The XRD pattern indicates that the interlayer spacing of T1-1300 is 3.97 nm. This larger interlayer spacing extends the migration path of sodium ions between the carbon layers, which may lead to reduced conductivity and affect the charge-discharge efficiency of the battery. The larger interlayer spacing may also result in more side reactions, reducing the actual capacity of the battery and accelerating its degradation. The Raman spectrum shows an ID/IG ratio of 2.05, indicating an increase in surface defects in T1-1300. These surface defects provide more active sites for reactions between the electrolyte and hard carbon, potentially leading to more side reactions (such as the formation of the SEI film). These side reactions not only consume the electrolyte but may also reduce the overall performance of the battery [28]. In contrast, the LP-derived carbon layer effectively reduces the defects on the hard carbon surface by protecting it and minimizing the impact of external negative factors. Therefore, the carbon layer derived from LP is crucial for improving the performance of T1. The sodium storage release behaviors of the first cycle are shown in Fig. 2c, where the slope capacity above 0.1 V and the plateau capacity below 0.1 V are summarized from Fig. 2a. T1 shows the smallest plateau capacity of only 97 mAh/g, while T1-LP-20 exhibits the highest plateau capacity of 146 mAh/g. T1 has a higher proportion of slope capacity, due to its increased surface defects and enhanced Na+ adsorption [29,30]. The introduction of LP significantly reduces surface defects, thereby lowering the proportion of slope capacity of T1-LP-20. The increase in plateau capacity is attributed to the regulation of the pore structure in T1 by the LP-derived carbon layer [31]. The rate performances of the electrode materials are shown in Fig. 2d, with current densities ranges from 50 mA/g to 500 mA/g. The corresponding GCD curves at different rates are displayed in Fig. S11 (Supporting information). The charge capacity of T1-LP-20 at current densities of 50, 100, 300, 500, and 50 mA/g are 288, 190, 90, 61, and 254 mAh/g, respectively. Its charge capacity can recover to 88% of its original value when the current density is restored to 50 mA/g. For T1, the charge capacities at 50, 100, 300, 500, and 50 mA/g are 252, 150, 81, 54, and 211 mAh/g, respectively, then recovers to 84% of its original value when the current density returns to 50 mA/g. The key factors for the improved rate performance include the regulation of the pore structure by LP and the high conductivity provided by the growth of the surface-ordered carbon layer [17]. Moreover, T1-LP-20 demonstrates superior reversible capacity and cycling stability over T1 (Fig. 2e and Fig. S12 in Supporting information), showing improvement in reversible capacity (from ~260 mAh/g to ~300 mAh/g) and capacity retention (from 95.4% to 97.5%) after 200 cycles. Fig. S13 (Supporting information) shows the cycling performance of T1-LP-20 at a current density of 200 mA/g. After 300 cycles, the capacity retention is 77.8%, while T1 only retains 44.7%. At a current density of 50 mA/g, after 100 cycles, the capacity retention of T1-LP-20 is still 84.7%, whereas T1 only retains 74.2%, further highlighting the excellent cycling performance of T1-LP-20. Additionally, the overall performance of T1-LP-10 with a 4 nm coating layer is inferior to that of T1-LP-20 with a 2 nm coating layer. This may be due to the increased coating thickness, which lengthens the internal current conduction path of the battery, thereby increasing the resistance to electron and ion migration, negatively impacting the conductivity of the battery and reducing its performance. Table S8 (Supporting information) presents a comparison of the performance with other modified materials to highlight the performance advantages of this modification method.
Figure 2
Figure 2.
Electrochemical study of T1 and T1-LP-X samples: (a) The first cycle charge-discharge curve. (b) Comparison of the ICEs and the first cycle charge capacities. (c) Comparison of the platform capacities and slope capacities. (d) Rate performance. (e) Cycling performance of T1 and T1-LP-20 (testing conditions in Supporting information). Comparison of (f) the first cycle charge-discharge curves and (g) the rate capabilities of T1//NFM versus T1-LP-20//NFM in full cells. (h) Cycling performance of T1-LP-20//NFM full cell at 0.1 C.
To further evaluate the practical performance of T1-LP-20 as anode materials, we assembled 2032-type coin full cells (full cell configuration in Fig. S14 in Supporting information, NFM applied as cathode materials). The first charge-discharge curves at 0.1 C (Fig. 2f) shows that the first-cycle discharge capacity of T1//NFM is 81 mAh/g with an ICE of 62%, while the first-cycle discharge capacity of T1-LP-20//NFM is 94 mAh/g with an ICE of 72%. The rate performance tests of full cells (Fig. 2g and Fig. S15 in Supporting information) shows that discharge capacities of T1-LP-20//NFM at 0.1, 0.5, 1, 2, 3 C, and after recovery to 0.1 C are 91, 85, 76, 63, 40, and 85 mAh/g, respectively, demonstrating the improved and superior charge-discharge capability of T1-LP-20//NFM over T1//NFM. The cycling performance tests of full cells were carried out with three activation cycles at 0.1 C first, then cycled at 0.5 C until 100 cycles (Fig. S16 in Supporting information). The impedance changes after 100 cycles (with three activation cycles) are compared. As shown in Fig. S17 (Supporting information), T1-LP-20//NFM exhibits lower impedance than that of T1//NFM, which may be one of the reasons of its superior rate performance. Subsequently, we cycled the full battery for 150 cycles at 0.1 C, and the capacity retention of T1-LP-20//NFM and T1//NFM were 84% (Fig. 2h), and 79% (Fig. S18 in Supporting information), respectively, proving the effectiveness of LP assisted surface modification method in improving the cycle life of the full battery.
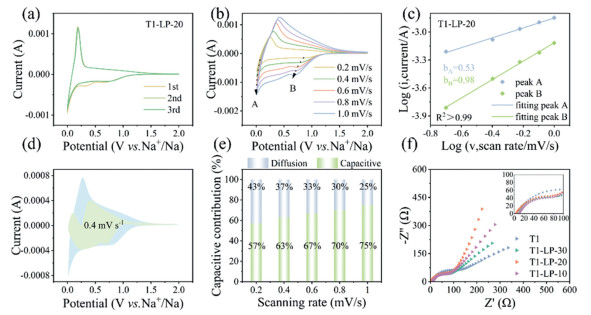
Fig. 3a and Fig. S19 (Supporting information) show the first three cyclic voltammetry (CV) curves at a scan rate of 0.2 mV/s for the T1, T1-LP-X (X = 30, 20, and 10) electrodes. In the first cycle, all liquid paraffin electrodes modified materials T1-LP-X exhibit two distinct reduction peaks while T1 shows only one broad reduction peak, possibly due to the introduced LP-derived carbon coating layer. The reduction peak in the range of 0.2–0.5 V is attributed to the formation of the SEI film [32]. The reduction peak observed in the range of 0.5–1.0 V in T1-LP-20 is likely caused by the reduction of oxygen defects and the decrease in specific surface area [33]. In the subsequent cycles, no reduction peaks appear between 0.5–1.0 V, indicating that this reaction is irreversible. The CV curves in the following cycles are nearly identical and overlap, suggesting that T1-LP-20 electrode exhibits good stability. The capacitive effect of T1-LP-20 electrode was analyzed qualitatively via its CV curves at different scan rates of 0.2, 0.4, 0.6, 0.8, and 1.0 mV/s (Fig. 3b), by the relationship between the peak current (i) and the scan rate (v) in equations in exponential form (Eq. 2) or logarithmic form (Eq. 3) [23,34]:
i=avb
(2)
logi=loga+blogv
(3)
Figure 3
Figure 3.
Charge-storage kinetics analysis of T1-LP-20: (a) The first three CV curves at a scan rate of 0.2 mV/s. (b) The CV curves at different scan rates. (c) The relationship between log(v) and log(i) and the linear fitting of the b value. (d) The capacitive contribution ratio (green area) in the CV curve at 0.6 mV/s. (e) The capacitive contribution ratio at 0.2–1.0 mV/s. (f) EIS of all samples after 10 cycles of cycling.
a and b are adjustable variables where b represents the slope of the logarithmic relationship between the peak current and scan rate in Eq. 3. The electrochemical process is diffusion-controlled, surface-controlled, or their combination when b is 0.5, 1.0, or a value between them, respectively [35,36]. In Fig. 3b, the selected peaks of T1-LP-20 are marked as A and B. The current at the 0.01 V reduction peak is chosen for the plateau region, while the current at the reduction peak near 0.5 V is selected for the slope region. As shown in Fig. 3c, in the plateau region, the b value gradually approaches 0.5, indicating that the kinetic behavior of T1-LP-20 is governed by diffusion control. The b value of T1-LP-20 in the slope region is approximately 1.0, corresponding to the capacitive storage behavior of Na+ at surface-active sites. The contributions of diffusion control or capacitive/surface control to the electrode material can be quantified using the Eqs. 4 and 5 [37]:
i(V)=k1v+k2
(4)
i(V)=k1v+k2v0.5
(5)
where i is the current density, v is the scan rate, and k1 and k1v are adjustable parameters, k1v represents the contribution of the capacitive-controlled process, while k2v0.5 represents the contribution of the diffusion-controlled process. Fig. 3d shows the cyclic voltammetry curve at a scan rate of 0.4 mV/s, where the total area is in blue and the capacitive contribution is in green area, accounting for 63% of the total area. The capacitive contribution at scan rates of 0.2, 0.4, 0.6, 0.8, and 1.0 mV/s are 57%, 63%, 67%, 70%, and 75%, respectively (Fig. 3e and Fig. S20 in Supporting information). The increasing contribution from capacitive Na+ storage from 57% to 75% with increasing scan rate indicates that the T1-LP-20 electrode mainly exhibits efficient capacitive energy storage behavior, which is attributed to its abundant Na+ adsorption sites and excellent conductivity. The synergistic effect between the LP-derived carbon coating layer and T1 facilitates rapid charge transfer [38]. It is worth noting that some of the pseudocapacitive currents are greater than the actual measured CV currents. This deviation may stem from the limitations of the calculation method: on one hand, the Ohmic resistance was not accounted for in the calculation, which could lead to inconsistencies between the experimental data and the fitting results in the oxidation/reduction peak positions; on the other hand, the residual current was not considered when the scan direction was reversed, resulting in the fitted current exceeding the experimentally measured value within the CV measurement range [39].
The charge transfer resistances (Rct) of T1-LP-20 before and after cycling are lowest among all samples (Fig. 3f and Fig. S21a in Supporting information), reflecting its enhanced sodium storage kinetics. We also conducted EIS tests after 200 cycles (Fig. S21b in Supporting information). The results show that the Rct of T1-LP-20 is still lower than that of T1, indicating that the reduction in charge transfer resistance is maintained over extended cycling. Furthermore, to illustrate the better reaction kinetics of T1-LP-20, temperature-dependent impedance tests from 20 ℃ to 60 ℃ were conducted, and the temperature-dependent EIS spectra from 20 ℃ to 60 ℃ were analyzed (Figs. S22a and b in Supporting information). The sodium ion diffusion activation energy, Ea, was calculated using the Arrhenius equation (Fig. S22c in Supporting information) [40]:
T/RT=Aexp(−Ea/RT)
(6)
where T is the absolute temperature, RT is the impedance, and R is the standard gas constant. The diffusion activation energy of Na+ in T1 is 65.68 kJ/mol, while in T1-LP-20, it is 45.63 kJ/mol, indicating that Na+ has a higher diffusion rate in T1-LP-20 and can more easily migrate or participate in reactions within T1-LP-20.
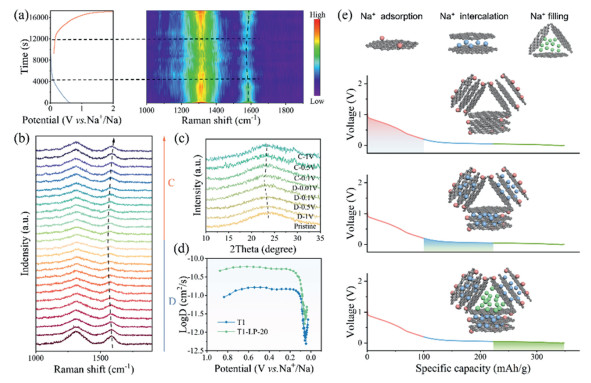
So as to better understand the sodium ion storage mechanism and structural evolution process, in situ Raman and ex situ XRD were carried out on the T1-LP-20 material. As shown in Figs. 4a and b, a unified normalization process was conducted to better compare the peak shapes and positions. The pristine sample before cycling shows D and G bands initially appeared at 1310 cm−1 and 1575 cm−1, respectively. During the adsorption process, sodium ions primarily adsorb on the surface and defect sites [41]. Below 0.1 V, the intensity of the D band from carbon significantly decreases, indicating that the defects on the carbon surface are covered by sodium clusters via the adsorption of Na+, which restricts the stretching vibrations of sp3 carbon atoms. During charging, the D band intensity recovers, suggesting the detachment of sodium metal cluster from the closed-pore structure and the recovery of defects on carbon surface to their original state. The G band gradually shifts to a lower wavelength as the discharge depth increases. This suggests that Na+ ions are inserted into the carbon layers of hard carbon, causing the π* anti-bonding orbitals to be occupied by electrons, indicating that negative charge gradually transfers to the graphene sheets. This results in ion-type Na-C interactions [42,43]. Fig. 4c shows the ex-situ XRD pattern of the T1-LP-20 electrode at a current density of 50 mA/g. During the discharge process from 1.0 V to around 0.5 V, there were no significant changes in the (002) peak, indicating that Na+ ions primarily adsorb on the carbon surface rather than intercalating into the (002) interlayers. When the discharge potential is below 0.5 V, the (002) peak shifted to a lower angle, indicating that Na+ ions were embedded and filled between the graphene layers during the plateau stage, which in turn caused an expansion of the interlayer spacing [16]. During the charging process, the (002) peak gradually recovered to its initial position, indicating the excellent reversibility and structural stability of T1-LP-20 electrode throughout the entire cycle. To further understand kinetics of the Na+ storage process, a galvanostatic intermittent titration technique (GITT) was used to calculate the Na+ diffusion coefficient (DNa+ ) [44,45]. Fig. 4d compares the diffusion coefficients of Na+ of T1 and T1-LP-20 electrodes during their discharge processes. Diffusion coefficients did not decrease until electrodes were discharged (sodiated) to around 0.2 V, which is primarily due to the adsorption of Na+ primarily on the edges of the graphite layers and surface defects in the sloping voltage region (above 0.2 V), where faster kinetic reactions occur [13]. The lower diffusion coefficients are mainly concentrated in the low-voltage plateau region (< 0.2 V), Na+ needs to conquer the electrostatic repulsion caused by the charge distribution in order to embed and fill the carbon layers, which leads to slower diffusion in the bulk phase [46,47]. This is also consistent with Figs. 4c and d that the energy or Na+ storage process at low voltage potential is diffusion controlled. The Na+ diffusion coefficients reach minimum values at 0.05 V then increase, attributed to Na+ filling into closed pores [31,48]. Additionally, the LP-derived carbon layer provides additional intercalation sites between 0.05–0.2 V, allowing sodium ions to enter between the carbon layers, while the hard carbon continues to offer additional sodium storage sites [49]. This behavior is also evident from the cyclic voltammetry (CV) and charge-discharge curves, where the hard carbon coated with the derived carbon layer shows significant changes in the 0.05–0.2 V range. This indicates that the derived carbon layer primarily influences the insertion sites of sodium ions and promotes the intercalation reactions of the material. Subsequently, the fifth charge-discharge curve was transformed into a differential capacity (dQ/dV) curve through differential capacity analysis (Fig. S24a in Supporting information). From the figure, it can be seen that the voltage ranges of 2.0–0.2 V, 0.2–0.05 V, and 0.05–0.00 V correspond to the three stages of sodium storage: adsorption, intercalation, and filling, respectively. Then, the differential capacity in each discharge voltage range was integrated to calculate the contribution of each stage to the total capacity. The calculated contributions of adsorption, intercalation, and filling to the total capacity are 50.6%, 46.1%, and 3.3%, respectively (Fig. S24b in Supporting information). It can be concluded based on the above analysis that the Na+ storage mechanism follows an "adsorption-intercalation-filling" model, corresponding to red-blue-green sections in Fig. 4e.
Figure 4
Figure 4.
Energy storage mechanism and structural evolution of T1-LP-20 electrode: (a) In situ Raman spectra (right) with time-potential (left) during the first discharge/charge cycle. (b) In situ Raman spectroscopy during the discharge/charge process. (c) Ex-situ XRD patterns of T1-LP-20 at different voltages. (d) Sodium-ion diffusion coefficients of T1-LP-20 vs. T1 at sodiation process estimated from GITT curves. (e) Proposed sodiation process of T1-LP-20 at different discharge stages.
In summary, we successfully coated a uniform liquid paraffin-derived carbon layer onto the surface of commercial hard carbon with controllable thickness. This surface modification strategy can not only effectively improve the pore structure of commercial hard carbon, leading to a significant reduction in SSA thereby enhancing the material's reversible capacity and ICE, but also increase the ordering of the carbon layer on the surface of hard carbon, improving the material's rate performance. Compared to T1, T1-LP-20 showed an approximately 10% increase in ICE, an approximate 40 mAh/g increase in the first-cycle charge capacity, as well as enhanced rate capability and cycling performance. Overall, this study provides new insights into the modification engineering of HC materials for sodium storage.
Declaration of competing interest
The authors declare that they have no known competing financial interests or personal relationships that could have appeared to influence the work reported in this paper.
CRediT authorship contribution statement
Jiaqi Liu: Writing – original draft, Visualization, Methodology, Formal analysis, Data curation. Sishi Li: Formal analysis, Data curation. Yandong Xie: Data curation. Ziqiang Fan: Data curation. Zhenyuan Miao: Data curation. Pengwei Jing: Data curation. Yuecong Chen: Formal analysis, Data curation. Jian Zhu: Supervision. Chao Yang: Supervision. Xingbin Yan: Supervision, Conceptualization.
Acknowledgments
This work was financially supported by the National Key R & D Program of China (No. 2022YFB2402600), National Natural Science Foundation of China (Nos. 22279166, 52203346), Guangdong Basic and Applied Basic Research Foundation (No. 2022B1515120019).
Supplementary materials
Supplementary material associated with this article can be found, in the online version, at doi:10.1016/j.cclet.2025.111112.
X. Feng, Y. Li, Y. Li, et al., Energy Environ. Sci. 17 (2024) 1387-1396. doi: 10.1039/d3ee03347c
Figure 1
(a) The preparation flowchart of T1-LP-X (X = 10, 20, or 30). TEM image of (b) T1 and (c) T1-LP-20. (d) XRD spectra. (e) Interlayer spacing and La values. (f) Raman spectra of T1 andT1-LP-X. (g) XPS survey spectra of T1 and T1-LP-20.
Figure 2
Electrochemical study of T1 and T1-LP-X samples: (a) The first cycle charge-discharge curve. (b) Comparison of the ICEs and the first cycle charge capacities. (c) Comparison of the platform capacities and slope capacities. (d) Rate performance. (e) Cycling performance of T1 and T1-LP-20 (testing conditions in Supporting information). Comparison of (f) the first cycle charge-discharge curves and (g) the rate capabilities of T1//NFM versus T1-LP-20//NFM in full cells. (h) Cycling performance of T1-LP-20//NFM full cell at 0.1 C.
Figure 3
Charge-storage kinetics analysis of T1-LP-20: (a) The first three CV curves at a scan rate of 0.2 mV/s. (b) The CV curves at different scan rates. (c) The relationship between log(v) and log(i) and the linear fitting of the b value. (d) The capacitive contribution ratio (green area) in the CV curve at 0.6 mV/s. (e) The capacitive contribution ratio at 0.2–1.0 mV/s. (f) EIS of all samples after 10 cycles of cycling.
Figure 4
Energy storage mechanism and structural evolution of T1-LP-20 electrode: (a) In situ Raman spectra (right) with time-potential (left) during the first discharge/charge cycle. (b) In situ Raman spectroscopy during the discharge/charge process. (c) Ex-situ XRD patterns of T1-LP-20 at different voltages. (d) Sodium-ion diffusion coefficients of T1-LP-20 vs. T1 at sodiation process estimated from GITT curves. (e) Proposed sodiation process of T1-LP-20 at different discharge stages.

 DownLoad:

 下载:
下载:


 下载:
下载:
