College of Chemistry and Materials Science, Shanghai Normal University, Shanghai 200234, China
b.
State Key Laboratory of Transducer Technology, Shanghai Institute of Microsystem and Information Technology, Chinese Academy of Sciences, Shanghai 200050, China
c.
2020 X-Lab, Shanghai Institute of Microsystem and Information Technology, Chinese Academy of Sciences, Shanghai 200050, China
d.
Xiangfu Laboratory, Jiashan 314100, China
e.
School of Microelectronics, Shanghai University, Shanghai 200444, China
f.
Department of Pharmacy, The Second Hospital of Hebei Medical University, Shijiazhuang 050000, China
g.
Center of Materials Science and Optoelectronics Engineering, University of Chinese Academy of Sciences, Beijing 100049, China
* Corresponding authors at: State Key Laboratory of Transducer Technology
Shanghai Institute of Microsystem and Information Technology
Received Date:
30 October 2024 Accepted Date:
17 March 2025 Revised Date:
17 January 2025 Available Online:
15 February 2026
Abstract:
The implementation of multiple pathogen testing is essential for a rapid response to future outbreaks and for reducing disease transmission. This study introduces a 96-channel microfluidic chip, fabricated through a molding process, which enables the batch detection of pathogens. It explores the rapid lysis and elution processes of pathogens within the microfluidic chips to ensure that nucleic acid extraction, elution, and amplification are completed entirely within the chip. This chip can extract nucleic acids from samples in just 10 min, achieving an extraction efficiency comparable to that of traditional in-tube methods. An oil phase is pre-loaded into the chip to effectively prevent aerosol contamination. This approach allows for the simultaneous detection of 21 common respiratory pathogens, with a detection limit of 10 copies per reaction. Furthermore, applications involving clinical samples demonstrate significant practicality. Compared to many traditional in-tube pathogen detection methods and molecular biology technologies that utilize microfluidic chips, this detection chip not only enables simultaneous detection of multiple pathogens but also demonstrates high sensitivity.
Although COVID-19 infection rates and hospitalizations have declined over the past two years, this does not mean that people's health security has been fully restored [1]. Viruses such as hand-foot-mouth disease (HFMD) in Vietnam [2], dengue fever (DF) in China [3], monkeypox virus (Mpox) in The Netherlands [4], and swine H1N2 in America [5] continue to be frequent outbreaks, which have raised significant global health concerns. Early diagnosis and isolation are essential for controlling the spread of respiratory diseases due to their rapid transmission routes, which could effectively curb the spread of respiratory pathogens, particularly in the absence of rapidly suppressive vaccines [6]. In recent years, medical standards have improved alongside advancements in science and technology. Current detection methods for pathogens have gradually diversified, primarily into immunoassays and molecular diagnostics [7]. While immunoassays are characterized by their simplicity, speed, and cost-effectiveness, they may not always be ideal for detecting infections in the early stages due to the necessary window period for antibody generation [8–10]. Molecular diagnostics [11], which focuses on processing and analyzing nucleic acids such as DNA and RNA, encompasses techniques including polymerase chain reaction (PCR), loop-mediated isothermal amplification (LAMP), next generation sequencing (NGS), fluorescence in situ hybridization (FISH), and biochips. Compared with immunoassays, molecular diagnostics facilitate point-of-care testing with high detection sensitivity. However, LAMP may suffer from potential nonspecific amplification, which can lead to decreased accuracy and a limited ability to detect multiple targets in a single reaction [12]. FISH [13] and NGS [14] primarily focus on blood and tumor detection, but they also present several disadvantages, including a cumbersome detection process. Biochips are frequently employed in drug screening, new drug development, and disease detection [15]; however, their development is challenging and less flexible. The World Health Organization (WHO) regard reverse transcription-polymerase chain reactions (RT-PCR) as the gold standard [16] for diagnosing various diseases due to its exceptional sensitivity, straightforward procedure, and ability to accurately detect multiple targets.
Comprehensive nucleic acid detection across multiple respiratory tracts is essential for the swift and accurate identification of respiratory ailments. However, traditional detection methods encounter considerable challenges due to lengthy and complex nucleic acid extraction processes conducted in open environments. These processes not only generate aerosols but also increase the risk of operator infection. Consequently, there is an urgent need to develop nucleic acid extraction methods that can be fully enclosed and automated. Among the various techniques available, magnetic bead-based extraction and purification stand out as the most suitable for automated operation [17]. By utilizing the paramagnetic properties of magnetic ions, the surfaces of magnetic beads [18] and particles are modified, facilitating the precise identification of nucleic acid molecules. These particles subsequently extract, capture, and isolate nucleic acid molecules with high specificity and efficiency. Compared to other nucleic acid extraction methods, this approach enhances the adsorption of small DNA fragments onto magnetic beads, thereby enabling the extraction of complete biological samples that are more suitable for further study [19]. Furthermore, leveraging the paramagnetic properties of magnetic particles for external manipulation can advance nucleic acid extraction toward a more semi-automated and fully automated process. This method also requires minimal equipment and is suitable for processing a wide range of samples. However, conventional magnetic bead-based nucleic acid extraction is still performed in open environments, failing to mitigate aerosol propagation [20,21].
Microfluidic chips offer numerous advantages, such as high efficiency, sensitivity, automation, compact size, and ease of integration Microfluidic chips offer numerous advantages, such as high efficiency, sensitivity, automation, compact size, and ease of integration [22]. Their precisely designed internal structures effectively control flow rates and volumes, which minimizes aerosol dispersion, limits contamination, and reduces the risk of disease transmission. Some researchers have integrated nucleic acid detection into these compact, highly integrated microfluidic chips, which exhibit a reduced susceptibility to environmental interference and resource constraints. These chips enable more precise and miniaturized reaction regions for reagents, significantly enhancing reaction efficiency and establishing a more stable foundation for subsequent automated operations. Although the introduction of microfluidic chips has substantially decreased aerosol transmission, a small degree of transmission persists. Berry et al. [23]. were the first to propose that different phase reagents could be separated based on varying surface tensions. For instance, the surface tension between oil and water can effectively separate the two phases, with the oil phase enveloping the water phase, thereby significantly reducing volatilization and splashing. Microfluidic chips that utilize complete oil seal processing effectively mitigate aerosol transmission issues, thereby enhancing the safety of experimental operations. Lin's team developed a microfluidic chip capable of fast detecting the foodborne bacterium Listeria monocytogenes through electrochemical impedance [24]. The integration of magnetic beads and microfluidic technology not only enhances the efficiency and completeness of nucleic acid chain extraction but also significantly minimizes reagent usage. Most importantly, this approach effectively mitigates aerosol dispersion, thereby substantially reducing the risk of infection for operators. The utilization of microfluidic chip technology, characterized by its low reagent consumption and straightforward operation, enables non-professionals to quickly learn and implement it during epidemic outbreaks, thereby greatly improving detection efficiency. Consequently, high-throughput microfluidic chips and their associated rapid detection technologies have emerged as pivotal strategies in epidemic prevention and control.
Despite significant advancements in reaction monitoring, including improvements in reagents and the expedited treatment of enzymes, challenges associated with biological sample processing remain urgent. To address this issue, the Rena Dvoretzky team developed a test box that utilizes glass beads to effectively break down Candida albicans in just 4 min [25]. Conversely, Mengzhe Li's team employed corona polarization within a centrifuge tube to achieve the lysis of Staphylococcus aureus in only 40 s [26]. However, both methods do not ensure control over aerosol generation during the process and rely solely on physical means for the mechanical lysis of pathogens, which compromises the integrity of nucleic acid extraction. In summary, it is crucial to develop a fast, simple and high-throughput [27] nucleic acid detection chip.
This study presents a high-throughput microfluidic chip that integrates lysis, washing, and elution processes. This chip enables the rapid detection of 96 biological samples concurrently, facilitating quick screening and precise identification of various pathogens through complete oil-sealed processing via the oil-in-water mechanism, which leverages the differences in boiling points between aqueous reagents and mineral oil to conduct lysis, washing, elution, and amplification entirely within the oil phase, thereby mitigating aerosol transmission risks. Furthermore, we undertook a comprehensive analysis of the rapid pre-treatment of pathogens. Our research is organized into three principal sections. First, on-chip conversion was executed throughout the entire process, with experimental results confirming the feasibility of this approach. Consequently, the detection limit for on-chip testing was established, ultimately determining that it can reach 10 copies per reaction. Building on the on-chip conversion, extraction efficiency within the chip was also evaluated through full-process experiments with high-concentration plasmids, quantitatively analyzing the nucleic acid extraction amounts via a previously established standard curve. Second, limit analysis for the rapid pre-treatment of pathogens was conducted using SARS-CoV-2 pseudoviruses, optimizing the RT-qPCR timing based on lysis and elution, ultimately establishing a total pre-treatment time of 10 min. Finally, this chip was used to detect plasmids from 21 different pathogens and perform on-chip detection with various biological samples, demonstrating the chip's high-throughput capability for simultaneous detection of multiple pathogens while validating its efficiency in multiplex pathogen screening.
Polydimethylsiloxane (Dow Corning, USA), polymethyl methacrylate (shanghai, China), PDMS film (Hangzhou Guinie Advanced Materials Co., Ltd., China), metal-mold (Shanghai ZhanBiao Biotechnology Co., Ltd., China) SARS-CoV-2 pseudovirus particles were provided by Guangzhou Bangsheng Biotechnology Co., Ltd., with an initial concentration of 200 copies/µL. Nucleic acid extraction reagents (lysis solution, proteinase K) for SARS-CoV-2 pseudovirus were sourced from commercial kits (Sansure Biotech Inc., China). Mineral oil (Fisher Scientific, USA) was used as the oil phase for reagent separation and sealing.
Instant polymerase chain reaction quantitative PCR (qPCR) was performed using the SLAN-96 PCR system from Shanghai Hongshi Medical Technology Co., Ltd. Chip PCR was conducted using an in situ PCR instrument (Eppendorf, Germany). Upright fluorescence microscope (Model IX51; Olympus, USA).
The entire preparation process of the microfluidic chip is illustrated in Fig. 1A. Polydimethylsiloxane (PDMS) is combined with a curing agent in a weight ratio of 10:1. The mixture is stirred uniformly with a glass rod and placed in a vacuum chamber, where it is kept under vacuum until all air bubbles produced during stirring have completely dissipated. The bubble-free PDMS is then poured into a metal mold, which has been designed using SolidWorks (Fig. 1D), and allowed to rest on a horizontal platform for 10 min to ensure a smooth surface and complete filling of the microstructures. A 500 µm thick PDMS curing film is then applied from the edge to the center. Subsequently, a 1 mm thick layer of polymethyl methacrylate (PMMA) is placed over the curing film. The assembled components are then positioned on a 90 ℃ hot plate and heated for 2 h until the PDMS is fully cured. After removing the metal block, PMMA, and PDMS film, tweezers are employed to peel off the metal mold and PDMS, during which a 75% alcohol solution is sprayed. The PDMS is then placed in a 105 ℃ oven and heated for 5 min until the alcohol is completely evaporated. Finally, the plasma-treated glass is precisely bonded to the PDMS chip using a homemade alignment fixture (Fig. 1B). After pressing for 1 min and removing the fixture, the assembly is placed in a 105 ℃ oven overnight. Fig. 1C displays the fully fabricated microfluidic chip, while Figs. 1E and F respectively depict the morphological details of individual detection units and droplets within the internal chamber; Fig. 1G further elucidates the hierarchical architecture of the chip through an exploded view diagram.
Figure 1
Figure 1.
(A) Schematic diagram of the preparation of microfluidic chip. (B) Schematic diagram of the microfluidic chip precision bonding. (C) Digital photograph of microfluidic chip. (D) SolidWorks drawing of mental mold. (E) SolidWorks drawing of single structure. (F) Diagram of one chamber. (G) Chip explosion diagram.
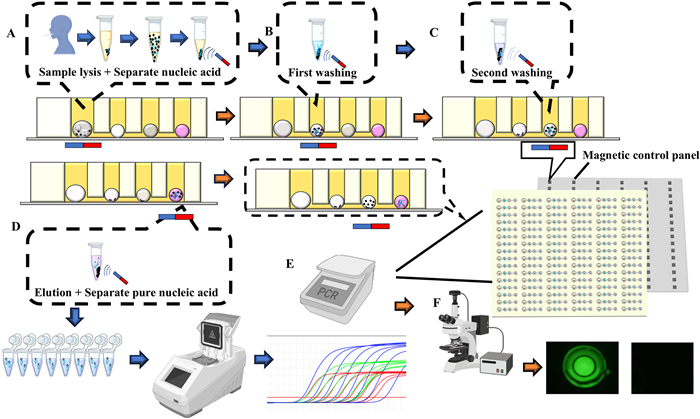
Researchers collect samples from the patient's throat and nasal cavity and store them in a viral preservation solution. After standardized inactivation treatment, the samples are delivered to the operator. By introducing microfluidic chip technology, the integration and simplification of the conventional nucleic acid testing process are achieved (Fig. 2). The operation process is as follows: First, the microfluidic chip is initially placed in a vacuum pump for 10–15 min to minimize air interference within the microfluidic channels. Then, mineral oil is added to fill the prepared microfluidic chip, ensuring that the oil fills the entire microfluidic channel and its four distinct chambers. In the first chamber, a lysis reagent is added, consisting of 7.25 µL of lysis extraction reagent, 0.25 µL of proteinase K, and 0.5 µL of magnetic beads. The second chamber contains wash solution 1, into which 4 µL of 70% ethanol solution is added. The third chamber is designated for wash solution 2, into which 4 µL of a 13% polyethylene glycol-8000 solution is added. Subsequently, 4 µL of PCR reaction reagent is added to the fourth chamber. Finally, 2–10 µL of the viral preservation solution is pipetted into the first chamber. The addition of the aqueous reagents causes rapid formation of water droplets in the oil, resulting in an oil-in-water emulsion. The chip filled with reagents is then placed at the top of a homemade magnetic control device (Fig. 2), allowing the magnetic beads in the first chamber to rapidly aggregate. The magnetic control device maneuvers the beads, causing them to vibrate in the droplets within the lysis chamber for 5 min (Fig. 2A). The beads are then dragged to the second chamber and vibrated for 1 min (Fig. 2B); this process is repeated in the third chamber (Fig. 2C). Finally, the beads are placed in the fourth chamber, where they vibrate for 1 min and then remain stationary for 4 min (Fig. 2D). Finally, the magnetic control device was employed to drag the magnetic beads back into the previous chamber. The beads were then placed in a flat plate PCR device for amplification (Fig. 2E) and subsequently observed using an upright fluorescence microscope (Fig. 2F).
Figure 2
Figure 2.
(A) Sample lysis & separate nucleic acid. (B) First washing, (C) second washing. (D) Elusion & Separate pure nucleic acid. (E) Results of in-tube PCR amplification. (F) On-chip fluorescence results.
After replacing the PCR reagents in the final chamber of the pre-filled microfluidic chip with water, 2 µL of plasmid at a concentration of 109 copies/µL is added to the first chamber of the chip using a pipette. Subsequently, the magnetic beads are relocated to the last chamber using the same magnetic control operation, thereby completing the elution process. To prevent interference from the magnetic beads during subsequent amplification, they are transferred to the second chamber. Next, the liquid from the fourth chamber is pipetted into a centrifuge tube and allowed to stand for layering. After a brief standing period, distinct layering is observed in the centrifuge tube, with the upper layer consisting of mineral oil and the lower layer containing the nucleic acid solution extracted from the pseudovirus. Then, 18 µL of the pre-mixed PCR reaction solution and enzymes from a commercial kit are added to an 8-well strip. In each channel, 2 µL of the extracted nucleic acid solution is introduced. Finally, the setup is placed in the SLAN-96P for the RT-PCR reaction. To perform the PCR for COVID-19, the reaction system is prepared, including the PCR master mix, upstream primers, downstream primers, probes, and deionized water (ddH2O). The prepared reaction mixture is evenly distributed into the 8-well strip, and 2 µL of plasmid at various concentrations (105, 104, 103, 102, 10 copies/µL) is added to the corresponding wells. After sealing the 8-well strip, a brief centrifugation is performed to ensure that the reaction mixture settles appropriately. During the amplification process, the strip is placed in the SLAN-96P device for PCR reaction. The optimized amplification protocol involves an initial denaturation at 95 ℃ for 1 min, followed by denaturation at 95 ℃ for 15 s, and annealing/extension at 60 ℃ for 30 s, repeated for 45 cycles. Finally, a standard curve is generated using Origin software.
The PCR reaction reagents in the fourth chamber of the microfluidic chip were substituted with deionized water, while ensuring that all other reagents remained consistent with those previously stored in the chip. After introducing 200 copies/µL of pseudovirus into the first chamber, five microfluidic chips were subjected to continuous agitation for varying durations (5, 4, 3, 2, and 1 min) using a custom-designed magnetic control device. Following this, the magnetic beads were transferred to the second chamber using the same device (Fig. 2) and agitated for an additional minute. This procedure was then replicated in the third chamber. Subsequently, the beads were placed in the fourth chamber for 1 min of continuous agitation, followed by a 5-min incubation period. The subsequent operations were conducted as described for the 8-well strip experiments.
Based on a lysis time of 5 min, reuse the same reagents and solutions to adsorb and wash the nucleic acids from the pseudovirus. Drag the magnetic beads to the final chamber and employ a magnetic plate to facilitate the reciprocating movement of the beads in the liquid for 1 min. Following this, allow the beads to sit for 4 min, then for 3 min, 2 min, and finally 1 min, respectively. Afterward, use a pipette to transfer the liquid from the fourth chamber into a centrifuge tube and allow it to settle for a period to achieve layering. The subsequent procedures are the same as the experimental steps of the eight-tube in the previous paragraph.
This paper presents an efficient mold design for microfluidic chip preparation, with the chip fabrication process illustrated. The advantage of this method lies in the use of photolithographically fabricated silicon molds, followed by the perforation process with a punching device. This mold-based preparation approach reduces damage to microscopic structures caused by perforation to a certain extent. Furthermore, this procedure significantly mitigates the problem of uneven thickness in microfluidic chips due to variations in the quality of PDMS and curing agents.
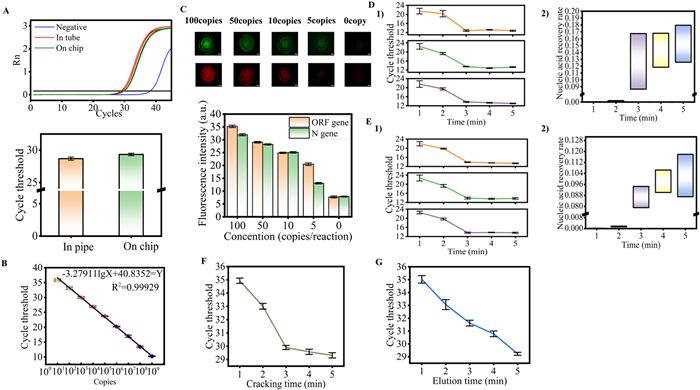
To assess the feasibility of converting the traditional nucleic acid extraction process into an on-chip format, the last chamber of the microfluidic chip, which contained pre-embedded reagents, was initially replaced with deionized water. Nucleic acid extraction and purification were subsequently conducted on the chip using a pseudovirus at a concentration of 200 copies/µL. For control experiments, the same extraction reagents were employed to extract nucleic acids using standard centrifuge tubes, and the same reagents were also utilized on the chip in eight-row tubes. Real-time polymerase chain reaction (PCR) was then performed using the SLAN-96P system. The experimental results (Fig. 3A) indicate that the average cycle threshold (CT) for nucleic acids extracted on the chip is 29.34, compared to an average CT value of 28.86 for nucleic acids extracted off-chip. Furthermore, when the reagents amplified in the tube were analyzed for fluorescence on the microfluidic chip, the results demonstrated that the fluorescence values were approximately equivalent. This outcome suggests that the nucleic acid extraction capability of the microfluidic chip is comparable to that of traditional off-chip methods, thus supporting the feasibility of on-chip nucleic acid extraction and purification. Additionally, we performed on-chip nucleic acid extraction, purification, and amplification using pseudovirus concentrations of 100, 50, 10, 5 copies/µL and 0 copy/µL to evaluate the detection limit of the chip. The experimental results revealed that the sensitivity of the chip can reach as low as 10 copies/µL. ImageJ software was utilized to analyze the fluorescence values, which demonstrated a gradual increase before reaching a plateau phase; after attaining this plateau, the fluorescence difference remained relatively stable. The histogram (Fig. 3C) illustrates that at a pseudovirus concentration of 5 copies/µL, using a 2 µL pseudovirus sample, the minimum detection limit of the chip is confirmed to be 10 copies.
Figure 3
Figure 3.
(A) In-tube and on-chip nucleic acid amplification maps. (B) Gradient amplification map of ORF1ab gene: Y = −3.2791lgX + 40.8352, R2 = 0.99929. (C) Pseudovirus gradient dilution: Pseudovirus gradient copies: 100, 50, 10, 5 copies and 0 copy. Scale bars are 1 mm. (D1) In-tube magnetic beads were used to bind nucleic acid for 1, 2, 3, 4, 5 min. (D2) In the tube, the magnetic beads were bound to nucleic acid at 1, 2, 3, 4, 5 min. (E1) On chip magnetic beads binding of nucleic acid amplification ability map for 1, 2, 3, 4, 5 min. (E2) The map of nucleic acid content bound by magnetic beads in 1, 2, 3, 4, 5 min. (F) Pseudoviruses were lysed for 1, 2, 3, 4, 5 min. (G) Pseudoviruses were eluted for 1, 2, 3, 4, 5 min. Error bars represent the standard deviation based on at least 3 replicates of each experiment.
This study investigates the reduction of sample pretreatment time and its effect on the binding efficiency of magnetic beads. Initially, we examined the rotational dynamics of the magnetic beads within a droplet. In our experimental setup, droplets were placed on a glass slide, followed by the addition of 20-fold diluted magnetic beads. A magnet was employed to manipulate and rotate the droplets. The results indicated a high degree of consistency in the movement of the magnetic beads, which effectively covered and cleaned the droplet surface (Video S1 in Supporting information). This finding provided a foundation for our subsequent microfluidic experiments. Under microscopic observation, we meticulously analyzed the motion of the magnetic beads within the droplets, clearly illustrating their behavior in the microfluidic chip. Subsequently, we conducted a series of tests using the Open Reading Frame 1a/b (ORF1ab) gene plasmid at a concentration of 109 copies/µL in both tubes and microfluidic chips. When combined with the CT results post-integration (Fig. 3D), we identified a significant correlation between the binding time of the magnetic beads to the plasmid and binding efficiency. Specifically, whether in the tube (Fig. 3, D1) or in the microfluidic chip (Fig. 3, E1), binding times of 3, 4, and 5 min yielded minimal differences in nucleic acid binding to the amplified CT. Conversely, when binding times were reduced to 2 and 1 min, a marked decrease in nucleic acid binding efficiency was observed. Utilizing the previously established COVID-19 ORF gene standard curve (Fig. 3B), we further calculated the nucleic acid recovery rate for 3 min of magnetic bead binding without amplification in the microfluidic chip, resulting in a recovery rate of 7.9127% to 9.4534% (Fig. 3, E2). In comparison, the nucleic acid recovery rate after binding magnetic beads in the tube for 3 min ranges from 8.6483% to 16.7341% (Fig. 3, D2). These results indicate that while a shortened binding time can enhance the processing efficiency of the experiment, it also results in a notable decrease in the nucleic acid binding efficiency of the magnetic beads. Therefore, achieving optimal experimental performance necessitates finding an appropriate balance between sample pretreatment time and binding efficiency. These findings serve as a significant reference for the optimization of microfluidic chip technology in the future and establish a foundation for enhancing the sensitivity and reliability of nucleic acid detection.
Currently, the preprocessing of biological samples is primarily conducted in tubes. This process often encounters challenges such as large sample volumes, extended processing times, and cumbersome procedures. To address these issues, many scientific research institutions and medical facilities opt for magnetic bead methods and commercial kits for nucleic acid extraction from biological samples. Compared to cells, pathogens possess a relatively simple structure, smaller size, and uniform composition, resulting in different processing strategies for nucleic acid extraction. These kits typically contain components such as anionic surfactants, cationic surfactants, proteinase K, and magnesium and calcium ions, which effectively disrupt membrane proteins on the surfaces of cells and pathogens, thereby releasing nucleic acids into the solution. During the nucleic acid extraction process, a hydration layer can easily form around nucleic acid molecules. However, in microfluidic structures, high-salt solutions can disrupt this hydration layer and inhibit hydrogen bonding between nucleic acid molecules and water. Upon reaching a specific salt concentration, the conformation of the nucleic acid alters, exposing negatively charged phosphate groups. Under high-salt and low-pH conditions, hydrophobic magnetic beads bind to nucleic acids via hydrophobic interactions, hydrogen bonds, and electrostatic interactions. Sodium ions form a 'salt bridge' with the hydroxyl groups on the surface of the magnetic beads, facilitating the effective adsorption of nucleic acid fragments to the beads. Following this, the salt ions on the surface are removed through multiple washings. Ultimately, due to the water solubility of nucleic acids, they are eluted into the tube for amplification and detection. During the experiment, we observed that the movement of the magnetic beads is crucial to the nucleic acid extraction process. In the lysis chamber, the rotation of the magnetic beads enhances the complete interaction between nucleic acids and magnetic beads within the droplets, effectively preventing damage to the integrity of the nucleic acid molecules caused by centrifugation. In the washing chamber, the adequate movement of the magnetic beads ensures thorough removal of impurities from the bead surface. This mechanism helps to avoid uneven ion concentration distribution in mixed solutions at the microscopic level, thereby reducing experimental errors associated with varying ion concentrations. Based on these fundamental principles, we optimized the sample processing time on the microfluidic chip, encompassing the sample lysis, washing, and elution processes. To investigate the impact of sample lysis time, we conducted on-chip sample lysis time reduction experiments using pseudoviruses. By comparing the CT values of different lysis durations, the results indicate that with a lysis time of 3 min, the on-chip lysis effect is nearly equivalent to that observed at 4 and 5 min. However, when the lysis time is reduced to < 2 min, a notable increase in CT value is evident, suggesting a significant decline in lysis efficiency of biological samples during this timeframe. Additionally, the binding efficiency of magnetic beads to plasmid DNA also exhibited a similar decrease when the lysis time was < 2 min. The specific data are as follows: the CT value at 3 min is 29.90; at 4 min, it is 29.58; at 5 min, it is 29.31; and when the lysis time is reduced to 2 min, the CT value increases significantly, exceeding 30 (Fig. 3F). In summary, the experimental results indicate that extending the lysis time to 3 min within the microfluidic chip significantly enhances both the efficiency and quality of nucleic acid extraction. Conversely, lysis times under 2 min result in decreased lysis efficiency of biological samples, adversely affecting subsequent amplification detection processes. Within the microfluidic chip, we conducted optimization tests on elution time, based on a total sample processing time of 5 min. Pseudoviruses were utilized in the experiment, with elution times set at 5, 4, 3, 2, and 1 min, respectively (Fig. 3G). The results demonstrate that as elution time decreases, the CT value progressively increases, indicating that shorter elution times result in reduced nucleic acid recovery from the magnetic beads. Through optimization, the pretreatment time for biological samples was significantly reduced: 3 min in the lysis chamber, 1 min each in the Elution 1 and Elution 2 chambers, and 5 min in the Elution 3 chamber. Consequently, the total preprocessing time for biological samples can be minimized to as little as 10 min. This optimization provides robust support for the high efficiency of the nucleic acid extraction process.
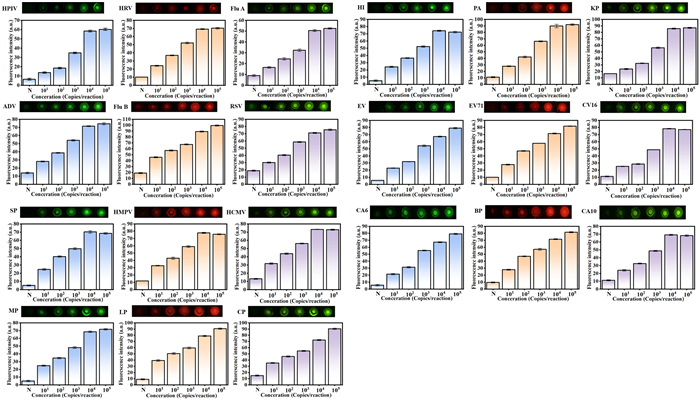
To evaluate the practicality of the microfluidic chip, we first selected a series of commercial kits for the detection of multiple respiratory pathogens. In the specific experimental operation, we performed gradient dilution of the plasmids in the commercial kits, and replaced the amplification reagent in the last chamber with the corresponding reagent in the commercial kits. Then, the experiment was carried out according to the established amplification procedure. Fig. 4 shows the on-chip gradient test results of 21 respiratory pathogen plasmids. 21 kinds of respiratory tract pathogens are: human parainfluenza virus (HPIV), human rhinovirus (HRV), influenza A (Flu A), adenovirus (ADV), influenza B virus (Flu B), respiratory syncytial virus (RSV), streptococcus pneumoniae (SP), human metapneumovirus (HPMV), human cytomegalovirus (HCMV), mycoplasma pneumoniae (MP), chlamydia pneumoniae (CP), legionella pneumophila (LP), klebsiella pneumoniae (KP), pseudomonas aeruginosa (PA), haemophilus influenzae (HI), enterovirus (EV), coxsackievirus 16 (CV16), enterovirus 71 (EV71), coxsackievirus A6 (CA6), coxsackievirus A10 (CA10), bordetella pertussis (BP). The experimental data indicate that the chip can efficiently achieve the parallel detection task of multiple respiratory pathogens, showing excellent multi-target detection ability and wide practicality.
Figure 4
Figure 4.
Fluorescence readings were obtained from 6-carboxyfluorescein (FAM), hexachlorofluorescein (HEX) and carboxy-X-rhodamine (ROX) channels using fluorescence microscope. These are the same fluorescence readings. The error bars represent the standard deviation of at least 3 repeated experiments.
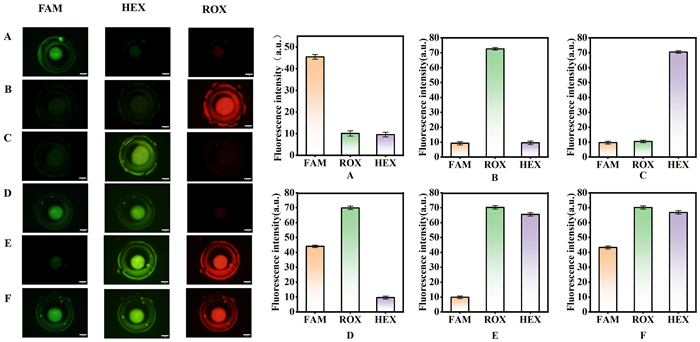
Subsequently, we selected clinical swab samples that were confirmed to be mono-infected with specific pathogens, including KP, Flu B, and HI. These samples, obtained from various patient assays, were analyzed with at least three experimental replicates, and the standard deviation was determined. The entire experimental process was conducted on the chip. Taking the HI-positive sample as an example, the amplification chamber exhibited a significant fluorescence signal solely in the FAM channel (Fig. 5A). Each biological sample displayed distinct fluorescence signals corresponding to its specific amplification chamber and light path (Figs. 5B and C), with no signals or false positives detected for the pathogens in other chambers during the experiment. Furthermore, we tested patient samples infected with multiple pathogens to assess the microfluidic chip's capability to detect mixed infections. Fig. 5D presents the detection results for a mixed infection involving HI and KP pathogens, while Fig. 5E shows the results for a mixed infection with KP and Flu B pathogens. Fig. 5F illustrates the detection results for a mixed infection involving HI, KP, and Flu B pathogens. These findings comprehensively demonstrate the superior capabilities of microfluidic chips in multi-pathogen analysis. Additional analyses of multiple data sets indicated that the detection results are stable. Through numerous sets of parallel detections facilitated by microfluidic chips, these results underscore the potential of microfluidic chips for widespread application in clinical sample testing.
Figure 5
Figure 5.
Fluorescent analysis of clinical nasal swab samples for various respiratory pathogens (A) HI, (B) Flu B, (C) KP, (D) HI and KP. (E) KP and Flu B. (F) HI, KP and Flu B. Scale bars are 1 mm.
In summary, the development of the 96-channel microfluidic chip represents a significant breakthrough in the field of pathogen detection, facilitating the rapid and effective batch detection of 21 or more respiratory pathogens. By employing a four-channel fluorescence detection technology, the chip can simultaneously identify up to 384 pathogens, thereby greatly enhancing detection flexibility and efficiency. This technology streamlines the operational process by performing nucleic acid extraction, elution, and amplification entirely within the chip, offering a practical and efficient solution for addressing future pandemics. Its exceptional extraction efficiency and low detection limit of just 10 copies per reaction underscore its high sensitivity and reliability. Furthermore, the pre-loaded oil phase effectively mitigates aerosol contamination, further enhancing the chip's practicality in clinical settings. Overall, this innovative approach not only surpasses traditional tube-based detection methods in terms of speed and sensitivity but also holds tremendous potential for improving public health monitoring and disease management.
Ethics statement
The study protocol was reviewed and approved by Ethics Review Board of Mount Hua Hospital, Fudan University research ethics committee and by the local National Health Service research ethics committee (2023/681) and conformed to the ethical standards for medical research involving human subjects, as laid out in the 1964 Declaration of Helsinki and its later amendments. Participants provided written informed consent prior to taking part in the study.
Declaration of competing interest
The authors declare that they have no known competing financial interests or personal relationships that could have appeared to influence the work reported in this paper.
This work was supported by grants from the National Key Research and Development Program of China (Nos. 2023YFA0915200, 2023YFA0915204), the Equipment Research and Development Projects of the Chinese Academy of Sciences (No. PTYQ2024YZ0010), the Science and Technology Commission of Shanghai Municipality Project (No. XTCX-KJ-2024–038), the Natural Science Foundation of Hebei Province of China (No. H2024206249), the Postdoctoral Fellowship Program of CPSF (No. GZC20232838), Science and Technology Commission of Shanghai Municipality (No. 22S31901700).
Supplementary materials
Supplementary material associated with this article can be found, in the online version, at doi:10.1016/j.cclet.2025.111109.
[1]
Clifford J Rosen, New England J. Med. 391 (2024) 561–562. doi: 10.1056/nejme2407575
[2]
L.N.T. Nhu, L.N.T. Nhan, T.H. Khanh, et al., Int. J. Infect. Dis. 130 (2023) S110–S111.
Figure 1
(A) Schematic diagram of the preparation of microfluidic chip. (B) Schematic diagram of the microfluidic chip precision bonding. (C) Digital photograph of microfluidic chip. (D) SolidWorks drawing of mental mold. (E) SolidWorks drawing of single structure. (F) Diagram of one chamber. (G) Chip explosion diagram.
Figure 3
(A) In-tube and on-chip nucleic acid amplification maps. (B) Gradient amplification map of ORF1ab gene: Y = −3.2791lgX + 40.8352, R2 = 0.99929. (C) Pseudovirus gradient dilution: Pseudovirus gradient copies: 100, 50, 10, 5 copies and 0 copy. Scale bars are 1 mm. (D1) In-tube magnetic beads were used to bind nucleic acid for 1, 2, 3, 4, 5 min. (D2) In the tube, the magnetic beads were bound to nucleic acid at 1, 2, 3, 4, 5 min. (E1) On chip magnetic beads binding of nucleic acid amplification ability map for 1, 2, 3, 4, 5 min. (E2) The map of nucleic acid content bound by magnetic beads in 1, 2, 3, 4, 5 min. (F) Pseudoviruses were lysed for 1, 2, 3, 4, 5 min. (G) Pseudoviruses were eluted for 1, 2, 3, 4, 5 min. Error bars represent the standard deviation based on at least 3 replicates of each experiment.
Figure 4
Fluorescence readings were obtained from 6-carboxyfluorescein (FAM), hexachlorofluorescein (HEX) and carboxy-X-rhodamine (ROX) channels using fluorescence microscope. These are the same fluorescence readings. The error bars represent the standard deviation of at least 3 repeated experiments.
Figure 5
Fluorescent analysis of clinical nasal swab samples for various respiratory pathogens (A) HI, (B) Flu B, (C) KP, (D) HI and KP. (E) KP and Flu B. (F) HI, KP and Flu B. Scale bars are 1 mm.


 DownLoad:

 下载:
下载:


 下载:
下载:
