College of Chemistry and Chemical Engineering, Henan Key Laboratory of Function-Oriented Porous Materials, Luoyang Normal University, Luoyang 471934, China
Received Date:
12 January 2025 Accepted Date:
12 March 2025 Revised Date:
09 March 2025 Available Online:
15 January 2026
Abstract:
Ln@MOFs by anchoring rare metal ions (Ln) into metal–organic frameworks (MOFs) are proved to have great potential in the field of luminescent molecular thermometer. Nevertheless, the current research indicated that the poor structural stability and low sensitivity hindered their application scope. In this work, a new MOF Zn-450 luminescent thermometer with multiple emission fluorescence characteristics was synthesized by the combination of 3,3′,5,5′-biphenyl tetracarboxylic acid (H4L) and Zn2+ ion under solvothermal conditions. Interestingly, a high relative sensitivity of 1.43 % K−1 was found within 80–300 K based on Zn-450. Subsequently, two high-sensitivity luminescent Ln@MOFs (Ln = Eu and Tb) were further fabricated by doping rare earth ions into Zn-450 based on the post-synthesis strategy. Among them, the Eu@Zn-450 demonstrates various luminous behaviors while achieving an increased relative sensitivity of 1.63 % K−1. In addition, the continuously visible red, pink, and purple luminescent emissions at the same temperature range were observed, suggesting that the Eu@Zn-450 could be utilized as a luminescent colorimetric molecular thermometer. Importantly, this work can present new possibilities for the development of rare earth-doped luminescence and its temperature sensing properties.
Metal-organic framework (MOF), with its periodic network structure and remarkable structural diversity, has attracted extensive attention not only in catalysis, gas adsorption and separation, biochemistry and energy storage [1–4], but also in exploring its fluorescence tunability, which is expected to become an optical thermometer material [5,6]. Of particular, their high porosity may effectively prevent aggregation-induced luminescence quenching, making them as the excellent candidates for encapsulating other luminescent species [7–9]. For instance, lanthanide ions, luminous dyes, and quantum dots can be successfully incorporated into MOF materials for the purpose of color control and temperature sensing [10–12]. Among these, various lanthanide-encapsulated metal-organic frameworks (Ln@MOFs) have garnered increasing attention in the fields of device fabrication, detection, chemical sensing, and biomedicine due to their excellent luminescence properties and good chemical and heat resistance [13–17]. Compared with the traditional luminescent materials, Ln@MOFs can successfully prevent the self-quenching of lanthanide ions through the separation of ligands. Moreover, the spatial regularity of the structural units makes it possible to dope two or three different lanthanide ions into the same framework [18–21].
In recent years, a lot of attention is focused on luminescent molecular thermometers as a result of their wide applications in the aspect of temperature detection under special environment [22,23]. The main reasons are the interesting temperature-dependent luminescence properties of Ln@MOFs [24,25]. It is evident that Eu3+ and Tb3+ have been the most commonly used ions in the solid-state luminescent thermometers of co-doped compounds due to their strong visible luminescence in the red and green regions, respectively [26,27]. Cui et al. reported a ratio luminescent MOF thermometer based on Eu3+ and Tb3+ co-doping for the first time [28]. Very recently, Chen et al. explored the luminescent thermometers by a luminescent mixed lanthanide metal–organic framework approach. The targeted self-referencing luminescent thermometer based on two emissions of Tb3+ at 545 nm and Eu3+ at 613 nm is more reliable, instantaneous and has higher sensitivity than the parent Tb-MOF based on one emission at a wide range from 10 K to 300 K [29]. These current studies are proved that the Eu3+/Tb3+ doped solid luminescence thermometers have obvious advantages of fast light response, high precision, good stability as well as great performance in biological environment, which makes them more promising for applications [30,31]. Thus, building novel fluorescent MOFs doped with lanthanide ions for the exploration of luminescent MOF thermometers remains an important research topic.
In the present work, we selected elaborately rigid carboxylic acid ligands with multiple coordination sites to reaction with zinc nitrate by the solvothermal approach. A new MOF Zn-450 was acquired successfully. Soon afterwards, two Ln@Zn-450 (Ln = Eu and Tb) were synthesized smoothly with rare earth ion immersion way, which may achieve the purpose of fluorescence modification under the premise of good temperature sensitivity and dependence. Importantly, it can be explored as a unique visual luminescent thermometer while improving the sensitivity of temperature. Our work provides an alternative method for the synthesis of high-sensitivity ratio luminescent thermometers through the slow diffusion route of post-doping of rare earth ions (Eu3+, Tb3+) into MOF.
Materials and instruments: All solvents and reagents used were purchased from Commerce Company. Instruments used for crystal structure analysis and sample evaluation tests were described in Supporting information. Detailed crystal data of Zn-450 were given in Table S1 (Supporting information), and partial bond lengths and bond angles were given in Table S2 (Supporting information).
Synthesis of Zn-450: Zn(NO3)2·6H2O (0.1 mmol, 29.1 mg) and H4L (0.05 mmol, 17.3 mg) were added into 5 mL of mixed solvent (DMF/DMSO = 2:3), which were sealed in the reactor and heated at 120 ℃ for 72 h. The mixture was cooled to room temperature (10 ℃/h) to form regular transparent bulk crystals. Yield: 19.3 mg (52.2 %, based on H4L).
Synthesis of the Ln@Zn-450: The synthesis of the Ln@Zn-450 was carried out by adding 20 mg of Zn-450 in a 5 mL of mixed solvent (DMA/DMSO = 2:3) containing Ln(NO3)3·6H2O (20 mmol/L, Eu(NO3)3·6H2O or Tb(NO3)3·6H2O) for 16 h (120 ℃). The obtained light transparent sample was centrifuged and washed with C2H5OH to remove redundant Eu3+ or Tb3+and then dried in air.
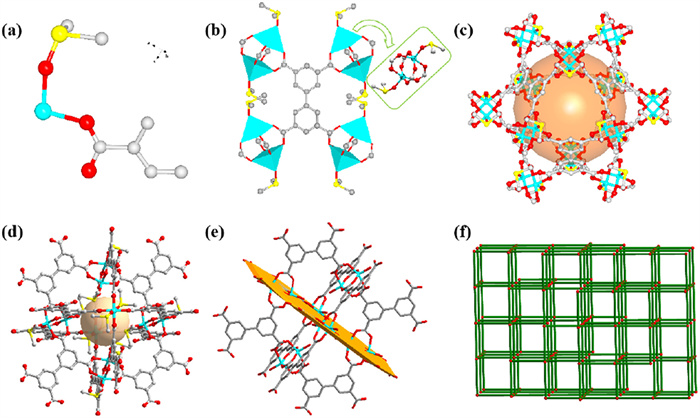
Single crystal X-ray analysis showed that Zn-450 crystallized in the R lattice space group of the tripartite system. The basic asymmetric unit of Zn-450 consists of half zinc atom, a quarter carboxylic acid ligand, and half DMSO molecule (Fig. 1a). In Zn-450, each zinc atom coordinates four carboxylate oxygen atoms from four different ligands, with the coordinating terminal DMSO molecule in the axial position (Fig. 1b). More intuitively, each carboxylate bridges two zinc atoms in the classical mode of η2 to form another zinc dimer, coordinated as a [Zn2(CO2)4] paddle wheel (Fig. 1b). To our delight, the two benzene rings in crystal Zn-450 grow symmetrically and planarly without distortion. In addition, the four coordination carboxyl groups are basically in the same plane as the phenyl group. Thus, the 3D framework created by parallel connection and assembly of organic ligands consists of two different types of filled open cages. The cage structure of the larger cavity was assembled by 12 paddle-wheels Zn2(CO2)4 clusters and 6 ligands (Fig. 1c). The diameter of the circle filled by the cage was about 13.6 Å. However, the small cage was enclosed by 6 Zn2(CO2) clusters and 6 ligands. The reason for the small pore diameter was that the growth direction of DMSO molecules occupied a certain spatial position (Fig. 1d). As illustrated in Fig. 1e, the 12 organic ligands are vertically aligned with the three equidistant rings formed by the SUB wheel. By analyzing the network topology of Zn-450 (Fig. 1f), it can be found that the Zn2(CO2)4 paddle-wheel is reduced to a planar 4-c node, and the organic ligand is reduced to two 3-c connectors [32].
Figure 1
Figure 1.
(a) X-ray crystal structure of Zn-450: Asymmetric units. (b) The mode of coordination between zinc and ligand (Inset: The SBU coordination model of dinuclear Zn). (c) Cage assembled with 12 paddle-wheels Zn2(CO2)4 clusters and 6 ligands. (d) Cage surrounded by 6 Zn2(CO2) clusters and 6 ligands. (e) Three cross-sectional perpendicular structure. (f) Simplified 3D topological model of Zn-450.
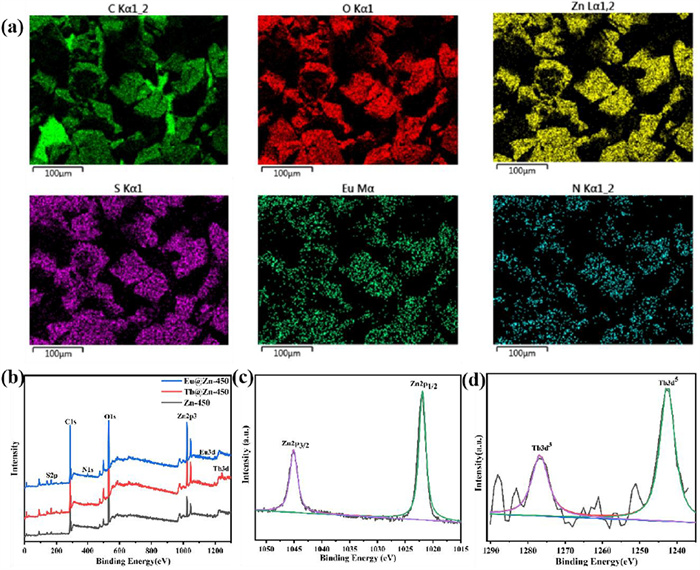
XRD patterns of Zn-450 and Ln@Zn-450 were shown in Fig. S1 (Supporting information). The diffraction peaks of the synthesized Zn-450 and Ln@Zn-450 are in good agreement with those obtained from the crystal structure simulation of Zn-450, indicating that the sample Zn-450 has a high phase purity and the introduction of Ln3+ does not change the original structure of Zn-450. Similarly, it was found that the IR spectra of Ln@Zn-450 were basically consistent with that of Zn-450, which further proved that the introduction of Ln3+ (Eu3+ or Tb3+) did not change its internal framework (Fig. S2 in Supporting information). TGA curves of Zn-450, Tb@Zn-450 and Eu@Zn-450 were shown in Fig. S3 (Supporting information). They lost a portion of the weight at 100 ℃. Subsequently, a significant weightlessness behavior was observed at 300 ℃, resulting from the gradual decomposition of the skeleton. The curves tended to be smooth at 500 ℃, indicating that the structure collapsed completely. The SEM image of Fig. S4 (Supporting information) showed Zn-450 exhibited the regular cubic shape with the main size of about 0.1–0.2 mm. After doping Ln3+, the morphology and size of Zn-450 were well maintained. EDX analysis of Zn-450 and Ln@Zn-450 (Eu3+ or Tb3+) demonstrated the presence of Eu and Tb elements. The element mapping also supported the uniform distribution of Ln3+ ions (Fig. 2a, Figs. S5 and S6 in Supporting information). As illustrated in Fig. S7 (Supporting information), the UV–vis absorption spectra of Zn-450, Eu@Zn-450, and Tb@Zn-450 exhibit high similarity, with no distinct absorption peaks attributable to Eu3+ or Tb3+ observed in Ln@Zn-450. Consequently, it is reasonable to infer that the absence of observable Ln3+ ion absorption can be primarily attributed to the extremely low concentrations of Eu3+ and Tb3+ ions within the composite material.
Figure 2
Figure 2.
(a) Elemental mapping for C, O, Zn, S, Eu and N elements of Eu@Zn-450. (b) XPS survey of Zn-450, Tb@Zn-450 and Eu@Zn-450. (c) High-resolution Zn 2p spectra of Zn-450. (d) Tb 3d spectra of Tb@Zn-450.
In addition, the XPS spectra of Zn-450, Tb@Zn-450 and Eu@Zn-450 not only confirmed the presence of C, O, N, S and Zn, but also verified the introduction of Tb and Eu in Tb@Zn-450 and Eu@Zn-450, respectively (Fig. 2b). As shown in Fig. 2c, there are two binding energy peaks in Zn 2p at 1021.8 and 1045.1 eV, corresponding to spin orbital splitting of Zn 2p3/2, and the difference in binding energy between them is about 23.3 eV, which is consistent with the previous literature [33]. Meanwhile, from the high-resolution Tb 3d spectra in Fig. 2d, two different peaks of Tb 3d3 (1277.1 eV) and Tb 3d5 (1242.1 eV) can be obtained by fitting, respectively [34–36].
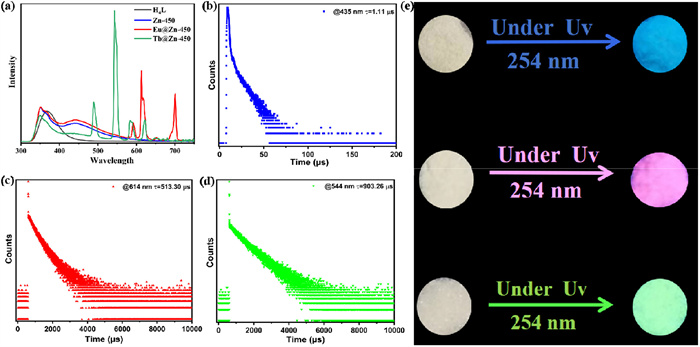
The luminescence spectra of H4L, Zn-450, Eu@Zn-450 and Tb@Zn-450 were measured at room temperature under the excitation of 280 nm. As shown in Fig. 3a, the single emission peak of the ligand H4L is at 365 nm. In addition to the ligand peak, a new characteristic peak observed at 435 nm for Zn-450. Eu@Zn-450 showed the emission bands of 580, 592, 615, 652 and 700 nm when excited at 280 nm, displaying the characteristic transition of Eu3+ ion at 5D0 → 7FJ (J = 0, 1, 2, 3, 4) (Fig. 3a) [37–39]. Meanwhile, the fluorescence emission spectra of Tb@Zn-450 revealed four characteristic peaks at 489, 543, 584 and 622 nm, respectively, in which 543 nm was the dominant peak. Under a 254 nm UV lamp, Zn-450, Eu@Zn-450 and Tb@Zn-450 exhibited faint blue light, bright red visible emission, and bright green fluorescence, respectively (Fig. 3e). What is more, the fluorescence lifetime attenuation of modified materials is also greatly improved compared with that of pre-modified materials. As shown in Fig. 3b, the characteristic peak lifetime of Zn-450 is 1.11 µs, while the characteristic peak signals of the modified composites Eu@Zn-450 and Tb@Zn-450 can reach 513.30 µs and 903.26 µs (Figs. 3c and d), which also demonstrates the combination of the Eu and Tb elements with the Zn-450 compound to a certain extent.
Figure 3
Figure 3.
(a) Fluorescence emission spectra of H4L, Zn-450, Eu@Zn-450 and Tb@Zn-450 at λex = 280 nm. Fluorescence attenuation curves of (b) Zn-450. (c) Eu@Zn-450 and (d) Tb@Zn-450. (e) Luminous photograph under 254 nm UV irradiation.
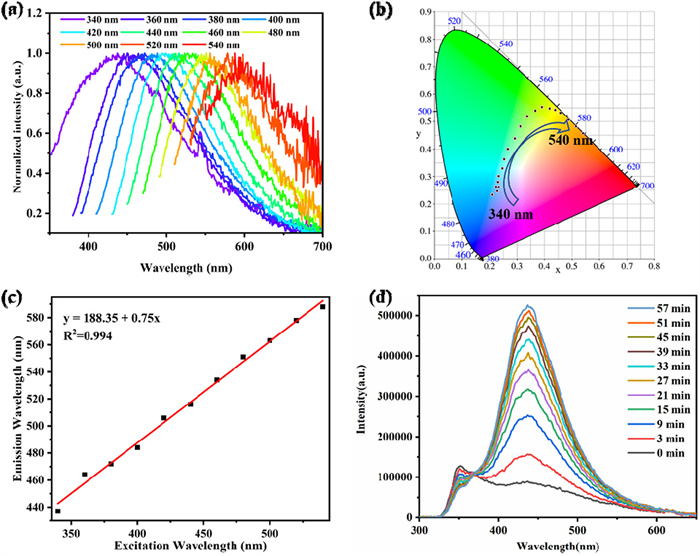
Zn-450 exhibits a notable dynamic luminescence behavior under different excitation wavelength conditions. The steady-state photoluminescence spectra of Zn-450 were recorded at the excitation wavelengths of 340–540 nm by the steady-state fluorescence spectrophotometer.
As illustrated in Fig. 4a, the emission peaks of Zn-450 exhibited a clear redshift, with the fluorescence peak shifting from blue to green and then to orange-red within the excitation wavelength range of 340–540 nm (Fig. 4b). It was noteworthy that a linear fit was performed between the excitation wavelength and the corresponding emission wavelength, with a fitting constant of R2 = 0.994, indicating that the compound exhibited a significant excitation wavelength dependence (Fig. 4c) [40,41]. Additionally, the fluorescence emission spectra of Zn-450 under a 270 nm UV lamp were tested at different times. The results showed that the emission peak at 435 nm exhibited an increased gradient (Fig. 4d), which further motivated our investigation into the location of the emission peak.
Figure 4
Figure 4.
(a) Fluorescence spectra of Zn-450 at 340–540 nm excitation wavelength. (b) Excitation wavelength-dependent fluorescence spectra and CIE coordinates of Zn-450. (c) The fitting relation of emission wavelength varying with excitation wavelength. (d) Fluorescence of Zn-450 with irradiation time.
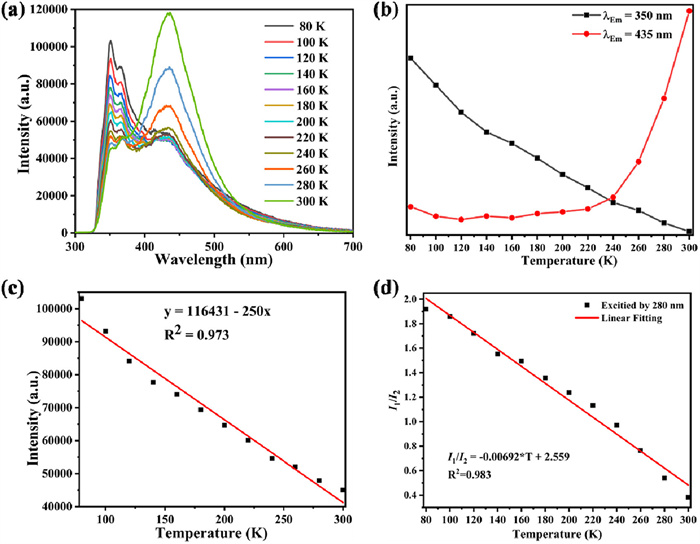
Subsequently, the fluorescence spectra of Zn-450 were tested in temperature range of 80–300 K (Fig. 5a). The experiment demonstrated that the emission peak at 435 nm exhibited minimal sensitivity to temperature when the temperature was between 80 K and 220 K. However, when the temperature exceeded 220 K, a sudden increase in fluorescence intensity was observed at 435 nm (Fig. 5b, red line). Conversely, the emission intensity at 350 nm declined continuously throughout the entire temperature range of 80–300 K (Fig. 5b, black line). In addition, Fig. 5c demonstrated that the fluorescence intensity at 350 nm exhibited a linear relationship with temperature, verifying that Zn-450 displayed a high temperature dependence.
Figure 5
Figure 5.
(a) Fluorescence spectra of Zn-450 at different temperatures. (b) Curve of emission fluorescence intensity with temperature in Zn-450 system. (c) Linear relationship of emission fluorescence intensity with temperature at 350 nm in Zn-450 system. (d) Intensity ratio and linear fitting curve of I1 (350 nm) and I2 (435 nm) in Zn-450 at temperature within the range of 80–300 K.
It is worth noting that the difference in emission intensity between 350 nm (I1) and 435 nm (I2) results in a good correlation between the I1/I2 ratio and temperature in the range of 80–300 K. The I1/I2 can be used to represent temperature, as shown in Eq. 1:
$
I_1 / I_2=-0.00692 T+2.559
$
(1)
with a correlation coefficient R2 = 0.983 (Fig. 5d). The results demonstrate the reliability and applicability of the linear fitting method to a wide range of temperatures. Furthermore, the linear fitting method does not necessitate complicated calculations and is more convenient for practical application. And that, the rate of change of fluorescence intensity ratio with temperature, namely sensitivity, is of great importance in the application of thermal sensing. In general, the absolute sensitivity (Sab) of a luminescent thermometer can be defined by Eq. 2 as the ratio of the intensity to temperature:
$
S_{\mathrm{ab}}=\Delta\left(I_1 / I_2\right) / \Delta T
$
(2)
However, it is not meaningful to quantitatively compare the absolute sensitivity between thermometers operated by different mechanisms or based on different material systems. To compare the performance of different luminescent thermometers, relative sensitivity (Sr) is usually used, as defined in Eq. 3 [42–44]:
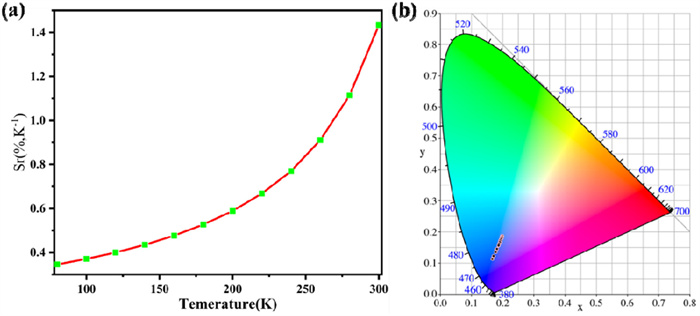
On the basis of the definitions, the maximum relative sensitivity (Sr) of Zn-450 is 1.43 % K−1 at 300 K (Fig. 6a). Subsequently, fluorescence spectra at different temperatures were represented by CIE coordinates, exhibiting a shift from light blue to dark blue as the temperature changed (Fig. 6b). It is necessary to consider whether it is possible to modify the fluorescence emission at the initial temperature in order to achieve a trans-color change with the temperature varying, making the thermometer more practical.
Figure 6
Figure 6.
(a) Temperature-dependent relative sensitivity (Sr) of Zn-450. (b) CIE chrominance diagram showing temperature variation of luminescence color of Zn-450 in the temperature range (80–300 K).
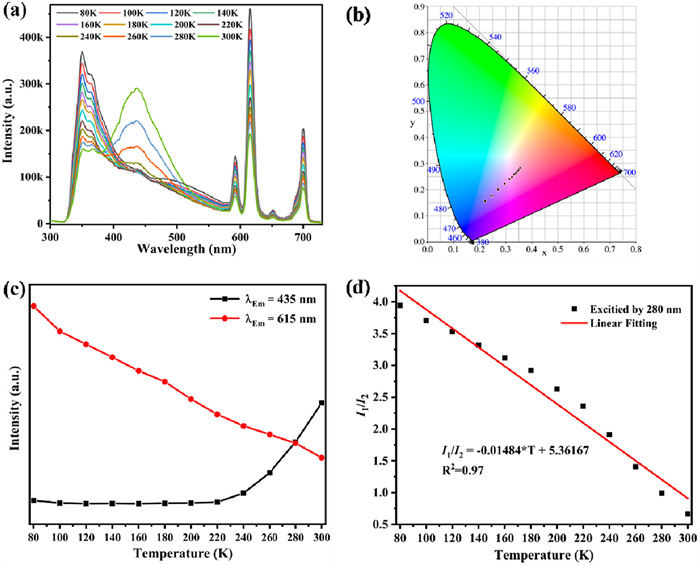
To improve the sensitivity, the modified Eu@Zn-450 was synthesized. Similarly, Eu@Zn-450 was tested by variable-temperature fluorescence spectra. As illustrated in Fig. 7a, the Eu characteristic peak exhibited an excellent temperature dependence. Of particular interest was the observation that the variable-temperature CIE coordinate of the modified crystal demonstrated an ideal color difference change (Fig. 7b). The intensity ratio (IEm = 615 nm/IEm = 435 nm) of two different emissions in Eu@Zn-450 was selected as the temperature measurement parameter of the modified proportional luminescence thermometer in the same way as the evaluation method of Zn-450. As shown in Figs. 7c and d, the intensity ratio Δ [Δ = (IEm = 615 nm)/(IEm = 435 nm)] shows a good linear relationship with temperature in the range of 80–300 K, which is expressed as Δ = −0.01484T + 5.36167 and the correlation coefficient R2 = 0.97, Where T is the given temperature. Therefore, the result demonstrates that Eu@Zn-450 is also an effective luminescent thermometer in the temperature range of 80–300 K.
Figure 7
Figure 7.
(a) Fluorescence spectra of the complex Eu@Zn-450 at different temperatures. (b) CIE chromaticity diagram showing temperature variation of Eu@Zn-450 luminous color in a temperature range of 80–300 K. (c) The curve of emission fluorescence intensity with temperature in Eu@Zn-450 system. (d) The temperature-dependent intensity ratio of Eu@Zn-450 I1 and I2 transitions.
In addition, the generalized relative sensitivity (Sr) is determined by Eq. 3. The evolution of relative sensitivity Sr with temperature is shown in Fig. S8 (Supporting information). Eu@Zn-450 exhibited a maximum Sr of 1.632 % K−1 at about 300 K, which is higher than that of Zn-450. Therefore, Eu@Zn-450 is more advantageous as a candidate application of luminescent thermometer.
To evaluate the universality of the immersion modification, we also prepared Tb@Zn-450, and further performed variable temperature fluorescence tests in addition to the basic characterization (Fig. S9 in Supporting information). The test results showed that CIE coordinates exhibited a trend of moving from green to blue with the change of temperature (Fig. S10 in Supporting information), which were in line with our expectations. Subsequently, we studied the fluorescence changes of the characteristic peak of Tb at 544 nm and the peak of the Tb@Zn-450 at 435 nm (Fig. S11 in Supporting information). Similar to Eu@Zn-450, the ratio of fluorescence changes at two emission wavelengths shows a good linear relationship in the temperature range of 220–300 K, with R2 = 0.96 (Fig. S12 in Supporting information). The relative sensitivity Sr evolving with temperature is shown in Fig. S13 (Supporting information), which shows that the maximum Sr of Tb@Zn-450 is 1.536 % K−1 at about 300 K and higher than that of Zn-450. Therefore, the experimental results demonstrate that the soaking modification can not only improve the relative sensitivity but also has a certain universality [45–47].
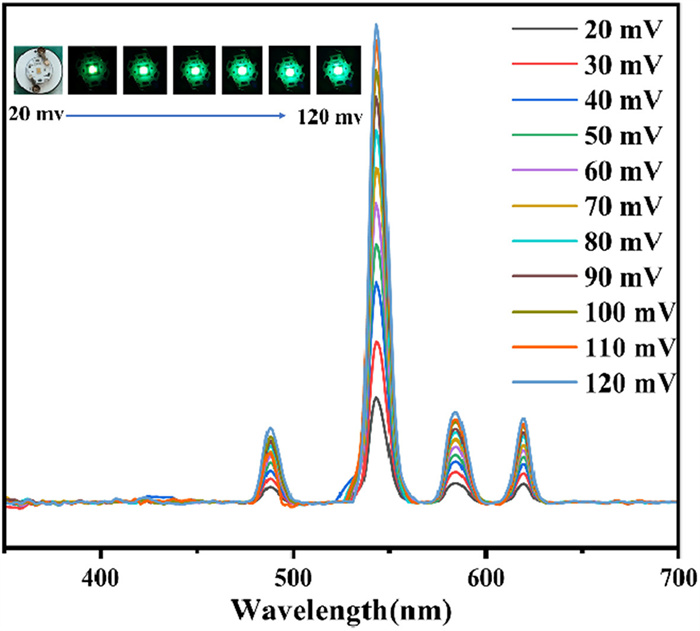
Based on the successful preparation of the above composites, different Ln3+ ions were combined into Eu/Tb@Zn-450 and their luminescence study was carried out. In this work, a series of Eu/Tb-doped MOFs with different emission spectra were obtained by adjusting the molar ratios of Eu3+ and Tb3+ in the reaction, and the changed luminous colors were observed. Interestingly, when excited at 280 nm, the MOF with a mixture of Eu and Tb modulation exhibits a double emission peak of Tb3+ and Eu3+ ions. As the Eu3+ content increases, the strongest characteristic emission peak of Eu3+ at 614 nm gradually increases, while the strongest emission peak of Tb3+ at 544 nm gradually decreases until it almost disappears (Fig. S14a in Supporting information). The CIE coordinates show smooth luminous color variations between yellow-green, yellow, orange, orange-red, and pink (Fig. S14b in Supporting information). Based on the above fluorescence characterization, the composite material is extended to the field of colored LED devices. The high brightness composite Tb@Zn-450 is taken as an example. As shown in Fig. 8, with the increase of driving voltage from 20 mV to 120 mV, the position of the fluorescence emission peak remained unchange and the intensity showed a steady growth trend. It can be seen from the illustration in the figure that the lit LED lamp showed a bright green color, and the brightness became brighter with the increase of the voltage. In short, the preparation of LED devices makes the composite material Tb@Zn-450 expected to be widely used in color solid state lighting, display and other fields [48–51].
Figure 8
Figure 8.
The luminous spectrum of a UV LED chip is presented by mixing the composite material Tb@Zn-450 under different driving currents. The illustration is a luminous photo of a green LED device for solid-state lighting prepared by the composite material Tb@Zn-450.
In summary, the MOF Zn-450 was synthesized with diphenylte-tracarboxylic acid as the organic ligand, and the composite material Ln@Zn-450 were obtained by the facile doping methods. Their structures were clearly characterized with thermal stability and phase purity by TGA and PXRD. The applications of Zn-450 and Ln@Zn-450 as ratio-type luminescence thermometers operating in the range of physiological temperature are evaluated and discussed in terms of fluorescence CIE coordinates and relative sensitivity. Compared with traditional luminescent organic molecules and coordination compounds, the synergistic interaction between the luminescent centers of MOFs was used to guide the luminescence. This property and high porosity effectively prevented the luminescence quenching caused by aggregation. The Zn-450 exhibited a change in fluorescence emission at the initial temperature after modification with rare earth ions. The change in emission was observed to occur under ultraviolet irradiation, resulting in a cross-color change with temperature varying. This optical behavior provides theoretical support for the development of a ratio luminescent thermometer. What is more, the development of rare-earth doped MOF materials, such as Ln@Zn-450, opens up exciting opportunities for advanced luminescent thermometers and other fields. The work will be followed by studies to broaden the types of rare earth ions and optimize the doping concentration to improve the luminescence properties and sensitivity of their composites, as well as to study the energy transfer mechanism and improve the scalability of the synthesis. In addition to temperature sensing, these materials also have potential in environmental monitoring, anti-counterfeiting, and biomedical imaging, and solving these challenges could unlock innovative applications and advance the field of functional luminescent materials.
Declaration of competing interest
The authors declare that they have no known competing financial interests or personal relationships that could have appeared to influence the work reported in this paper
This work was supported by the National Natural Science Foundation of China (No. 21801111), the Training Plan for Young Core Teachers in Higher Education of Henan Province (No. 2021GGJS131), Natural Science Foundation of Henan Province (No. 232300421232), and the Heluo Young Talent Lifting Project (No. 2023HLTJ02).
Supplementary materials
Supplementary material associated with this article can be found, in the online version, at doi:10.1016/j.cclet.2025.111085
.
[1]
Y. Zhang, X. Yu, Y. Hou, et al., Mol. Catal. 555 (2024) 113851.
Y. Huang, W. Feng, Z. Zhou, et al., J. Mater. Chem. C 10 (2022) 7586–7593. doi: 10.1039/d2tc00475e
Figure 1
(a) X-ray crystal structure of Zn-450: Asymmetric units. (b) The mode of coordination between zinc and ligand (Inset: The SBU coordination model of dinuclear Zn). (c) Cage assembled with 12 paddle-wheels Zn2(CO2)4 clusters and 6 ligands. (d) Cage surrounded by 6 Zn2(CO2) clusters and 6 ligands. (e) Three cross-sectional perpendicular structure. (f) Simplified 3D topological model of Zn-450.
Figure 2
(a) Elemental mapping for C, O, Zn, S, Eu and N elements of Eu@Zn-450. (b) XPS survey of Zn-450, Tb@Zn-450 and Eu@Zn-450. (c) High-resolution Zn 2p spectra of Zn-450. (d) Tb 3d spectra of Tb@Zn-450.
Figure 4
(a) Fluorescence spectra of Zn-450 at 340–540 nm excitation wavelength. (b) Excitation wavelength-dependent fluorescence spectra and CIE coordinates of Zn-450. (c) The fitting relation of emission wavelength varying with excitation wavelength. (d) Fluorescence of Zn-450 with irradiation time.
Figure 5
(a) Fluorescence spectra of Zn-450 at different temperatures. (b) Curve of emission fluorescence intensity with temperature in Zn-450 system. (c) Linear relationship of emission fluorescence intensity with temperature at 350 nm in Zn-450 system. (d) Intensity ratio and linear fitting curve of I1 (350 nm) and I2 (435 nm) in Zn-450 at temperature within the range of 80–300 K.
Figure 6
(a) Temperature-dependent relative sensitivity (Sr) of Zn-450. (b) CIE chrominance diagram showing temperature variation of luminescence color of Zn-450 in the temperature range (80–300 K).
Figure 7
(a) Fluorescence spectra of the complex Eu@Zn-450 at different temperatures. (b) CIE chromaticity diagram showing temperature variation of Eu@Zn-450 luminous color in a temperature range of 80–300 K. (c) The curve of emission fluorescence intensity with temperature in Eu@Zn-450 system. (d) The temperature-dependent intensity ratio of Eu@Zn-450 I1 and I2 transitions.
Figure 8
The luminous spectrum of a UV LED chip is presented by mixing the composite material Tb@Zn-450 under different driving currents. The illustration is a luminous photo of a green LED device for solid-state lighting prepared by the composite material Tb@Zn-450.

 DownLoad:

 下载:
下载:


 下载:
下载:
