Figure 1.
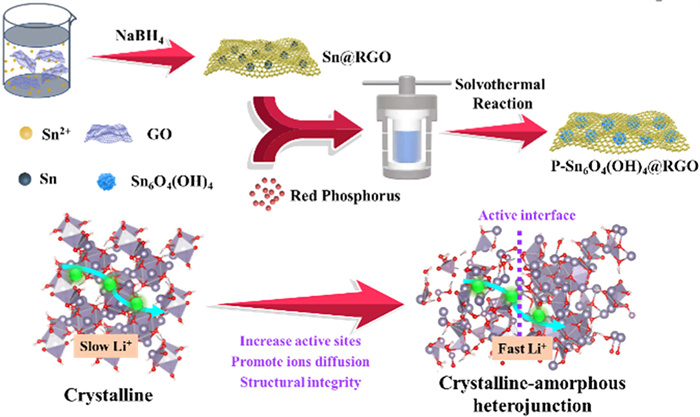
Schematic illustration of the synthesis of P-Sn6O4(OH)4@RGO composite and lithium storage mechanism.
Phosphorus modification-induced dense crystalline-amorphous heterostructured P-Sn6O4(OH)4@RGO for high-rate and ultra-stable lithium storage
Zhen Kong , Chaoyang Sun , Mingyuan Pang , Wei Liu , Haohao Zhang , Min Yang , Jiajia Ye , Juan An , Yijie Wang , Yen Leng Pak , Xing Gao , Jibin Song

The emergence of secondary batteries, especially lithium-ion batteries (LIBs), has reduced the burden on fossil fuel consumption [1–4]. Currently, the application of LIBs is widespread in all aspects of people's lives, greatly changing their way of life and making important contributions to green living. However, in order to meet the demand for higher energy density, there is an urgent need to solve the current problem of low capacity of graphite-based anode electrodes [5,6].
Among numerous candidate materials, such as Si-based [7–9], Sn-based [10,11], Fe-based [12,13], Ge-based [14], and Zn-based [15,16], Sn-based oxide electrodes have attracted much attention due to their high energy storage capacity [17,18]. However, Sn-based oxide electrode materials exhibit severe volume expansion and rapid capacity decay during the energy storage process, seriously hindering the practical application process of Sn-based electrode materials [19,20].
The structural design of electrode materials is crucial for improving electrochemical performance [21]. In order to address the aforementioned issues encountered during the energy storage process of Sn-based electrodes, researchers have proposed various solutions [22], mainly including nanostructure design [23], composite carbon-based materials [24], heteroatoms doping [25,26], hybrid phases construction [27,28]. The aim is to alleviate the volume expansion of Sn-based materials, improve the conductivity of electrode materials, accelerate the ion transfer rate during the energy storage process, and increase the reactive active sites to enhance capacity. A series of advanced electrode materials have been successfully prepared, such as SnO2 nanoflowers/SnO2 film nanocomposite [29], hollow nanostructured SnO2/C composites [30], SnO2Ni-carbon nanotube [25], and Mo-SnS2/SnO2/NG composites [31]. The electrochemical performance of Sn-based electrode materials has been greatly improved through structural modification and regulation. Sn6O4(OH)4, as a type of tin-based oxide, was explored by Wang et al. as early as 2005 for its lithium storage performance [32]. Subsequently, Duh et al. conducted a more detailed study on it [33]. The above studies all indicate that Sn6O4(OH)4 is a highly potential anode electrode for lithium storage. However, how to construct electrode materials with high-rate and long-term cycling performance still needs to be explored. According to previous research work, it has been known that the electrode materials can be modified to amorphous through phosphating treatment [34], which is beneficial for the stability of the material structure and improves the ion transfer rate [35]. How to construct suitable structures to ensure stable cycling of electrode materials is the key problem to be solved at present.
Herein, a phosphorus-modified graphene encapsulated Sn6O4(OH)4 nanoparticles composite (P-Sn6O4(OH)4@RGO) was successfully designed and prepared through a simple reduction method combined with solvothermal phosphating. The solvothermal phosphating modification treatment enables the uniform distribution of Sn6O4(OH)4 nanoparticles and encapsulated by graphene. This structure effectively enhances the structural stability of the electrode, while avoiding direct contact with the electrolyte and preventing the further growth of solid electrolyte interface (SEI). Phosphorus modification treatment enables the electrode material to have a crystalline-amorphous heterostructure, which enhances the stability of the electrode material while accelerating ion transport. Thus, the obtained P-Sn6O4(OH)4@RGO composite possesses excellent high-rate and long-term cycle performance (maintained 970 mAh/g at 1.0 A/g after 1450 cycles), which provides guidance for the preparation of advanced electrode materials.
The detailed preparation process of P-Sn6O4(OH)4@RGO composite material is shown in Fig. 1. The abundant functional groups on the surface of GO are conducive to the adsorption of Sn2+ on the surface [36], which is then reduced to metallic Sn by NaBH4. At the same time, GO is also reduced. During the reaction, the graphene layers loaded with Sn nanoparticles are stacked and wrapped around each other, forming Sn@RGO composite. By further phosphating treatment, P-Sn6O4(OH)4@RGO composite is obtained using red phosphorus as the phosphorus source and ethylenediamine as the solvent through solvothermal reaction. The prepared P-Sn6O4(OH)4@RGO composite has a three-dimensional network like graphene structure, which can effectively alleviate the volume expansion of the electrode and provide a channel for electron transport. In addition, the unique crystalline-amorphous heterostructure can enhance the reaction active sites of the electrode and improve ion transport efficiency.
The morphologies and nanostructures of the as-prepared composites were examined by Scanning electron microscopy (SEM) and transmission electron microscopy (TEM) measurements. Fig. 2a shows that graphene in Sn@RGO composite presents three-dimensional wrinkled shape, and Sn nanoparticles with different sizes are encapsulated by graphene layer. TEM image shown in Fig. 2b further verify this point, and the high-resolution TEM (HRTEM) image displayed in Fig. 2c with a lattice spacing of 0.30 nm corresponds to the (200) crystal plane of Sn. The P-Sn6O4(OH)4@RGO composite obtained by phosphating has a similar nanostructure to Sn@RGO, which is also a structure where nanoparticles are anchored on three-dimensional wrinkled graphene. Figs. 2d and e show that Sn6O4(OH)4 nanoparticles uniformly distributed in the graphene matrix with particle size ranging from 50 nm to 100 nm. Compared with Sn@RGO, it can be seen that the size of Sn nanoparticles increases when they were converted into Sn6O4(OH)4 during solvothermal phosphating. The HRTEM image displayed in Fig. 2f with a lattice spacing of 0.35 nm corresponds to the (112) crystal plane of Sn6O4(OH)4. From Fig. 2f, it can be clearly seen that the prepared P-Sn6O4(OH)4@RGO nanocomposite has a mixed structure of crystalline and amorphous states, which is originated from phosphating modification. This unique structure can effectively increase the active sites of electrode materials, increase structural stability, and accelerate ion transfer efficiency. The EDS mapping images in Figs. 2g and h show that Sn, P, C and O are homogeneously distributed in P-Sn6O4(OH)4@RGO. EDS spectra result of P-Sn6O4(OH)4@RGO depicted in Fig. 1i demonstrate the existence of elements Sn, P, O, C and N elements.
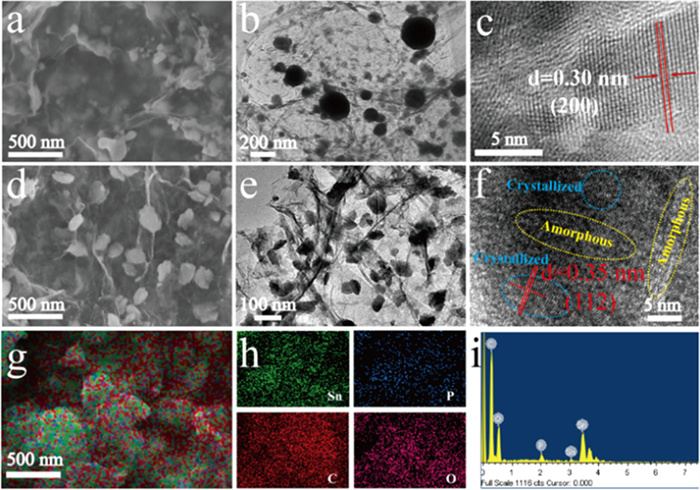
Fig. 3a presents the XRD patterns of Sn@RGO and P-Sn6O4(OH)4@RGO. The obtained samples of Sn@RGO and P-Sn6O4(OH)4@RGO corresponds to tetragonal phase Sn (PDF#89–4898) and tetragonal phase Sn6O4(OH)4 (PDF #84–2157), respectively. The results indicate that the Sn phase is transformed into Sn6O4(OH)4 during the phosphating process. Raman spectra of Sn@RGO and P-Sn6O4(OH)4@RGO were shown in Fig. 3b, and the two main peaks at 1350 and 1585 cm−1 correspond to D band and the G band of GO, respectively [37,38]. The ID/IG value for Sn@RGO (1.28) and P-Sn6O4(OH)4@RGO (1.77) is higher than that of GO (0.82), indicating that GO has been reduced to RGO. The high value of ID/IG for P-Sn6O4(OH)4@RGO proves the existence of a large number of defects, which is beneficial for lithium ion storage. Fig. 3c gives the TGA curves of Sn@RGO and P-Sn6O4(OH)4@RGO. The weight change in the temperature range of 50–800 ℃ includes the combustion of graphene and the oxidation of Sn or Sn6O4(OH)4, the final residue of the two composites is only SnO2 after heating in air to 800 ℃. The content of Sn in Sn@RGO and Sn6O4(OH)4 in P-Sn6O4(OH)4@RGO was determined to 60.1 % and 68.4 %, respectively. Figs. 3d and e show the nitrogen adsorption-desorption isotherms and pore size distribution curves of P-Sn6O4(OH)4@RGO, and it possesses a specific surface area of 165.0 m2/g along with a pore-size distribution around 3.3 nm. A high specific surface area will facilitate the infiltration of electrolyte and the transmission of lithium ions [39].
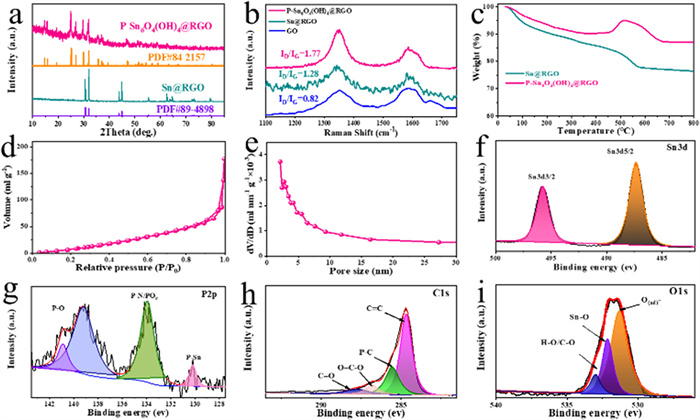
The surface chemical composition and valence state of P-Sn6O4(OH)4@RGO was verified by XPS analysis. Fig. 3f shows the high-resolution Sn 3d spectrum, and there are two peaks of Sn 3d5/2 (486.4 eV) and Sn 3d3/2 (494.7 eV) [40]. In the P 2p spectra (Fig. 3g), the two peaks located at 129.1 and 132.8 eV belong to P-Sn and P-N/POx, while the two peaks of 138.2 and 140.9 eV are assigned to P-O bond [41]. The result indicates that phosphorus was successfully introduced and bonded with tin atoms during the phosphating process. The C 1s spectrum in Fig. 3h shows four peaks at 284.7, 285.5, 286.8 and 287.5 eV, corresponding C=C, P-C, O=C-O and C=O bonds, respectively [42,43]. The results show that phosphorus is also bound to graphene matrix. Fig. 3i shows the O 1s spectrum, and the peaks at 530.4, 531.2 and 531.9 eV can be assigned to O(ad)-, Sn-O and H-O/C-O bonds [34,40,44].
The electrochemical performances of P-Sn6O4(OH)4@RGO were investigated by CV measurement. Fig. 4a shows the first five cycle CV curves for the P-Sn6O4(OH)4@RGO electrode at 0.2 mV/s. The broad peak between 1.0 V and 1.5 V existed during the initial discharge process is attributed to the conversion reaction (4Li+ + Sn6O4(OH)4 + 4e- → 4LiOH + 4SnO + 2Sn, 2Li+ + SnO + 2e- → Li2O + Sn) [33,45]. The weak peak at 0.88 V that only appeared in the first circle corresponds to the decomposition of the electrolyte to form the solid electrolyte interface (SEI) film. The broad peak below 0.76 V can be assigned to Li-Sn alloying reactions. During the first charge process, there are two peaks at 0.58 and 1.10 V were attributed to Li-Sn dealloying reactions and the reversible formation of SnO, respectively. From the second cycle, the peak current of CV curves gradually increased, indicating that the capacity of electrode material gradually increased.
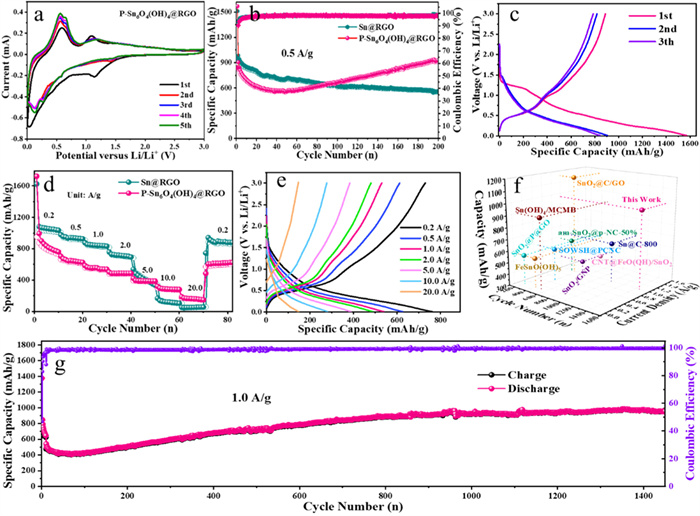
Fig. 4b gives the cycling performance of Sn@RGO and P-Sn6O4(OH)4@RGO electrodes at 0.5 A/g. At the initial stage, the capacity of Sn@RGO is obviously higher than that of P-Sn6O4(OH)4@RGO. However, as the cycle continues, the capacity of Sn@RGO gradually decreases, on the contrary, the capacity of P-Sn6O4(OH)4@RGO steadily increases, and when reaches to the 90th cycle, its capacity is equal to that of Sn@RGO. After 200 cycles, the capacity of Sn@RGO and P-Sn6O4(OH)4@RGO can be maintained at 550.9 and 928.3 mAh/g, respectively.
The first three charge/discharge curves of P-Sn6O4(OH)4@RGO tested at 0.5 A/g were displayed in Fig. 4c. The initial discharge and charge capacities reached to 1569.6 and 888.2 mAh/g, respectively. The initial discharge and charge capacities reached to 1569.6 and 888.2 mAh/g, respectively. The initial Coulombic efficiency is 56.5 %, and there are several possible reasons for the loss of capacity in the first cycle: firstly, the large surface area of the electrode material, as well as the structural rearrangement during the first lithium storage process will exacerbate the formation of the SEI layer [46,47]; Secondly, part of the active lithium ions can no longer be dislodged after being embedded in the anode electrode, and the consumption of this part of the lithium ions reduces the Coulombic efficiency [48,49]; lastly, the decomposition of the electrolyte will also lead to the reduction of the Coulombic efficiency [50]. Considering this issue, a pre-lithiation strategy can be used to improve the initial irreversible capacity of the P-Sn6O4(OH)4@RGO anode when applied to a full cell. From the second cycle, the Coulombic efficiency raised to 93.7 %, and maintained at 95.4 % at the third cycle. The voltage platform appeared in the charge-discharge curves is consistent with the CV result. Fig. 4d shows the rate performance of Sn@RGO and P-Sn6O4(OH)4@RGO electrodes at various current densities ranging from 0.2 A/g to 20.0 A/g. The P-Sn6O4(OH)4@RGO electrode delivers an average reversible capacity of 802.0, 633.1, 542.3, 480.4, 385.7, 284.2 and 159.9 mAh/g, respectively. Fig. 4e shows the corresponding charge-discharge profiles at various current densities. Based on the performance of the 10th cycle tested at 0.2 A/g, the electrode material capacity retention rates at different current densities were 83.8 % and 86.6 %, 90.6 %, 79.8 %, 72.3 % and 53.0 %, respectively. When the current density returns to 0.2 A/g, the reversible capacity can be recovered to 600.1 mAh/g, indicating that the P-Sn6O4(OH)4@RGO electrode has excellent capacity retention performance. As for Sn@RGO electrode, its reversible capacity is significantly higher than that of P-Sn6O4(OH)4@RGO at low current density (0.2–2.0 A/g), but its capacity rapidly decays when the current density reaches to 5.0 A/g, and almost no capacity contribution when the current density reached to 20.0 A/g. Fig. S1 (Supporting information) shows the charge-discharge profiles at various current densities for Sn@RGO composite. The above results indicate that the structural stability of Sn@RGO electrode material is poor, and the cycling stability is unsatisfactory, which is consistent with the cycling performance results in Fig. 4b.
The high-rate long-term cycling performance is a key index for testing the practical application of electrode materials. Fig. 4g shows the long-term cycling performance of P-Sn6O4(OH)4@RGO at 1.0 A/g. After 1450 cycles, the P-Sn6O4(OH)4@RGO electrode can be maintained a capacity of 970.0 mAh/g (Fig. S2 in Supporting information). This indicates that the P-Sn6O4(OH)4@RGO electrode material prepared through phosphating heat treatment has a stable electrode structure, resulting in excellent high-rate and long-term cycling performance. Fig. 4f and Table S1 (Supporting information) give the comparation of the rate properties and cycling performance of Sn-based oxide electrodes [51–59]. Through comparison, it can be seen that the electrode material we prepared has excellent rate performance and long cycle performance.
Fig. 5a shows the CV analysis of P-Sn6O4(OH)4@RGO electrode tested at different sweep rates to explore the reaction kinetics during energy storage. According to the power-law equation of i = avb, the b values can be determined and the b value can reveal the kinetic behavior [14,60]. Typically, b = 0.5 means a diffusion-controlled behavior, while b = 1.0 represents a capacitive behavior. Fig. 5b shows that b values of the cathodic and anodic peaks are evaluated to be 0.71 and 0.77, respectively. Therefore, it indicates that the P-Sn6O4(OH)4@RGO electrode exhibits diffusion and capacitance hybrid mechanisms, where the pseudo-capacitive effect dominates. The capacitive contribution ratio at various sweep rates can be calculated based on the equation of i = k1v + k2v1/2 [61,62]. Fig. 5c shows the pseudo-capacitive contribution area at a sweep rate of 0.8 mV/s, and the capacitive contribution is estimated to be 61 %. Fig. S3 (Supporting information) shows the CV curves tested at various sweep rates and corresponding b-values for Sn@RGO electrode, as well as the pseudo-capacitive contribution area at 0.8 mV/s. The contribution ratios for P-Sn6O4(OH)4@RGO and Sn@RGO electrodes at different scan rates are presented in Fig. 5d. For P-Sn6O4(OH)4@RGO, the pseudo-capacitive contributions at scan rates of 0.2, 0.4, 0.6, 0.8 and 1.0 mV/s are calculated to be 47 %, 50 %, 56 %, 61 % and 66 %, respectively, which is higher than that of Sn@RGO. At higher scanning rates, pseudo-capacitive storage becomes more prominent, which reflects that the electrode material has a fast Li+ intercalation/extraction ability, indicating that the P-Sn6O4(OH)4@RGO electrode has excellent reversibility and rate ability.
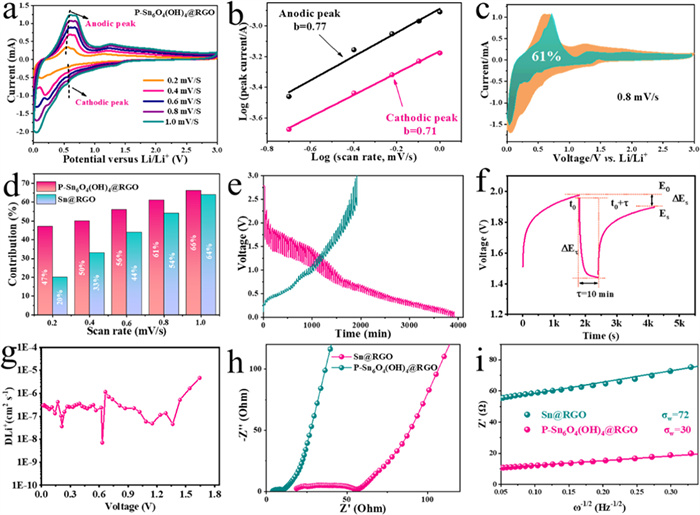
Fig. 5e depicts the GITT curves of P-Sn6O4(OH)4@RGO tested at 0.1 A/g, which was discharged/charged for 10 min and rested for 30 min. Fig. 5f shows the curve of a single titration of P-Sn6O4(OH)4@RGO. The Li+ diffusion coefficient (DLi+ ) curves obtained from equation [47]:
|
|
(1) |
The parameters ∆t, mB, and S stand for the discharging/charging time, the mass of the electrode material actually taking part in the reaction, the area of the reaction-involved electrode sheet, respectively. Moreover, MB/VM can be determined by calculating based on the density of electrode materials, and the values of ΔES and ΔEt can be acquired from Fig. 5f. From Fig. 5g, it can be seen that the ion transport efficiencies show a decreasing trend in the voltage range in which the phase transition of the electrode occurs during the energy storage process, indicating that the ion transport channels of the electrode are blocked during the phase transition process, and this view can be verified by the CV curves in Fig. 4a. To gain a deeper understanding of the transport behavior of lithium ions inside the electrodes, the EIS test methods are employed for electrode inspection. Fig. 5h displays the results of the electrochemical impedance spectroscopy (EIS) measurements used to study the transport of lithium ions within the electrodes. After cycling, the ohmic resistance and charge transfer resistance for P-Sn6O4(OH)4@RGO are smaller than that of Sn@RGO, respectively. Fig. 5i gives the corresponding Z’ plotted against ω−1/2 curves at low frequency, and DLi+ is calculated according to the equation [63–65]:
|
|
(2) |
The slope of the fitted curves for P-Sn6O4(OH)4@RGO and Sn@RGO are 30 and 72, indicating that P-Sn6O4(OH)4@RGO possess higher DLi+ than Sn@RGO. This result indicates that the P-Sn6O4(OH)4@RGO electrode has a stable structure, and it also highlights that crystalline-amorphous heterojunction induced by phosphating treatment effectively enhances the structural stability and conductivity of the electrode material.
The ex-situ SEM measurements were conducted to validate the stability of the structure of Sn@RGO and P-Sn6O4(OH)4@RGO electrodes (Fig. 6). The results demonstrate that the Sn@RGO electrode (Figs. 6a and b) shows serious crack on the surface while P-Sn6O4(OH)4@RGO electrode (Figs. 6c and d) maintains an integrated graphene encapsulation structure. This is consistent with the excellent high-rate long-term cycling stability of the P-Sn6O4(OH)4@RGO electrode in Fig. 4.
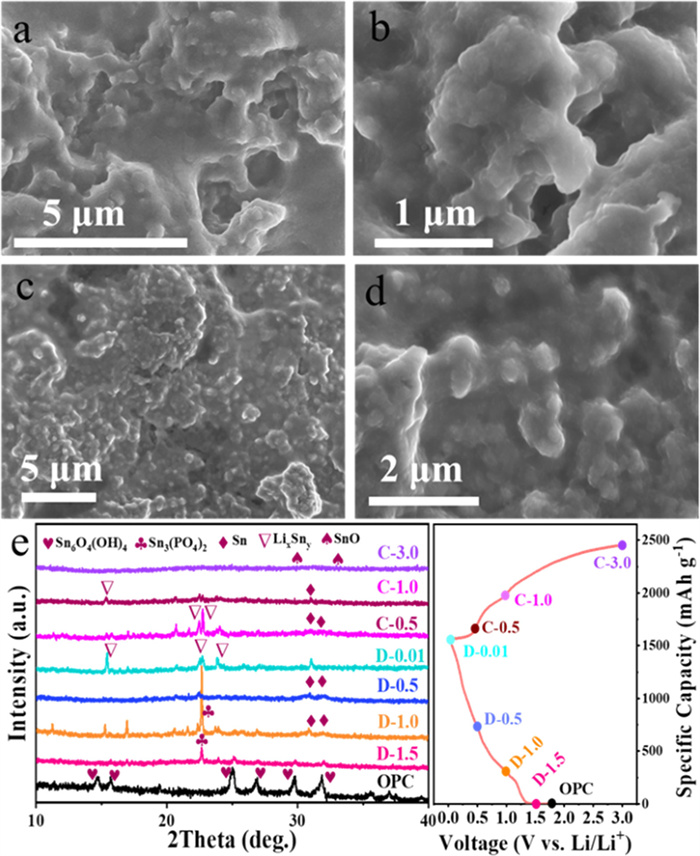
In order to gain a deeper understanding of the energy storage mechanism of electrode materials, we tested the XRD patterns of P-Sn6O4(OH)4@RGO electrode under different charging and discharging states in the first cycle. As the discharge process progresses, the Sn6O4(OH)4 characteristic peak gradually weakens, and at 1.5 V, the Sn3(PO4)2 characteristic peak appears. At 1.0 V, Sn3(PO4)2 characteristic peak becomes stronger, accompanied by the formation of Sn phase. With further discharge, the Sn3(PO4)2 characteristic peak disappears, and when discharged to 0.01 V, LixSny alloy phase is formed. During the charging process, the LixSny alloy phase disappears and the Sn phase is generated again. When charged to 3.0 V, the XRD spectrum shows amorphous features, which may be attributed to the amorphous nature of the generated tin-based oxide. The above results show that the lithiation reaction of SnO and the alloying reaction of metallic Sn are reversible during the lithium storage process, while the conversion reaction of Sn6O4(OH)4 is irreversible.
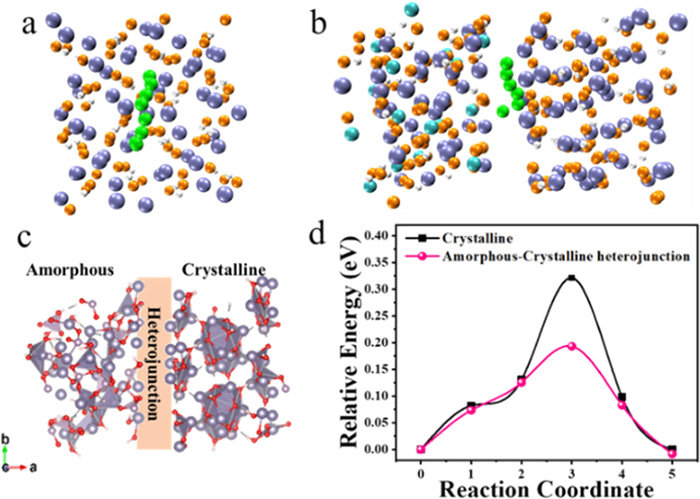
DFT calculations are also used to study the diffusion mechanism of lithium ions in electrode materials, in order to compare the diffusion energy barriers of lithium ions in Sn6O4(OH)4 electrode materials with crystal structures or amorphous crystalline heterojunctions. To simplify the simulations, the crystal structure is first constructed using defect-free Sn3(HO2)2 and the effect of the crystalline-amorphous heterojunction structure on the lithium ions transport path is investigated. The minimum energy paths in the two structures were identified, as shown in Figs. 7a and b, respectively. Fig. S4 (Supporting information) shows the side and top view of the optimized structure of crystalline. Fig. 7c displays the top view of the optimized structure of electrode with amorphous-crystalline heterojunction, and the side view is shown in Fig. S5 (Supporting information). The calculated energy barrier for Li-ion diffusion in Sn6O4(OH)4 electrode with crystalline-amorphous heterojunction structure is 0.19 eV (Fig. 7d), which is much lower than that in Sn6O4(OH)4 electrode with crystalline structure (0.32 eV). The results clearly demonstrate that P-Sn6O4(OH)4/RGO with a crystalline-amorphous heterostructure can effectively reduce the diffusion resistance of lithium ions. Therefore, the crystalline-amorphous boundary structure induced by phosphide modification can effectively enhance the diffusion efficiency of lithium ions and thus improve the energy storage performance of electrode materials.
In summary, the phosphorus modified P-Sn6O4(OH)4@RGO composite with crystalline-amorphous heterostructure was successfully designed and prepared. The synergistic effect of graphene encapsulation structure and crystalline-amorphous structure effectively improves the cycling stability and enhances the reactive active sites of electrode materials. Thus, the P-Sn6O4(OH)4@RGO exhibited promising high-rate long-term cycling performance for LIBs (970 mAh/g maintained after 1450 cycles at 1.0 A/g). This research promotes the practical application of Sn based anode materials and provides idea for the design of other high-capacity alloy anode materials. The modification of electrode material structure by phosphating treatment can effectively enhance the electrochemical performance of tin-based electrode materials, and this method can be extended to the design and fabrication of other electrode materials.
The authors declare that they have no known competing financial interests or personal relationships that could have appeared to influence the work reported in this paper.
Zhen Kong: Writing – original draft, Investigation, Conceptualization. Chaoyang Sun: Validation, Data curation. Mingyuan Pang: Visualization, Formal analysis. Wei Liu: Methodology, Investigation. Haohao Zhang: Writing – review & editing, Validation. Min Yang: Resources, Methodology. Jiajia Ye: Visualization, Investigation. Juan An: Writing – review & editing, Validation. Yijie Wang: Visualization, Investigation. Yen Leng Pak: Writing – original draft, Validation. Xing Gao: Writing – review & editing. Jibin Song: Writing – review & editing, Supervision.
This work was supported by the Natural Science Foundation of Shandong Province (Nos. ZR2024QE450, ZR2024QB302 and ZR2024QB004), the Taishan Scholars and Young Experts Program of Shandong Province (No. tsqn202211249), and Research Program of Qilu Institute of Technology (Nos. QIT 23TP019, QIT23TP010 and QIT24NN007).
Supplementary material associated with this article can be found, in the online version, at doi:
Z. Zhu, T. Jiang, M. Ali, et al., Chem. Rev. 122 (2022) 16610–16751. doi: 10.1021/acs.chemrev.2c00289
V. Aravindan, Y.S. Lee, S. Madhavi, Adv. Energy Mater. 5 (2015) 1402225.
J.Y. Liang, Y. Zhang, S. Xin, et al., Angew. Chem. Int. Ed. 62 (2023) e202300384.
Y. Man, P. Jaumaux, Y. Xu, et al., Sci. Bull. 68 (2023) 1819–1842.
J. Sun, Y. Xu, Y. Lv, et al., CCS Chem. 5 (2023) 1259–1276. doi: 10.31635/ccschem.023.202302808
M. Tu, L. Yu, R. Jia, et al., J. Colloid Interf. Sci. 635 (2023) 105–116.
Y.F. Tian, G. Li, D.X. Xu, et al., Adv. Mater. 34 (2022) 2200672.
M. Zhang, L. Zhao, D. Sun, et al., Appl. Surf. Sci. 626 (2023) 157254.
Z. Wang, Z. Xu, Y. Yuan, et al., Appl. Surf. Sci. 598 (2022) 153790.
Z. Kong, X. Liu, T. Wang, et al., Appl. Surf. Sci. 479 (2019) 198–208.
H. Zhang, Z. Kong, X. Gao, et al., Colloid. Surf. A 625 (2021) 126912.
R. Jia, R. Zhang, L. Yu, et al., J. Colloid Interf. Sci. 630 (2023) 86–98.
Z. Jiang, Y. Wang, X. Chen, et al., J. Mater. Chem. A 11 (2023) 21541–21552. doi: 10.1039/d3ta05054h
J. Liu, Y. Li, K. Zhang, et al., J. Colloid Interf. Sci. 654 (2024) 258–267.
M. Li, H. Du, L. Hong, et al., J. Alloy. Compd. 967 (2023) 171731.
G. Zhan, H. Yin, X. Wu, et al., J. Alloy. Compd. 968 (2023) 171906.
H. Yang, B. Wang, Y. Li, et al., J. Alloy. Compd. 945 (2023) 169302.
Y. Lu, X. Wang, Q. Kang, et al., Colloid. Surf. A 669 (2023) 131481.
D. Liu, Z. Kong, X. Liu, et al., ACS Appl. Mater. Interfaces 10 (2018) 2515–2525. doi: 10.1021/acsami.7b15916
Q. Tan, Z. Kong, X. Chen, et al., Appl. Surf. Sci. 485 (2019) 314–322.
Y. Zheng, X.X. Lan, X.Y. Xiong, et al., Rare Metals 42 (2023) 2840–2867. doi: 10.1007/s12598-023-02279-z
X. Wu, X. Lan, R. Hu, et al., Adv. Mater. 34 (2022) 2106895.
J.R. Rodriguez, H.J. Hamann, G.M. Mitchell, et al., ACS Appl. Nano Mater. 6 (2023) 11070–11076. doi: 10.1021/acsanm.3c00854
L. Yu, R. Jia, G. Liu, et al., J Colloid Interface Sci. 651 (2023) 514–524.
W. Ye, Z. Feng, D. Xiong, et al., ACS Appl. Nano Mater. 6 (2023) 16524–16535. doi: 10.1021/acsanm.3c02710
D. Cheng, L. Yang, R. Hu, et al., J. Mater. Sci. Technol. 121 (2022) 190–198.
M. Wang, P.F. Fang, Y. Chen, et al., Adv. Funct. Mater. 33 (2023) 2213902.
X. Lan, J. Cui, X. Zhang, et al., Adv. Mater. 34 (2022) 2106366.
F. Zhang, X. Teng, W. Shi, et al., Appl. Surf. Sci. 527 (2020) 146910.
X. Lu, Y. Chen, Q. Tian, et al., Appl. Surf. Sci. 537 (2021) 148052.
S. Yin, Y. Wang, X. Zhang, et al., Appl. Surf. Sci. 609 (2023) 155435.
K. Lin, X. Wang, Tsinghua Sci. Technol. 10 (2005) 554–560.
Y.S. Lin, J.G. Duh, D.T. Shieh, et al., J. Alloy. Compd. 490 (2010) 393–398.
Z. Kong, K. Zhang, M. Huang, et al., Electrochim. Acta 405 (2022) 139789.
J. Saddique, X. Zhang, T. Wu, et al., J. Mater. Sci. Technol. 55 (2020) 73–80.
Z. Kong, X. Yao, Y. Shao, et al., ACS Appl. Nano Mater. 4 (2021) 12335–12345. doi: 10.1021/acsanm.1c02816
Z. Kong, M. Huang, Z. Liang, et al., Inorg. Chem. Front. 9 (2022) 902–913. doi: 10.1039/d1qi01536b
R. Tian, L. Duan, Y. Xu, et al., Energy Environ. Mater. 6 (2023) e12617.
Y. He, Y. Xu, M. Zhang, et al., Sci. Bull. 67 (2022) 151–160.
S.Y. Liao, J. Chen, S.F. Cui, et al., J. Power Sources 553 (2023) 232265.
V. Tallapally, R.J.A. Esteves, L. Nahar, et al., Chem. Mater. 28 (2016) 5406–5414. doi: 10.1021/acs.chemmater.6b01749
Y. Wu, S. Hu, R. Xu, et al., Nano Lett. 19 (2019) 1351–1358. doi: 10.1021/acs.nanolett.8b04957
Z. Kong, Z. Liang, M. Huang, et al., J. Alloy. Compd. 930 (2023) 167328.
L. Ran, B. Luo, I.R. Gentle, et al., ACS Nano 14 (2020) 8826–8837. doi: 10.1021/acsnano.0c03432
Y.R. Jhan, J.G. Duh, M.H. Yang, et al., J. Power Sources 193 (2009) 810–815.
L. Zong, L. Yan, S. Zhang, et al., Electrochimi. Acta 396 (2021) 139243.
J. An, H. Zhang, L. Qi, et al., Angew. Chem. Int. Ed. 134 (2022) e202113313.
H. Liu, Y. He, H. Zhang, et al., J. Colloid Interf. Sci. 606 (2022) 167–176.
J.H. Jang, M. Lee, S. Park, et al., J. Mater. Chem. A 11 (2023) 13320–13330. doi: 10.1039/d3ta01537h
Y. Gao, P. Hai, L. Liu, et al., ACS Nano 16 (2022) 14745–14753. doi: 10.1021/acsnano.2c05561
Y. Xin, S. Pan, X. Hu, et al., J. Colloid Interf. Sci. 639 (2023) 133–144.
J. Lei, Y. Zhou, M. Wang, et al., J. Phys. Chem. Solids 154 (2021) 110093.
B. Zhang, J. Zhou, X. Sun, et al., Adv. Mater. Technol. 6 (2021) 2000849.
B. Li, S. Bao, Q. Tan, et al., J. Colloid Interf. Sci. 600 (2021) 649–659.
B. Deng, R. He, J. Zhang, et al., Inorg. Chem. 62 (2023) 15736–15746. doi: 10.1021/acs.inorgchem.3c02631
L. Zhang, K. Zhao, R. Yu, et al., Small 13 (2017) 1603973.
M. Maniyazagan, P. Naveenkumar, H. Zuhaib, et al., Solid State Sci. 136 (2023) 107091.
M. Palanisamy, C. Jamison, X. Sun, et al., Carbon N Y 185 (2021) 608–618.
H. Liu, H. Shi, Mater. Lett. 279 (2020) 128484.
H. Zhang, Z. Kong, X. Gao, et al., Langmuir 38 (2022) 8657–8666. doi: 10.1021/acs.langmuir.2c01078
S.Y. Lee, H. Seong, G. Kim, et al., Appl. Surf. Sci. 612 (2023) 155859.
Z. Kong, M. Huang, K. Zhang, et al., J. Mater. Chem. A 10 (2022) 23799–23810. doi: 10.1039/d2ta06090f
J. An, H. Zhang, L. Qi, et al., Angew. Chem. Int. Ed. 61 (2021) e202113313.
Q. Ge, Z. Ma, M. Yao, et al., J. Colloid Interf. Sci. 661 (2024) 888–896.
J. An, F. Wang, J.Y. Yang, et al., CCS Chem. 6 (2024) 110–124. doi: 10.31635/ccschem.023.202302710

Figure 1 Schematic illustration of the synthesis of P-Sn6O4(OH)4@RGO composite and lithium storage mechanism.

Figure 2 SEM images of (a) Sn@RGO and P-Sn6O4(OH)4@RGO, TEM images and HRTEM images of (b, c) Sn@RGO and (e, f) P-Sn6O4(OH)4@RGO. SEM image of (g) P-Sn6O4(OH)4@RGO. (h) EDS mapping images and (i) EDS result of P-Sn6O4(OH)4@RGO.

Figure 3 (a) XRD patterns, (b) Raman spectra and (c) TGA curves of Sn@RGO and P-Sn6O4(OH)4@RGO. (d) N2 adsorption-desorption curves and (e) corresponding pore size distribution of P-Sn6O4(OH)4@RGO. High-resolution XPS spectra of (f) Sn 3d, (g) P 2p, (h) C 1s and (i) O 1s for P-Sn6O4(OH)4@RGO.

Figure 4 Electrochemical performance. (a) CV curves for the P-Sn6O4(OH)4@RGO electrode at 0.2 mV/s. (b) Cycling performance of the prepared electrodes at 0.5 A/g. (c) The first three curve charge-discharge of P-Sn6O4(OH)4@RGO at 0.5 A/g. (d) Rate capabilities of the two electrodes at various current densities between 0.2 A/g and 20.0 A/g and (e) corresponding charge-discharge profiles at various current densities of P-Sn6O4(OH)4@RGO. (f) Comparison of long-life cycle performance with other reported Sn-based anode materials. (g) Long-term cycling performance of P-Sn6O4(OH)4@RGO at 1.0 A/g.

Figure 5 (a) CV curves of the P-Sn6O4(OH)4@RGO electrode at different scan rates from 0.2 mV/s to 1.0 mV/s. (b) Corresponding log(i) versus log(v) plots at different cathodic/anodic peaks. (c) CV curve with the pseudocapacitive fraction at 0.8 mV/s. (d) Pseudocapacitive contribution ratio at various scan rates for P-Sn6O4(OH)4@RGO. (e) GITT profile of P-Sn6O4(OH)4@RGO electrode, (f) demonstration of a single titration and (g) calculated Li-ion diffusion coefficient for P-Sn6O4(OH)4@RGO electrode from the GITT technique during discharge process. (h) EIS curves of Sn@RGO and P-Sn6O4(OH)4@RGO electrodes after cycling and (i) the corresponding Z’ plotted against ω−1/2 curves at low frequency.

Figure 6 SEM images of (a, b) Sn@RGO and (c, d) P-Sn6O4(OH)4@RGO electrodes after cycling. (e) Ex-situ XRD patterns of P-Sn6O4(OH)4@RGO electrode at various states for the first cycle.

Figure 7 Schematic diagram of the structure of lithium ions diffusion along the path of minimum energy for (a) crystalline and (b) crystalline-amorphous heterojunction, respectively. (c) Top view of the optimized structure of electrode with amorphous-crystalline heterojunction. (d) Calculated Li-ion diffusion energy barriers for electrodes with crystalline and crystalline-amorphous heterojunction. H atoms, O atoms, Sn atoms, P atoms and Li+ ions are shown in white, orange, ice blue, cyan and green, respectively.

 扫一扫看文章

扫一扫关注我们
 DownLoad:
 下载:
下载:
 下载:
下载: