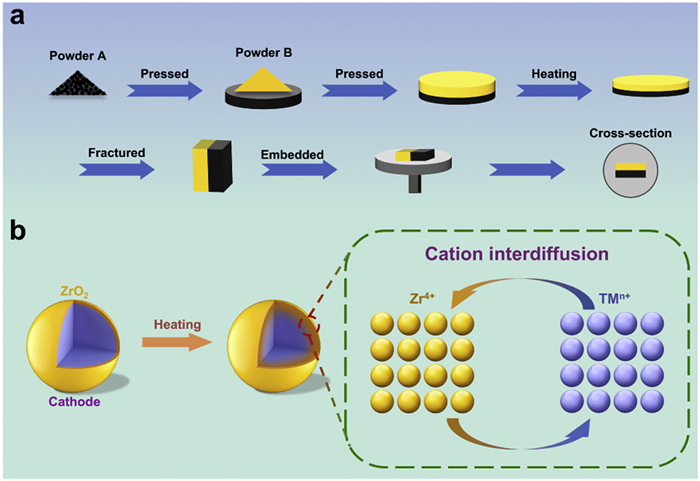
Scheme 1.
(a) The schematic diagram of the preparation process of the diffusion couple and (b) the cation interdiffusion during the sintering process.
Revealing the mechanism of Zr coating modification on Ni-rich cathode materials through solid-phase diffusion
Lingjun Li , Yanjie Huang , Zhenxuan Liu , Niu Zhao , Huazhao Liang , Minzheng Zhou , Kangyu Zou , Lei Tan , Tianxiang Ning

Ni-rich layered oxide cathode materials possess superior discharge capacity and high operating voltage, among other notable advantages, making them one of the research hotspots in the future development of lithium-ion batteries (LIBs) [1–4]. Nevertheless, this structural instability and severe harmful side reactions on the surface/interfacial of Ni-rich layered cathodes seriously damage the cycling performance of materials, restricting their further development and application. This is attributed to the micro-cracks formation in Ni-rich cathode materials, a consequence of the internal stress induced by abrupt variations in the c-axis during the charging and discharging cycles [5–10]. Meanwhile, Ni4+ has strong oxidizing properties and is prone to react violently with the electrolyte, releasing oxygen and generating HF which will destroy the cathode structure [11–14]. In essence, incorporating external substances for doping or as a coating within cathode materials serves as an efficacious approach to bolster the structural integrity and interfacial resilience of these materials [15–21]. Among them, introducing Zr into cathode materials can form strong Zr-O bonds within the unit cell, suppressing this harmful phase transformation of the cathode materials in the charging and discharging process, thereby improving the cycling performance of cathode materials [22–24]. Additionally, several researches have demonstrated that introducing of Zr can form a Li2ZrO3 coating layer on the surface of the nickel-rich cathodes, which prevents the erosion of cathode material by the electrolyte [25–29]. Therefore, if the controllable synthesis of the Li2ZrO3 coating layer on the surface of nickel-rich cathodes is achieved while Zr enters the bulk phase to stabilize the crystal structure, the structural and interfacial stability of Ni-rich cathodes is significantly enhanced through a coupling effect of doping and coating [30–32].
During the sintering process, elements will spontaneously diffuse from the contact surface to interior of the precursor. It is very important to explain the diffusion behavior of Zr in cathode materials using the principle of diffusion kinetics for studying the distribution of foreign elements in the cathode. Simultaneously, the diffusion process usually only occurs at the contact surface between two substances, so drawing upon Fick’s second law, it is practical to employ a one-dimensional infinite-length unsteady-state diffusion model for simulation and solution [33–35]. According to this method, the interdiffusion constants of Zr in cathode materials can be obtained by performing diffusion kinetic calculations at different temperatures, which provides a prerequisite for constructing a prediction model. In addition, by calculating the diffusion coefficient and diffusion depth between Zr and transition metal elements (TMs) to clarify the interdiffusion behavior of Zr in the cathode, thereby the distribution of Zr in cathode materials of different compositions during the actual sintering process can be speculated.
In this work, diffusion couple experiments at 600, 650, and 700 ℃ were designed for measuring the diffusion distance of Zr in LiNiO2, LiCoO2, LiMnO2 and Li2MnO3. And the diffusion coefficients between Zr and TMs (TM = Ni, Co, and Mn) were calculated based on Fick’s second law, thereby elucidating the distribution of Zr in cathode materials of different compositions. According to the results of the diffusion kinetics calculations, the diffusion coefficients for Zr4+/Ni3+, Zr4+/Co3+, Zr4+/Mn3+ and Zr4+/Mn4+ diffusion couples are 0.1253, 0.1732, 0.2243 and 0.3353 × 10⁻¹² cm2/s at 750 ℃, respectively. It can be inferred from the prediction model at 750 ℃: the Zr exhibits a gradient distribution in Ni based cathodes with different contents and tends to enrich at the surface of Ni-rich materials to form Li2ZrO3 coating layers.
To eliminate the influence of different specific surface areas caused by inconsistent particle sizes on element diffusion, all cathode materials (LiNiO2, LiCoO2, LiMnO2 and Li2MnO3) and ZrO2 powders were adjusted to around 1 μm through ball-milling method. As shown in Figs. S1 and S2 (Supporting information), it was proven that there were no impurity crystal phases in the prepared cathode materials and the median particle size was around 1 μm. The schematic illustration delineating the preparation methodology for diffusion couples is depicted in Scheme 1a. And the cation interdiffusion during the sintering process was illustrated in Scheme 1b. In the calcination process, thermal motion occurs between the two substances, and elements spontaneously diffuse from regions of high concentration to those of low concentration.
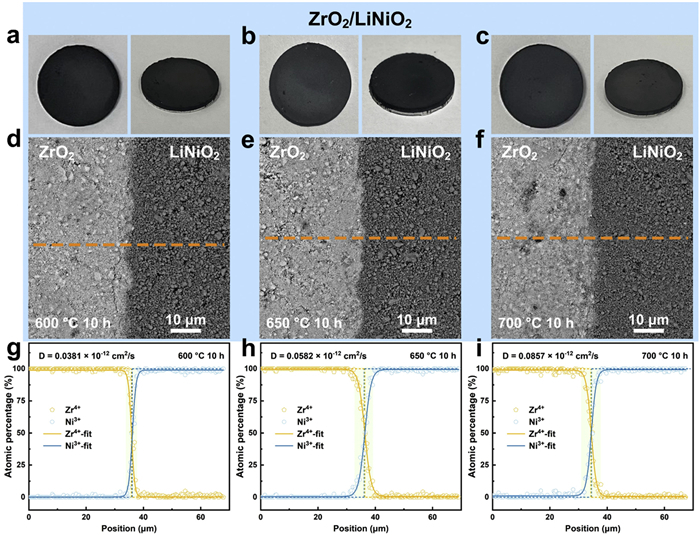
To verify the influence of different elements on Zr diffusion, this study conducted corresponding tests on four diffusion couples prepared at 600, 650, and 700 ℃. After crushing the diffusion couples, the specimens were subjected to examination under a scanning electron microscope (SEM) for a meticulous observation of the alterations in the elemental concentration distribution across the cross-section of the diffusion couples. By performing an EDS line scan perpendicular to the interface between the cathode materials and ZrO2 to measure the relationship between the concentration changes of relevant elements and the interface distance, the diffusion depth of Zr in different cathodes can be accurately obtained. From the optical photos in Fig. 1 and Figs. S3-S5 (Supporting information), it can be observed that the prepared diffusion couples are complete and tightly bonded. Moreover, the cross-sectional SEM images in these figures of the diffusion couples also indicated this. A distinct, clear, and smooth interface between the two substances can be observed, suggesting that the contact at the interface of the two substances is tight, ensuring the normal progress of the elemental diffusion process during the sintering process [36]. Fig. 1 shows the diffusion couples of ZrO2/LiNiO2 prepared by calcining at 600, 650 and 700 ℃ and the corresponding interdiffusion results. For all SEM images, the left side was the ZrO2 as a dopant, the right side was the LiNiO2 cathode material, and the orange dashed line indicates the acquisition of raw data by EDS line scan. By fitting the change in element concentration with distance using Fick’s second law, the element concentration change curves at different temperatures were obtained. It was found that the diffusion coefficients of Zr4+/Ni3+ at 600, 650 and 700 ℃ were 0.0381, 0.0582 and 0.0857 × 10⁻¹² cm2/s, respectively. The interdiffusion results of ZrO2/LiCoO2, ZrO2/LiMnO2 and ZrO2/Li2MnO3 diffusion couples are shown in Figs. S3-S5 (Supporting information), respectively. Based on the same method, the diffusion coefficients of Zr4+/Co3+ at different temperatures were calculated to be 0.0527 (600 ℃), 0.0780 (650 ℃) and 0.1030 × 10⁻¹² cm2/s (700 ℃). Similarly, the diffusion coefficients of Zr4+/Mn3+ and Zr4+/Mn4+ at 600, 650 and 700 ℃ were calculated to be about 0.0901, 0.1305, 0.1808 × 10⁻¹² cm2/s and 0.1366, 0.1782, 0.2379 × 10⁻¹² cm2/s, respectively. These results demonstrated that there were differences in the diffusion effects of TMn+ on Zr4+. It was worth noting that the promoting effects of Mn4+ and Mn3+ on the diffusion of Zr4+ were significantly greater than those of Co3+ and Ni3+. The specific variation pattern of the diffusion coefficients was: Zr4+/Mn4+ > Zr4+/Mn3+ > Zr4+/Co3+ > Zr4+/Ni3+. The diffusion coefficients discussed above were all presented in Table S1 (Supporting information).
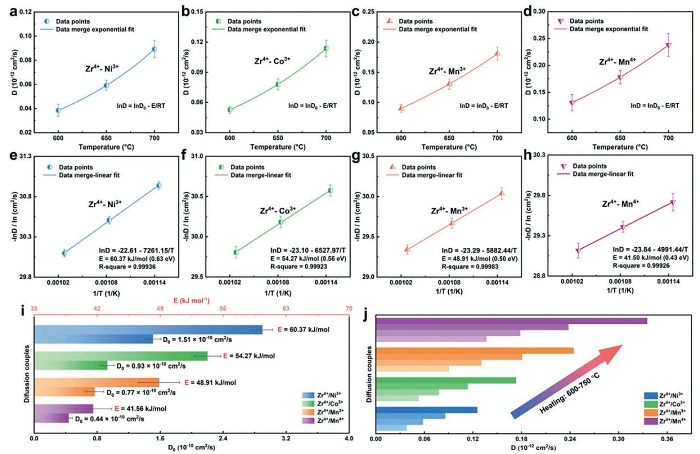
The diffusion coefficients of diffusion couples were substituted into the Arrhenius equation to calculate the key thermodynamic parameters. It could be observed that as the calcination temperature increased, the interdiffusion distances of Zr4+/Ni3+, Zr4+/Co3+, Zr4+/Mn3+ and Zr4+/Mn4+ extended, indicating that the degree of interdiffusion between Zr and transition metal elements (TMs) was proportional to the temperature (Fig. S6 in Supporting information). Fig. 2 shows the interdiffusion constants of all diffusion couples in various double-stacked pellets as a function of temperature and the conventional fitting results based on Arrhenius law. It should be highlighted that a diffusion of Zr4+ within the cathode is inversely proportional to its diffusion activation energy [37]. The diffusion coefficient represents the diffusion ability of Zr4+, while the diffusion activation energy indicates the difficulty of Zr4+ diffusion [38]. Figs. 2i and j provide a visual comparison of E and D0 for the above four diffusion couples. The diffusion activation energies E of the Zr4+/Ni3+, Zr4+/Co3+, Zr4+/Mn3+ and Zr4+/Mn4+ diffusion couples were 60.37(± 1.11), 54.27(± 1.48), 48.91(± 2.27) and 41.50(± 2.06) kJ/mol, respectively, and the interdiffusion constants D0 were 1.51(± 0.07), 0.93(± 0.08), 0.77(± 0.15) and 0.44(± 0.11) × 10-10 cm2/s. These parameters, both of which reflect the magnitude of the elemental diffusion rate, were listed in Table S2 (Supporting information). Notably, due to the highest diffusion activation energy and interdiffusion constant, an upgrade of Ni3+ content in cathode material will hinder diffusion of Zr4+ into crystal interior, resulting in the enrichment of Zr4+ on the surface of the cathode materials and the formation of coating layer.
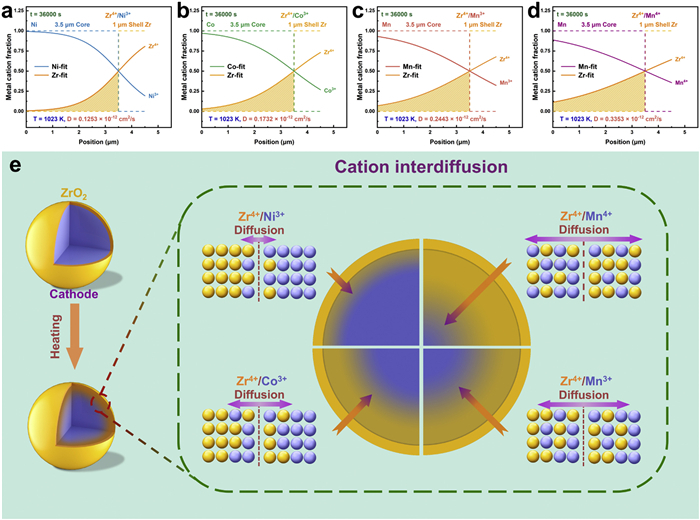
The sintering temperature for Ni based layered cathode materials is typically around 750 ℃. However, the diffusion couples prepared in the previous section were difficult to calcine at this temperature while maintaining an intact interfacial morphology. Therefore, it is impractical to directly determine the diffusion coefficient from the graphical representations of transition metal ion transitions and Zr4+ ion concentrations as a function of position. It can be considered that foreign elements coat the surface of the cathode material particles, forming a sphere similar to a core-shell structure [39]. Thus, in this work, a core-shell model with an internal particle radius of 3.5 μm and an external shell thickness of 1 μm was designed based on the morphology of the cathode material precursor obtained by the coprecipitation method, which reliably simulated the diffusion behavior of Zr4+ with Ni3+, Co3+, Mn3+, and Mn4+ at 750 ℃. That is, the relevant Arrhenius equation was established through the constructed prediction model, thereby obtaining the diffusion coefficients of the four diffusion couples calcined at 750 ℃ and the curves of Zr4+ concentration as a function of position into four cathode materials (Figs. 3a-d). According to the Arrhenius equation, the calculated diffusion coefficients of the four diffusion couples (Zr4+/Ni3+, Zr4+/Co3+, Zr4+/Mn3+, and Zr4+/Mn4+) after calcination at 750 ℃ for 10 h were 0.1253, 0.1732, 0.2443 and 0.3353 × 10⁻¹² cm2/s, respectively. For analyzing this calculated result more intuitively, Fig. 3e shows the interdiffusion behavior and diffusion depth of Zr4+ with Ni3+, Co3+, Mn3+, and Mn4+ in the core-shell model, in which the yellow area represents the total amount and rate of Zr4+ diffusion. It could be clearly observed from the figure that in the Ni3+ based cathode material, it was probable that Zr4+ would predominantly adhere to the particle surfaces, thereby creating a protective coating layer. But, in the Mnn+ (n = 3, 4) based cathode materials, Zr4+ can more easily penetrate deeper into the interior of the particles. It is worth noting that although Zr4+/Mn4+ diffusion couple has the largest diffusion coefficient and diffusion distance, the Zr4+ still shows a gradient distribution throughout the Li2MnO3 cathode particles. The above results scientifically explain from the perspective of diffusion kinetics the gradient distribution of Zr in Zr-modified Ni-Mn system layered cathode materials, that is, the coexistence of Zr doping inside the crystal particles and the second phase Li2ZrO3 coating layer on their particles surface.
To prove the inferences obtained from the above predictive model calculations, this work adopted the same experimental conditions as the predictive model. Specifically, Zr-modified Ni-Mn system cathode materials with 1% and 2% modification amounts were prepared by calcining at 750 ℃ for 10 h through the solid-state reaction method. In particular, the basic composition of the cathode material was designed to be 80% Ni and 10% Mn, and the remaining 10% was composed of three elements, Ni, Co, and Mn, namely three cathode material samples of LiNi0.9Mn0.1O2 (NM91), LiNi0.8Co0.1Mn0.1O2 (NCM811), and LiNi0.8Mn0.2O2 (NM82). As described in the experimental section, spherical cathode material precursors have been meticulously synthesized using the co-precipitation technique. The particle size of these precursors has been precisely controlled to an average of 7 μm by skillfully adjusting parameters such as the pH value and the concentration of ammonia (Fig. S7 in Supporting information). The SEM images of all cathode samples prepared are presented in Figs. S8-S10 (Supporting information). The crystal particles of the cathode materials of the three systems are all spherical, and the particle size is around 7 μm, which is in line with the designed core-shell model.
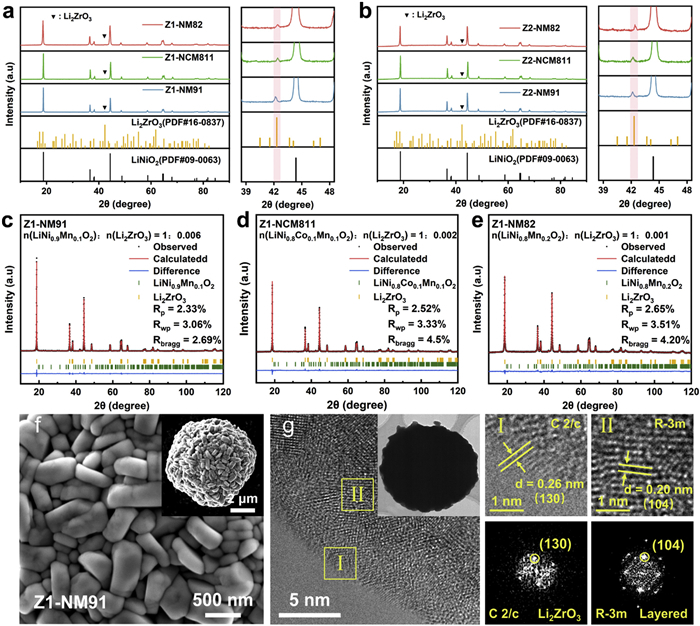
From the XRD patterns in Figs. 4a and b, it can be found that all synthesized cathode materials exhibit the same α-NaFeO2 phase as the R-3m space group, indicating the successful preparation of Ni-based layered cathode materials. At the same time, the XRD curves of all Zr-modified samples show characteristic diffraction peaks of Li2ZrO3 near 42°, indicating that even under the condition of a 1% Zr modification amount, there is a second crystalline phase of Li2ZrO3 in the Zr-modified cathode material samples (Fig. S11 in Supporting information). Subsequently, slow XRD scans at a rate of 1°/min were conducted on three Zr-modified cathode samples (Z1-NM91, Z1-NCM811, and Z1-NM82). Thereafter, the obtained XRD data were subjected to Rietveld refinement, and all R values were successfully refined to below 5%, indicating that the data obtained from the XRD refinement are highly reliable, and all the XRD refinement data were summarized in Tables S3-S6 (Supporting information). As shown in Figs. 4c-e, by measuring the content ratio of the main crystal phase to the second phase of Li2ZrO3 in the cathode material samples, it was found that in the Z1-NM91 sample, the ratio of n(NM91):n(Li2ZrO3) is 1:0.006, in the Z1-NCM811 sample, n(NCM811):n(Li2ZrO3) equals to 1:0.002, and in the Z1-NM82 sample, n(NM82):n(Li2ZrO3) is about 1:0.001. From the above results, it can be seen that when Ni content within cathode material reaches 90%, a content of the second phase of Li2ZrO3 in the NCM91 sample is considerably greater than that in NM82 and NCM811 samples. This signifies that Zr congregates extensively on the cathode sample’s surface, leading to the precipitation of the Li2ZrO3 secondary crystalline phase. Interestingly, when the proportion of Mn content in the cathode material reaches 20%, the content of Li2ZrO3 in the NM82 sample is the lowest among three system cathode samples. Due to the differences in diffusion rates among transition metal elements, the diffusion distance and content of Zr inside the cathode material particles show variations. The SEM picture of Z1-NM91 sample displayed a spherical secondary particle with smooth surfaces and approximately 7 μm in diameter (Fig. 4f). In addition, the TEM images of Z1-NM91 also confirmed the XRD results (Fig. 4g), where a thin coating layer was discerned on the surface of the NM91 cathode material particles. As expected, this coating layer is composed of the Li2ZrO3 phase. From the kinetic simulation calculation results in the previous part, it was found that the interdiffusion rate of Zr4+/Mn4+ is the fastest. Therefore, in the cathode material system with a high Mn content, Zr enters the internal crystal structure of the material more quickly, resulting in a corresponding decrease in the Li2ZrO3 remaining on the surface. This is consistent with the XRD refinement data and is fully verified. It is worth mentioning that the diffusion coefficients between Zr and transition metal elements (Ni, Co, Mn) are relatively small, making it difficult to achieve uniform doping of Zr into the bulk phase of the cathode material.
To delve deeper into the impact of Zr on the efficacy of cathode materials, the meticulously prepared NM91, NCM811, and NM82 cathode samples were meticulously assembled into CR-2025 type coin cells. Subsequent electrochemical performance evaluations were meticulously carried out at a controlled temperature of 30 ℃, spanning a voltage spectrum from 2.7 V to 4.3 V, and the obtained data are all presented in Fig. 5. It can be seen that for the cathode materials of the three cathode systems of NM91, NCM811 and NM82, as Zr is added, the initial discharge specific capacity of the materials exhibits a steady decline over time. In NM91 cathode materials, at a current density of 0.1 C, the initial discharge specific capacities of the NM91 and Z1-NM91 samples were remarkably 203.58 and 196.71 mAh/g respectively, and their first-cycle Coulombic efficiencies are 85.32% and 83.81% respectively (Fig. 5a). In the NCM811 cathode materials, at 0.1 C, the initial discharge specific capacities of the NCM811 and Z1-NCM811 samples are 192.59 and 185.23 mAh/g respectively, and their first-cycle Coulombic efficiencies are 86.76% and 85.80% respectively (Fig. 5c). It should be noted that in the NM82 cathode materials, at a current density of 0.1 C, the initial discharge specific capacity of the pristine NM82 sample, which is 186.22 mAh/g, and the first-cycle Coulombic efficiency of 82.89% are both higher than those of the Zr modified sample, which are 179.54 mAh/g and 80.75% respectively (Fig. 5e).
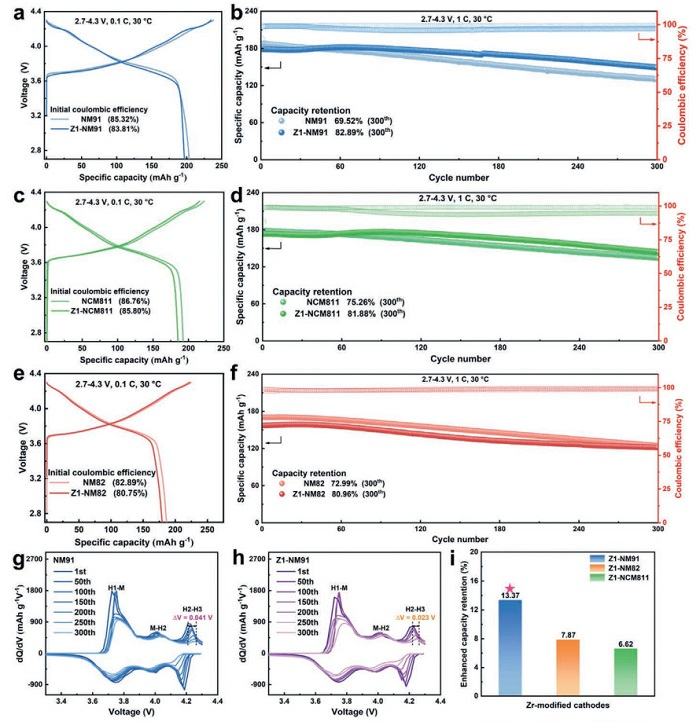
From the above results, the primary factor contributing to the decline in the discharge specific capacity of the Zr-modified cathode material samples is the inherent non-electrochemical activity of Zr, as indicated in references [40–42]. It did not participate in redox reactions during this battery charging and discharging processes, so it cannot provide effective capacity, thus causing a deduction in the discharge specific capacity. Moreover, after Zr4+ enters the interior of the cathode material, according to the law of charge conservation, the content of Ni2+ needs to be increased, which inevitably increases the degree of Li+/Ni2+ mixing in the crystal structure, thereby resulting in a decrease in the battery Coulombic efficiency. However, the introduction of Zr has a positive effect on the capacity retention ratio of the cathode materials. As can be seen from Figs. 5b, d and f, after 300 cycles, the retention rates of the Zr-doped cathode substance specimens, Z1-NM91, Z1-NCM811, and Z1-NM82, have climbed to 82.89%, 81.88%, and 77.21% respectively. Especially for the Z1-NM91 sample, the improvement in the capacity retention ratio is the most obvious. Compared with the original sample NM91, its capacity retention ratio has increased by 13.37% (Fig. 5i). Interestingly, during the long cycling process, the Zr modified samples all exhibited an increase in the discharge specific capacity. This might be because the Li2ZrO3 coating layer hindered the Li+ transportation between the cathode particles and the electrolyte, slowing down a material activation process and reaching equilibrium only during subsequent cycling [43,44]. Figs. 5g and h display the dQ/dV curves of two cathode material samples in the NM91 system corresponding to different cycle numbers. The dQ/dV plots of other cathode material samples (NCM811, Z1-NCM811, NM82 and Z1-NM82) are shown in Fig. S12 (Supporting information). All the cathode samples underwent a phase shift of H1 → M → H2 → H3. During the phase change, c-axis in unit cell structure contracted severely, generating phase transition stress and accumulating mechanical stress in the structure. This led to the emergence of micro-cracks in crystal particles, thereby reducing the cycling stability of material [45,46]. Notably, after 300 cycles, the H2 → H3 phase transition peak shifts of the NM91 and Z1-NM91 cathode samples were 0.043 V and 0.023 V, respectively. This indicates that when Zr4+ enters the internal structure of the cathode material, it can mitigate the polarization degree of the redox reaction, thus improving the reversibility of the crystal structure [47,48].
In conclusion, this study conducted in-depth research on the diffusion kinetic behavior between Zr and the main transition metal ions (Ni3+, Co3+, Mn3+, and Mn4+) in Ni-rich based cathode materials through these designed diffusion couples. Based on kinetic analysis, this study found that the interdiffusion rates of Zr4+ and transition metal ions showed a certain order as follows: Zr4+/Mn4+ > Zr4+/Mn3+ > Zr4+/Co3+ > Zr4+/Ni3+. Although Mn4+ had the strongest promoting effect on the diffusion of Zr4+, when the Zr modification amount was only 1%, a surface coating layer still formed in the NM82 sample of high-Mn content cathode materials. By conducting electrochemical performance analyses on all the prepared pristine and modified cathode samples of NM82, NM91, and NCM811, it has been discovered that the coating layer serves as a robust shield against electrolyte corrosion, significantly enhancing the surface stability of the cathode material, thereby elevating the cycling stability. This study elucidated the mechanism of action of Zr-doped Ni-based layered cathode materials from the perspective of diffusion kinetics and successfully predicted the distribution behavior of Zr in Ni-based layered cathode materials through diffusion kinetics calculations. This discovery has opened up new design ideas for the development of the next generation of high-performance and cost-effective cathode materials.
The authors declare that they have no known competing financial interests or personal relationships that could have appeared to influence the work reported in this paper.
Lingjun Li: Writing – review & editing, Writing – original draft, Visualization, Resources, Project administration, Methodology, Funding acquisition, Formal analysis, Data curation, Conceptualization. Yanjie Huang: Writing – original draft, Software, Methodology, Conceptualization. Zhenxuan Liu: Methodology, Formal analysis, Data curation. Niu Zhao: Methodology, Data curation. Huazhao Liang: Validation, Software. Minzheng Zhou: Methodology. Kangyu Zou: Writing – review & editing, Validation, Funding acquisition. Lei Tan: Formal analysis, Data curation. Tianxiang Ning: Writing – review & editing, Writing – original draft, Validation, Supervision, Formal analysis, Data curation.
This work was supported by the National Natural Science Foundation of China (Nos. 52374299 and 52304320), the Outstanding Youth Foundation of Hunan Province (No. 2023JJ10044), the Science and Technology Innovation Program of Hunan Province (No. 2024QK2004), the Natural Science Foundation of Hunan Province (No. 2023JJ40014), and the Scientific Research Fund of Hunan Provincial Department of Education (No. 24B0295).
Supplementary material associated with this article can be found, in the online version, at doi:
Y. Sun, C. Wang, W. Huang, et al., Angew. Chem. 135 (2023) e202300962. doi: 10.1002/ange.202300962
L. Ni, H. Chen, J. Gao, et al., ACS Nano 17 (2023) 12759–12773. doi: 10.1021/acsnano.3c03770
Z. Dai, Y. Liu, X. Lu, et al., Adv. Mater. 36 (2024) 2313500. doi: 10.1002/adma.202313500
H. Xie, H. Peng, D. Jiang, et al., Chem. Eng. J. 470 (2023) 144051. doi: 10.1016/j.cej.2023.144051
Z. Cui, A. Manthiram, Angew. Chem. Int. Ed. 62 (2023) e202307243. doi: 10.1002/anie.202307243
Z.Z. Yu, G.Q. Zhao, F.L. Ji, et al., Rare Met. 42 (2023) 4103–4114. doi: 10.1007/s12598-023-02356-3
K. Zou, S. Xie, M. Jiang, et al., Chem. Eng. J. 483 (2024) 149189. doi: 10.1016/j.cej.2024.149189
H. Tang, D. Liu, J. Huang, et al., Chin. Chem. Lett. 36 (2025) 109987. doi: 10.1016/j.cclet.2024.109987
Y. Zhou, H. Zhang, Y. Wang, et al., ACS Nano 17 (2023) 20621–20633. doi: 10.1021/acsnano.3c07655
L. Li, L. Fu, M. Li, et al., J. Energy Chem. 71 (2022) 588–594. doi: 10.1016/j.jechem.2022.04.037
Y. Lv, S. Huang, Y. Zhao, et al., Appl. Energy 305 (2022) 117849. doi: 10.1016/j.apenergy.2021.117849
B. Jin, Z. Cui, A. Manthiram, Angew. Chem. 135 (2023) e202301241. doi: 10.1002/ange.202301241
N.Y. Park, G.T. Park, S.B. Kim, et al., ACS Energy Lett. 7 (2022) 2362–2369. doi: 10.1021/acsenergylett.2c01272
L. Tan, X. Huang, T. Yin, et al., Energy Storage Mater. 71 (2024) 103692. doi: 10.1016/j.ensm.2024.103692
G.T. Park, B. Namkoong, S.B. Kim, et al., Nat. Energy 7 (2022) 946–954. doi: 10.1038/s41560-022-01106-6
J. Li, W. Zhong, Q. Deng, et al., Adv. Funct. Mater. 33 (2023) 2300127. doi: 10.1002/adfm.202300127
Q. Shi, R. Qi, X. Feng, et al., Nat. Commun. 13 (2022) 3205. doi: 10.1038/s41467-022-30942-z
C. Geng, D. Rathore, D. Heino, et al., Adv. Energy Mater. 12 (2022) 2103067. doi: 10.1002/aenm.202103067
M. Jiang, P. Wang, Q. Chen, et al., Chin. Chem. Lett. 36 (2025) 110040. doi: 10.1016/j.cclet.2024.110040
Y.H. Du, H. Sheng, X.H. Meng, et al., Nano Energy 94 (2022) 106901. doi: 10.1016/j.nanoen.2021.106901
W. Li, S. Zhang, W. Zheng, et al., Adv. Funct. Mater. 33 (2023) 2300791. doi: 10.1002/adfm.202300791
K. Yang, Y. Yi, G. Hu, et al., Chem. Eng. J. 1 (2024) 152872.
H. Yang, H.H. Wu, M. Ge, et al., Adv. Funct. Mater. 29 (2019) 1808825. doi: 10.1002/adfm.201808825
H. Shi, J. Zheng, T. Wan, et al., J. Energy Chem. 101 (2025) 392–401. doi: 10.1016/j.jechem.2024.09.056
K. Park, D.J. Ham, S.Y. Park, et al., RSC Adv. 10 (2020) 26756–26764. doi: 10.1039/d0ra01543a
Z. Zhang, B. Hong, M. Yi, et al., Chem. Eng. J. 445 (2022) 136825. doi: 10.1016/j.cej.2022.136825
Y. Shen, D. Yin, H. Xue, et al., J. Colloid Interface Sci. 663 (2024) 961–970. doi: 10.1016/j.jcis.2024.02.213
C. Liu, Q. Luo, L. Li, et al., Chem. Eng. J. 500 (2024) 156866. doi: 10.1016/j.cej.2024.156866
X. Tan, W. Peng, M. Wang, et al., Al., Prog. Nat. Sci. Mater. 33 (2023) 108–115. doi: 10.1016/j.pnsc.2022.12.004
Z. Wen, Y. Song, H. Shi, et al., J. Energy Storage 98 (2024) 113037. doi: 10.1016/j.est.2024.113037
J.Q. Peng, Y.Y. Wei, D.M. Liu, et al., Rare Met. 43 (2024) 658–670. doi: 10.1007/s12598-023-02470-2
K. Zou, M. Jiang, T. Ning, et al., Chem. Eng. J. 97 (2024) 321–331.
J. Li, R. Doig, J. Camardese, et al., Chem. Mater. 27 (2015) 7765–7773. doi: 10.1021/acs.chemmater.5b03499
H. Zhao, W.Y.A. Lam, L. Sheng, et al., Adv. Energy Mater. 12 (2022) 2103894. doi: 10.1002/aenm.202103894
Y. Zhao, J. Li, J.R. Dahn, Chem. Mater. 29 (2017) 5239–5248. doi: 10.1021/acs.chemmater.7b01219
C. Li, Z. Song, C. Chen, et al., Nat. Energy 5 (2020) 768–776. doi: 10.1038/s41560-020-00692-7
M. Ghasemi, B. Guo, K. Darabi, et al., Nat. Mater. 22 (2023) 329–337. doi: 10.1038/s41563-023-01488-2
Q. Fan, J. Yao, S. Zhao, et al., Small 21 (2025) 2409215. doi: 10.1002/smll.202409215
L. Li, Q. Chen, M. Jiang, et al., Energy Storage Mater. 75 (2025) 104016. doi: 10.1016/j.ensm.2025.104016
Y.J. Guo, P.F. Wang, Y.B. Niu, et al., Nat. Commun. 12 (2021) 5267. doi: 10.1038/s41467-021-25610-7
G. Ko, S. Jeong, S. Park, et al., Energy Storage Mater. 60 (2023) 102840. doi: 10.1016/j.ensm.2023.102840
R. Wang, Y. Sun, K. Yang, et al., J. Energy Chem. 50 (2020) 271–279. doi: 10.1016/j.jechem.2020.03.042
J. Guo, Y. Li, J. Meng, et al., J. Energy Chem. 74 (2022) 34–44. doi: 10.3390/bioengineering10010034
J. Ahn, Y. Ha, R. Satish, et al., Adv. Energy Mater. 12 (2022) 2200426. doi: 10.1002/aenm.202200426
H. Zhu, Z. Wang, L. Chen, et al., Adv. Mater. 35 (2023) 2209357. doi: 10.1002/adma.202209357
L. Ni, H. Chen, S. Guo, et al., Adv. Funct. Mater. 33 (2023) 2307126. doi: 10.1002/adfm.202307126
X.M. Fan, Z. Zhang, G.Q. Mao, et al., Rare Met. 42 (2023) 2993–3003. doi: 10.1007/s12598-023-02288-y
Y. Chu, S. You, Y. Mu, et al., ACS Nano 18 (2024) 23380–23391. doi: 10.1021/acsnano.4c06663

Scheme 1 (a) The schematic diagram of the preparation process of the diffusion couple and (b) the cation interdiffusion during the sintering process.

Figure 1 (a-c) The optical micrographs, (d-f) the cross-sectional SEM images of the ZrO2/LiNiO2 diffusion couples calcinated at 600, 650 and 700 ℃, (g-i) the curves of the concentrations of Zr4+ and Ni3+ ions versus position. The orange dashed lines present the exact positions of the EDS line scanning.

Figure 2 (a-d) The conventional fitting results (with temperature set as the x-axis and the diffusion coefficient set as the y-axis). (e-h) The linear fitting results of the Arrhenius equation (with the reciprocal of temperature as the x-axis and the negative logarithm of the diffusion coefficient as the y-axis) of the Arrhenius equation for ZrO2/LiNiO2, ZrO2/LiCoO2, ZrO2/LiMnO2, and ZrO2/Li2MnO3 diffusion couples. (i) The comparison of interdiffusion constants and diffusion activation energies, (j) the comparison of diffusion coefficients at 600-750 ℃.

Figure 3 (a-d) The predictive models of ZrO2/LiNiO2, ZrO2/LiCoO2, ZrO2/LiMnO2 and ZrO2/Li2MnO3 diffusion couples calcined at 750 ℃, and the calculation results of diffusion coefficients. (e) The schematic diagram of diffusion depth.

Figure 4 (a, b) The XRD patterns of the Zr-modified cathode materials NM91, NCM811 and NM82. (c-e) The Rietveld refinement of the X-ray diffraction patterns for the Zr-modified cathode samples Z1-NM91, Z1-NCM811 and Z1-NM82. (f) The SEM pictures of cathode sample Z1-NM91. (g) The cross-sectional TEM images with corresponding FFT patterns of cathode sample Z1-NM91.

Figure 5 First-cycle charge-discharge diagram and long-cycle diagram of (a, b) NM82, (c, d) NCM811, and (e, f) NM82 cathode material samples. (g, h) The dQ/dV curves corresponding to the number of cycles of NM91, Z1-NM91 cathode material samples. (i) The bar graph of the improvement effect of the cycle retention rate of 1% Zr-modified cathode material samples compared with pristine samples.

 扫一扫看文章

扫一扫关注我们
 DownLoad:
 下载:
下载:
 下载:
下载: