Center for High Pressure Science and Technology Advanced Research, Beijing 100193, China
b.
College of Materials Science and Engineering, Guilin University of Technology, Guilin 541004, China
c.
Beijing Computational Science Research Center, Beijing 100193, China
d.
School of Materials Science and Engineering & Key Laboratory of Advanced Materials and Devices for Post-Moore Chips, Ministry of Education, University of Science and Technology Beijing, Beijing 100083, China
e.
Guangxi Key Laboratory of Electrochemical and Magnetochemical Function Materials, College of Chemistry and Bioengineering, Guilin University of Technology, Guilin 541004, China
f.
Key Laboratory of Rare Earth Optoelectronic Materials and Devices of Zhejiang Province, Institute of Optoelectronic Materials and Devices, China Jiliang University, Hangzhou 310018, China
Received Date:
05 January 2025 Accepted Date:
12 March 2025 Revised Date:
02 March 2025 Available Online:
15 June 2026
Abstract:
This study reveals the unique electrochemical mechanism of violet phosphorus (VP) as an anode material for lithium-ion batteries. Using solid-state nuclear magnetic resonance (NMR) spectroscopy, we detail the alloying reaction mechanism of VP during lithiation. While alloying behavior in black and red phosphorus has been widely studied, intermediate phases remain poorly understood due to complex phase transitions. Our precise NMR assignments link specific signals in VP to distinct atomic sites. The results show that [P8] cage atoms preferentially react with lithium in the early stages, while [P9] cages provide structural support. VP layered structure allows lithium ions to first intercalate between layers, followed by alloying reactions. These findings offer new insights into VP alloying mechanism, advancing the fundamental understanding of its potential in next-generation energy storage systems.
The escalating global energy crisis and worsening environmental pollution necessitate the urgent development of clean and efficient energy storages. Lithium-ion batteries (LIBs) have become the leading energy storage solution for portable electronics and electric vehicles, favored for their superior energy density, extended cycle life, and eco-friendly characteristics [1–3]. While LIBs have achieved significant commercial success, their full potential has yet to be realized. This underscores the critical need for innovative electrode materials to enhance their energy density, cycling stability, and overall cost-effectiveness [4,5].
Phosphorus has emerged as a highly promising anode material for lithium-ion batteries, offering a high theoretical specific capacity of 2596 mAh/g [6], which arises from its alloying reaction with lithium to form Li3P during lithiation [7–9]. Among red phosphorus (RP), white phosphorus (WP) and black phosphorus (BP), RP has been considered as a more practical and environmentally friendly option compared to WP and BP due to its stability and lower cost. However, the broad application of RP in LIBs is hindered by two significant challenges: Extremely low electronic conductivity (10–14 S/m) [10] and substantial volume expansion (~300%) during lithiation, which would lead to fast capacity decay and material degradation. To address these limitations, recent research has focused on constructing microstructures and composite materials that improve the conductivity and mechanical stability of RP [11–14]. Despite these advances, the need for a phosphorus-based material with better electrochemical performance remains.
Violet phosphorus (VP), a less explored allotrope, has recently appeared to the popular due to its unique structural and electrochemical properties. VP offers several merits over RP, including significantly higher electrical conductivity (10–6 S/m) [15,16] and a crystal structure that reduces Li+ diffusion length and enriches electrochemical active sites [16]. The transition from RP to VP involves a structural transformation that enhances the stability of the material during cycling, making VP a more promising candidate for LIBs. The layered structure in VP facilitates more direct and efficient Li+ migration, resulting in faster kinetics and improved rate performance compared to RP [17,18]. This mechanism, coupled with its structural integrity, positions VP as a superior anode material for next-generation energy storage. However, the underlying mechanisms governing Li+ migration and phase evolution within VP complex lattice remain underexplored.
Understanding the structural evolution during lithiation and delithiation is key to improving anode materials. While synchrotron radiation has been widely used to track phase changes in alloy-type anodes, studies on phosphorus anodes have mostly focused on the start and end states, with intermediate phases remaining unclear due to the difficulty of analyzing amorphous or metastable structures [19]. Phosphorus, being lighter than elements like Sn or Sb, is less suitable for pair distribution function analysis. However, 31P NMR, with its high natural abundance and strong signal-to-noise ratio, offers a powerful tool to investigate these intermediate changes [20–23]. This method provides deeper insights into short-range interactions and phase transitions, enhancing the understanding of phosphorus anode performance.
In this study, we employ a combined approach of solid-state nuclear magnetic resonance (NMR) spectroscopy and density functional theory (DFT) calculations to investigate the alloying reaction mechanism of VP at the atomic level for the first time. Our results reveal that [P8] cages are preferentially lithiated during the initial stages, leading to the formation of Li-P alloy phases such as Li3P7 and LiP, while [P9] cages exhibit relatively lower reactivity during early lithiation, offering critical insights into the materials superior electrochemical performance and guiding future optimizations for next-generation energy storage.
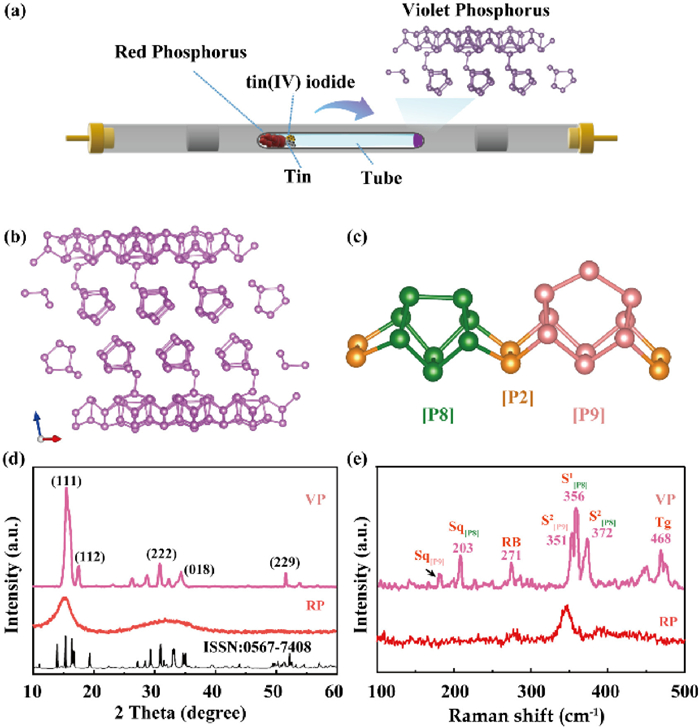
Fig. 1a presents a schematic of the violet phosphorus synthesis process, following the method proposed by Zhang in 2019 [24]. In this procedure, the precursors (tin, amorphous red phosphorus, and tin(Ⅳ) iodide) are sealed within a glass tube and subjected to controlled conditions in a tube furnace. Fig. 1b illustrates the VP structure, comprising two layers with a unit cell consisting of 84 phosphorus atoms in a monoclinic crystal structure. The distinctive pentagonal tube structure of VP is composed of three types of phosphorus cages: [P8] cages, [P9] cages and [P2] dumbbells, to form the fundamental repeating unit. As depicted in Fig. 1c, these tubes are connected perpendicularly and aligned parallel to each other, creating double tube structures. These double tube structures are stacked along the c-axis through van der Waals interactions. Fig. 1d shows that, compared to amorphous red phosphorus, the XRD pattern of VP exhibits sharper and more distinct diffraction peaks, reflecting its higher crystallinity. Comparison with the standard card indicates that VP has been successfully synthesized.
Figure 1
Figure 1.
(a) Schematic diagram of VP synthesis. (b) Schematic diagram of VP structure. (c) The repeating unit structure of violet phosphorus, including [P8], [P2], and [P9] cage. (d) XRD patterns of VP and RP. (e) Raman spectra of VP and RP.
Fig. 1e presents the Raman spectra of VP and RP. Due to its complex tubular structure, VP exhibits more intricate features compared to red phosphorus [25]. The spectrum can be divided into two main regions: Below 200 cm-1 with intertube vibrational modes dominate, and between 200 cm-1 and 500 cm-1 for the intratube vibrational modes [26]. The compression vibrational modes of the [P9] and [P8] cages along the tubular axis are identified at 177 cm-1 (Sq[P9]) and 203 cm-1 (Sq[P8]), respectively. The Raman shift at 271 cm-1 is attributed to an asymmetric radial breathing mode, which predominantly involves the vibrations of the [P8] and [P9] cages, while the [P2] dumbbells remain relatively rigid. The peak at 351 cm-1 represents a stretching mode of the [P9] cage, with the S[P9]2 mode showing stronger stretching near the [P9] atom. The stretching modes of the [P8] cages are observed at 356 cm-1 (S[P8]1) and 372 cm-1 (S[P8]2), with the main distinction between the two modes being the different stretching directions within the cage structure. The Raman peak at 475.7 cm-1 is ascribed to the tangential stretching mode of the [P9] cages along the tubular axis (Tg).
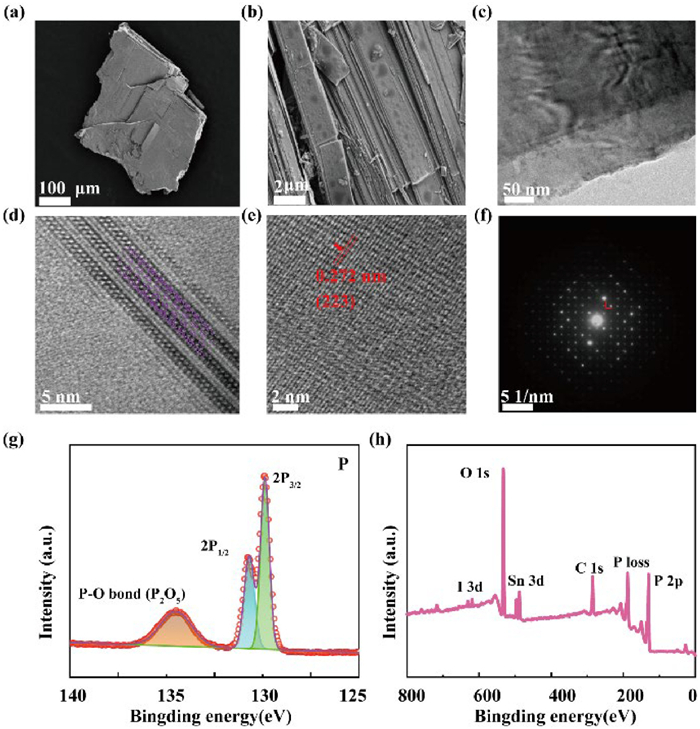
Scanning electron microscopy (SEM) images at different scales, presented in Figs. 2a and b, reveal that the synthesized samples have dimensions in the micrometer range. Notably, evident layered structures are observed in the images, a feature further corroborated by the TEM image in Fig. 2c. High-resolution transmission electron microscopy (HRTEM) in Fig. 2d reveals a tube-in-tube arrangement with parallel alignment, forming a double-layer structure.
Figure 2
Figure 2.
(a, b) SEM images of VP. (c-e) TEM and high-resolution TEM images of VP. (f) The selected-area electron diffraction pattern. (g, h) The XPS survey spectrum and P 2p spectrum of VP.
The diffraction stripes in Fig. 2e indicate a lattice spacing of approximately 0.272 nm, which corresponds to the (223) lattice plane of monoclinic phosphorus. Bright spots in the selected area electron diffraction (SAED) pattern in Fig. 2f confirm that the sample is of high crystallinity, not a polycrystalline or amorphous phase. Surface characterization of the synthesized VP was performed using X-ray photoelectron spectroscopy (XPS) (Figs. 2g and h).
As shown in Fig. 2g, the XPS survey spectrum of VP reveals that phosphorus is the primary chemical element, consistent with the expected composition of VP. We also detected small amounts of tin in the sample, which likely originates from the catalyst, Sn24P19.8I8 [24]. This catalyst played a crucial role in the growth and formation of VP, acting as a nucleating agent that facilitated the growth of the violet phosphorus material [24]. The P 2p spectrum displays two distinct peaks, 2p1/2 and 2p3/2, attributed to spin-orbit coupling, located at 130.0 and 131.4 eV, respectively, which are indicative of P-P bonds (Fig. 2g). Additionally, the peak at 134.7 eV is associated with P-O bonds, reflecting the exposure to the atmosphere with the possible oxidation of crystalline VP. The thermogravimetric analysis (TGA) curve in Fig. S1 (Supporting information) demonstrates that VP possesses excellent thermal stability up to 400 ℃.
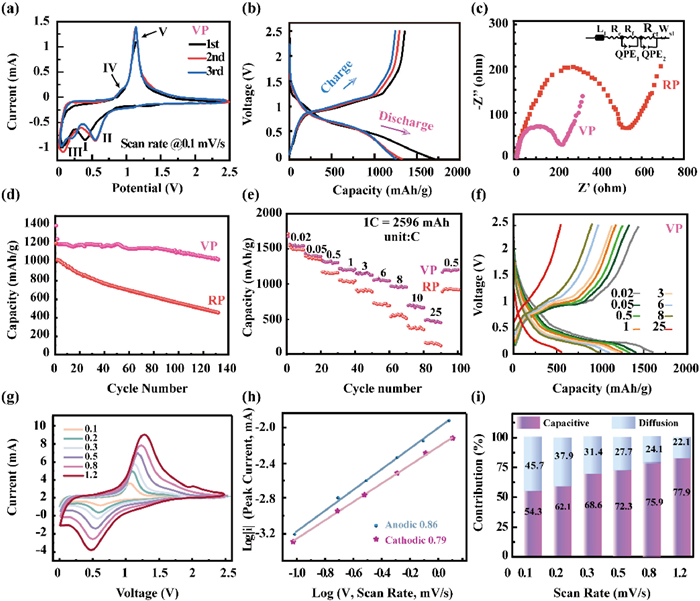
To highlight the electrochemical performance differences between VP and RP, their distinct behaviors are clearly demonstrated through comparative analysis. As shown in Fig. 3a, the first CV scan of VP shows a cathodic peak at 0.2 V (Ⅲ). The peak is related to the initial insertion of Li+ into the VP structure and corresponds to the activation process of lithium, which is essential for the formation of the Li-P alloy. Furthermore, a broad peak around 0.4 V (I) is observed, which corresponds to the insertion of Li+ into the VP structure during the initial stages of lithiation [27]. After the first cycle, peak Ⅱ is observed, which is related to the lithiation process to form LixP (x = 1–3) intermediates. Notably, two oxidation peaks at 0.9 V (Ⅳ) and 1.06 V (Ⅴ) emerge, which correspond to the delithiation process from the fully lithiated Li3P phase. This delithiation process is not a simple one-step reaction but instead involves a multi-step lithium extraction process, during which intermediate phases are formed as lithium is progressively removed from the material [11,28,29]. Compared to VP, RP exhibits broader redox peaks, which may lead to less efficient lithium-ion diffusion and other electrochemical inefficiencies (Fig. S4 in Supporting information). Furthermore, impedance spectra (Fig. 3c) demonstrate that VP has a lower charge transfer resistance (Rct) [30], attributed to its layered structure, which enhances both electronic conductivity and ion diffusion, ultimately boosting rate capability and overall efficiency.
Figure 3
Figure 3.
(a) The CV curve at a scan rate of 0.1 mV/s for VP. (b) First three charge-discharge cycles for VP. (c) EIS spectra of VP and RP electrodes. (d) Long-cycle performance of VP and RP. (e) The rate performances from 0.02 C to 25 C. (f) The charge-discharge curves at different rates for VP and RP. (g) CV curves of VP anodes at different scan rates from 0.1 mV/s to 1.2 mV/s. (h) Plots and corresponding fitting lines of log(i) as a function of log(ν) for VP anodes. (i) Contribution rates of ion diffusion and pseudocapacitance in VP anodes at different scan rates.
In terms of electrochemical performance, the VP anode achieves impressive charge/discharge capacities of 1701/1376 mAh/g at a current density of 0.2 A/g, with an initial coulombic efficiency of 80.1% (Fig. 3b). To clarify the long-term cycling performance, we have provided additional data and analyses in the revised manuscript. Specifically, the capacity is retained at approximately 1000 mAh/g after 100 cycles, while the capacity of RP decays to 500 mAh/g (Fig. 3d).
In contrast, the RP anode displays not only lower stability but also significantly poorer rate capability compared to VP (Figs. 3e and f). Across a wide range of current densities from 0.02 C to 25 C, VP consistently demonstrates superior performance, particularly at higher rates, where RP struggles to maintain efficiency. This striking difference highlights superior rate capability and reaction kinetics of VP. More importantly, the VP anode maintains high performance across both high-rate and low-current cycling tests, suggesting that its layered structure offers significant advantages over the amorphous nature of RP [31]. The layer arrangement in VP allows for lithium-ion intercalation between layers before initiating the alloying reaction, a process not observed in RP. This staged lithiation process enables a more extensive alloying reaction with phosphorus atoms, contributing to the higher capacity of VP. This mechanism has been widely discussed in other layered phosphorus materials, including black phosphorus and blue phosphorus [32].
Additionally, the RP anode suffers from severe volume expansion during lithiation, which often leads to the breakdown of the SEI layer. This SEI disruption creates inactive lithium, or "dead" Li, trapped within the Li-P alloy, further reducing the efficiency of RP [31]. In contrast, VP gradual lithiation and alloying process helps to alleviate excessive volume changes, which in turn supports the formation of a more stable SEI layer. This stabilization plays a crucial role in minimizing irreversible capacity loss and improving the long-term cycling stability of VP. As shown in Fig. S4 (Supporting information), at a current density of 0.5 A/g, the material maintains a relatively intact structure after 20 cycles, with localized ruptures observed predominantly along the direction of the plate-like layers, rather than indicating a collapse of the entire structure. Thus, the structural benefits of VP, including its ability to accommodate lithium ions more gradually, not only prevent abrupt structural failure but also significantly enhance its overall electrochemical performance compared to RP.
Cyclic voltammetry was conducted at different scan rates, as illustrated in Figs. 3g-i, to investigate the electrochemical mechanism of violet phosphorus. Diffusion-controlled behavior and pseudocapacitive storage can be assessed by analyzing the ratio of the square root of the current to the scan rate, with the b values serving as the key factor [33,34]. For the VP anode, the calculated b-values for the anodic and cathodic peaks are 0.86 and 0.79, respectively, suggesting that the capacity is primarily governed by capacitive behavior. The lithium-ion diffusion coefficient was measured using galvanostatic intermittent titration technique (GITT), and the calculated results for the VP anode are shown in Fig. S7 (Supporting information). The VP anode was found to present a higher Li+ diffusion coefficient in the discharging and charging process compared to the RP anode (Fig. S8 in Supporting information). The study reveals that the VP anode exhibits relatively high Li+ diffusion coefficients during both charge and discharge processes. This indicates that the layered structure of VP provides a high aspect ratio, facilitating redox reaction kinetics [35]. These findings are consistent with previous studies, which concluded that pseudocapacitance contributes more significantly to the performance of the VP anode than ion diffusion.
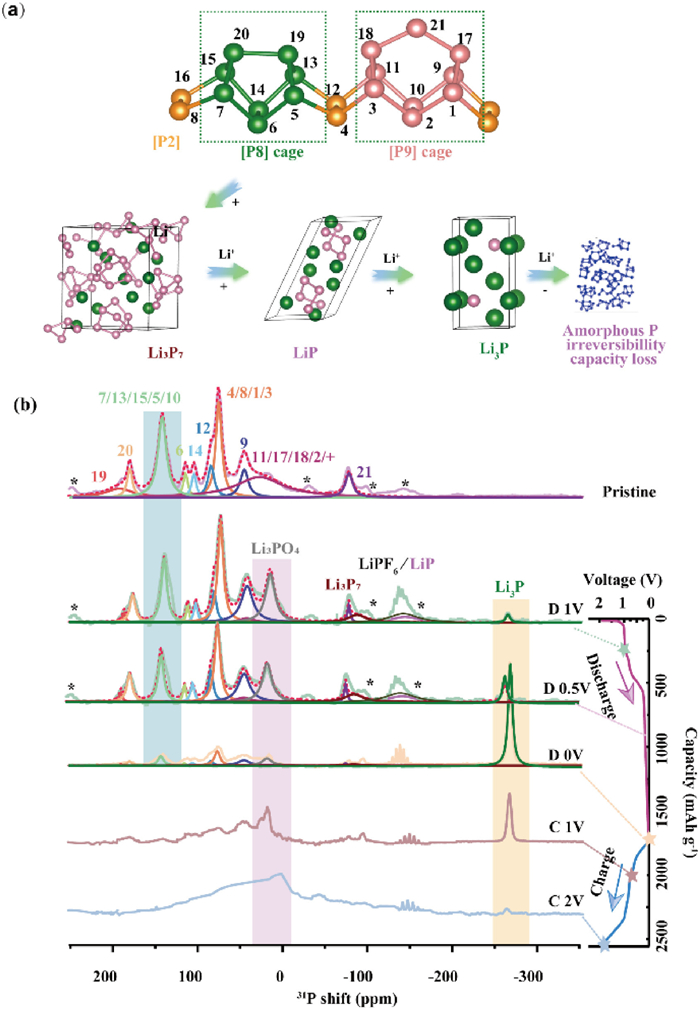
To further elucidate the structural evolution of VP in lithium-ion batteries, ex-situ7Li and 31P MAS NMR spectra were employed to provide detailed insights into the phase changes of VP. Fig. 4a presents the specific atomic positions labeled within the fundamental repeating unit of VP, corresponding directly to the labels in Fig. 4b. Additionally, it illustrates the structural evolution of VP, Li3P7, LiP, and Li3P during the cycling process. Fig. 4b and Table S1 (Supporting information) show the mass-normalized and deconvoluted (fitting) plots of 31P MAS NMR spectra for VP materials at various states. Interestingly, the pristine sample displays several characteristic peaks in the range of 200~−100 ppm, which are distinctly different from the broad peak observed around 117 ppm in white phosphorus [36] and 22 ppm in black phosphorus [37]. Measurements at different spinning speeds ruled out the possibility of spinning sidebands (SSBs). The multiple characteristic peaks suggest a higher structural complexity in VP, compared to black phosphorus or amorphous red phosphorus. This complexity likely arises from the sensitivity of phosphorus magnetic shielding to local distortions within the conical environment, which can be attributed to the basic structural units in VP, such as [P8] cages, [P9] cages, and [P2] dumbbells.
Figure 4
Figure 4.
(a) The diagram of different sites in VP and evolution of VP, Li3P7, LiP, and Li3P during cycling. (b) The 31P NMR spectrum displays the chemical shift characteristics of violet phosphorus in different charge/discharge states. The spinning sidebands are marked with "*" to distinguish them from the main peaks. During discharge, the portion of the crystal structure that remains intact is analyzed through fitting, and the corresponding atomic sites and material phases are indicated in the spectra.
Based on the work of Michael Ruck [38], we have assigned the peaks through fitting, and each site was matched to its corresponding position based on intensity ratios and chemical shifts, as summarized in Table S1. Notably, the peaks at 183.9 ppm and −86.0 ppm are isolated from other features in the spectrum, suggesting their assignment to atoms that connect the upper and lower tubes within the same layer, particularly the tube-connected atoms in the 21st repeat structure. The pronounced low-frequency shifts observed here can be attributed to the shortest P-P bond lengths and the largest P-P-P bond angles in the structure, as well as van der Waals forces between tubes. Similarly, the peak at 171.7 ppm can be assigned to bridge atoms within the [P8] cages. Most atoms in the [P8] cages correspond to the high-frequency region of the spectrum, ranging from 183.9 ppm to 76.1 ppm, while the [P9] cages are found in the lower frequency range of 67.1~−86 ppm. One notable exception is the peak at 133.6 ppm, which corresponds to the atoms in the 10th. Finally, the [P2] dumbbells bridge the [P8] and [P9] cages, and the intensity of each position matches well with the fitted assignments.
The 31P NMR spectra exhibit a wide range of chemical shifts, distinguishing various Li-P alloy phases. Previous computational studies [33] have assigned the 31P resonances at −20~20 ppm, 0~−50 ppm, and −50~−150 ppm to LiP7, LiP5, and Li3P7, respectively. The peaks near −153 ppm and −218 ppm correspond to LiP, while the resonance at approximately −270 ppm is attributed to crystalline Li3P (c-Li3P). Utilizing these assignments, we can track phase transitions in VP during cycling by analyzing changes in peak intensity and position.
At 1 V discharge, as detailed in Table S2 (Supporting information), the fitted 31P spectra show a significant reduction in intensity for peaks corresponding to the 7, 13/15, 5, and 10th within the [P8] cage, compared to the pristine material. Concurrently, the broad peak near 0 ppm diminishes, while a new strong resonance appears, which could be attributed to the formation of Li3PO4 [34]. Additionally, a new peak at −150 ppm emerges, corresponding to a mixture of residual LiPF6 and newly formed LiP. The asymmetry of this peak suggests the coexistence of both species; if only LiPF6 remained, the peak would be symmetric. At −274.8 ppm, a new resonance arises, which can be attributed to the formation of Li3P [33].
Based on these observations, the assignment of each phosphorus site enables a more detailed analysis of the electrochemical processes. Notably, the 21st site, representing the atoms connecting intertube structures, shows minimal changes, suggesting the integrity of this position during discharge. Slight intensity changes in this site might indicate the formation of small amounts of Li3P7, which overlap with the 21st position. Similarly, the bridging atoms between cages, such as those at positions 19th and 20th, exhibit no substantial shifts in either position or intensity, confirming that the layered VP structure remains largely intact at 1 V. This structural stability supports Li+ intercalation into the interlayer spaces, followed by initial alloying reactions, aligning with electrochemical observations.
The [P8] cage exhibits a marked reduction in signal intensity, signifying preferential lithiation at these sites. The high reactivity of phosphorus atoms within the [P8] cage is likely due to shorter P-P bonds, which make Li+ insertion easier, triggering local structural rearrangements and resulting in reduced NMR signal intensity. In contrast, phosphorus atoms in the [P9] cage, which are observed at lower chemical shifts (approximately 67.1~−86 ppm), have relatively longer P-P bonds and exhibit higher structural stability. Consequently, the [P9] cage experiences minimal changes during lithiation, likely serving as a supportive scaffold. In a recent study by Ma et al., it was reported that the P7 cage preferentially forms compared to other cage isomers, exhibiting the lowest binding energy with three lithium ions [32]. This may be attributed to the higher lithiation activity of the [P8] cage, which reacts more readily. From 1 V to 0.5 V during discharge, the intensity of the chemical shift peak corresponding to the [P8] cage decreases further, accompanied by an increase in the content of Li3P. Meanwhile, the intensity reduction of the [P9] cage is less pronounced compared to that of the [P8] cage, providing additional support for the aforementioned conclusions. This selective lithiation process suggests that the [P8] cage dominates the alloying reactions, producing LiP7, LiP, and Li3P phases, while the [P9] cage primarily provides structural stability.
As discharge proceeds from 0.5 V to 0 V, the intensities of LiP7 and LiP5 phases decrease, while amorphous Li3P (α-Li3P) becomes the dominant phase. At 0 V, α-Li3P transitions to the more stable crystalline Li3P, indicating the completion of the alloying process. Upon charging from 0 V, crystalline Li3P undergoes gradual delithiation, as indicated by the diminishing 31P NMR signal at −273.7 ppm. This suggests that Li3P transforms into less ordered Li-P alloy phases. Multiple Li-P alloy phases coexist with the remaining crystalline Li3P, as reflected by the chemical shift distribution in the NMR spectra. By 1 V, the signals corresponding to LiP5 and Li3P7 are reduced, while a broader peak near 0 ppm becomes more pronounced, signaling ongoing delithiation and the reformation of phosphorus structures. Between 1 V and 2 V, the remaining crystalline Li3P is fully delithiated, as the corresponding NMR peak continues to weaken. However, the structure does not fully revert to its original state upon charging. This incomplete recovery is likely due to the persistence of residual Li-P alloy phases, such as LiP7 or Li3PO4, particularly in surface regions. These trapped species likely contribute to reduced coulombic efficiency during cycling, as they are not fully delithiated. Additionally, the partial formation of amorphous phosphorus (A-P) may inhibit the complete restoration of the crystalline structure, which correlates with the observed poor cycling stability of VP.
The spectra presented in Fig. S2 (Supporting information) display simulated and deconvoluted isotropic resonances obtained from 7Li NMR measurements. When discharged to 1 V, three distinct peaks were simulated. The peak at 4.6 ppm is attributed to Li3P [8], accounting for approximately 7% of the composition. This observation aligns with the results from the 31P NMR spectra. Additionally, the peak at 1.26 ppm is possibly assigned to Li3PO4, which remains stable throughout the charge-discharge process. As the battery is further discharged to 0 V, the other alloy phases disappear, resulting in the shift of −1.38 ppm to −0.62 ppm, indicating that this peak predominantly originates from SEI components, such as LiF [39]. At the same time, the crystalline Li3P fraction reaches 63%, consistent with the findings from the 31P spectra. During subsequent charging, an inverse trend is observed. However, when the battery is charged to 2 V, irreversible reactions of some alloy phases prevent full recovery to the initial state.
To further elucidate the underlying mechanisms behind the superior electrochemical performance of the VP anode, we employed DFT calculations to explore lithium-ion adsorption behavior and migration pathways within its layered structure. Experimental observations, particularly VP's exceptional structural stability and high-rate capability, suggest that its distinctive layered configuration plays a critical role in facilitating rapid lithium-ion diffusion. However, the precise adsorption sites and migration pathways of lithium ions within VP remain unresolved. To address this, we conducted theoretical calculations to determine the lowest-energy adsorption sites (Fig. S5 in Supporting information). The calculated adsorption energy of Li on violet phosphorus is 1.6 eV, which is notably stronger than that of materials such as graphene, indicating a favorable adsorption of Li atoms on the VP surface. As shown in Fig. S9 (Supporting information), the results show that the adsorption energies at these sites are as follows: [P8]: −1.59 eV, [P9]: −1.38 eV, [P2]: −1.23 eV. These results confirm that lithium ions preferentially adsorb near the [P8] cages, as the adsorption energy at this site is the most negative. Our results reveal that lithium ions preferentially adsorb near the [P8] cages and migrate along grooves formed by adjacent tubular structures. This theoretical finding aligns with the observed reduction in signal intensity in the 31P solid-state NMR spectra, corroborating the preferential lithiation of phosphorus atoms within the [P8] cages.
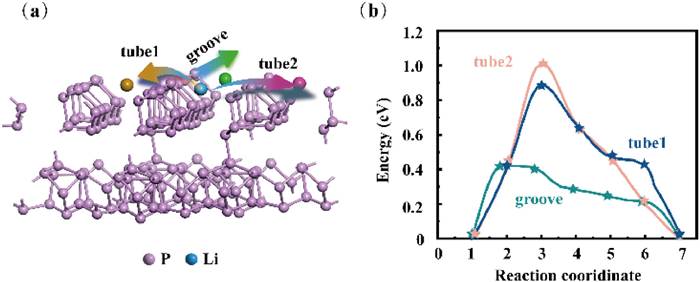
As shown in Fig. S6 (Supporting information), we considered three migration paths for Li atoms. Fig. 5a illustrates the schematic representation of migration pathways, including tube 1, tube 2, and groove. The results demonstrate that when Li diffuses along the groove formed by the two tubular structures, the diffusion barrier is as low as 0.45 eV, with minimal variation in adsorption height (Fig. 5b). However, when Li diffuses between the tubular structures, both the diffusion barrier and the variation in adsorption height increase significantly. These findings indicate a clear anisotropy in Li diffusion along different directions, which may be attributed to the longer P-P bond lengths in the [P9] cages. During inter-tube diffusion, Li must overcome these [P9] cages, resulting in a higher diffusion barrier. These calculations align with the 31P NMR results, particularly during the initial stages of lithiation, validating the preferential lithiation of [P8] cages and the relative structural stability of [P9] cages in the early lithiation process.
Figure 5
Figure 5.
(a) The diagram of pathways. (b) The energy barriers for the three diffusion paths.
In conclusion, this study presents for the first time the unique electrochemical mechanisms of VP as an anode material for lithium-ion batteries. By integrating NMR spectroscopy with theoretical calculations, we discovered that [P8] cages exhibit high reactivity during the initial stages of lithiation. The reaction pathway reveals the stepwise transformation of VP during lithiation and delithiation, from the initial alloying stages (LiP7, LiP5, Li3P7, LiP) to the formation of lithium phosphide (Li3P) and finally to an A-P at the end of the cycle. Through detailed analysis of the reaction pathway during the alloying-dealloying process of VP, we have identified key factors contributing to the irreversible capacity loss, one of which is the formation of Li3PO4 on the surface. Based on these findings, optimizing the electrolyte composition, particularly through the use of fluoroethylene carbonate (FEC) as an additive, emerges as a promising strategy. FEC has the potential to mitigate the formation of Li3PO4, thereby improving the reversibility and cycling stability of VP. Additionally, the controllability of the material during the lithiation/delithiation process can be enhanced by adjusting the arrangement of VP to obtain different derivatives, or by forming heterojunctions between VP and other metal phosphides. These insights into the lithiation process and phase evolution provide a solid foundation for further enhancing VP's performance in high-energy-density lithium-ion batteries.
Declaration of competing interest
The authors declare that they have no known competing financial interests or personal relationships that could have appeared to influence the work reported in this paper.
This work is supported by the National Natural Science Foundation of China (No. 22090043) and China Postdoctoral Science Foundation funded project (No. 2023M733157).
upplementary materials
Supplementary material associated with this article can be found, in the online version, at doi:10.1016/j.cclet.2025.111077.
[1]
J.M. Tarascon, M. Armand, Nature 414 (2001) 359–367. doi: 10.1038/35104644
Figure 1
(a) Schematic diagram of VP synthesis. (b) Schematic diagram of VP structure. (c) The repeating unit structure of violet phosphorus, including [P8], [P2], and [P9] cage. (d) XRD patterns of VP and RP. (e) Raman spectra of VP and RP.
Figure 2
(a, b) SEM images of VP. (c-e) TEM and high-resolution TEM images of VP. (f) The selected-area electron diffraction pattern. (g, h) The XPS survey spectrum and P 2p spectrum of VP.
Figure 3
(a) The CV curve at a scan rate of 0.1 mV/s for VP. (b) First three charge-discharge cycles for VP. (c) EIS spectra of VP and RP electrodes. (d) Long-cycle performance of VP and RP. (e) The rate performances from 0.02 C to 25 C. (f) The charge-discharge curves at different rates for VP and RP. (g) CV curves of VP anodes at different scan rates from 0.1 mV/s to 1.2 mV/s. (h) Plots and corresponding fitting lines of log(i) as a function of log(ν) for VP anodes. (i) Contribution rates of ion diffusion and pseudocapacitance in VP anodes at different scan rates.
Figure 4
(a) The diagram of different sites in VP and evolution of VP, Li3P7, LiP, and Li3P during cycling. (b) The 31P NMR spectrum displays the chemical shift characteristics of violet phosphorus in different charge/discharge states. The spinning sidebands are marked with "*" to distinguish them from the main peaks. During discharge, the portion of the crystal structure that remains intact is analyzed through fitting, and the corresponding atomic sites and material phases are indicated in the spectra.

 DownLoad:

 下载:
下载:


 下载:
下载:
