Figure 1.
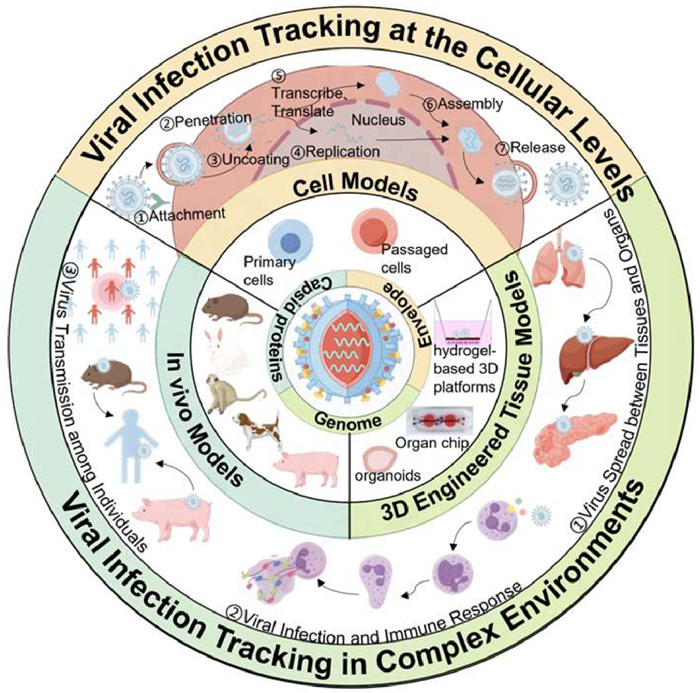
Schematic diagram of the virus infection models and dynamic tracking on the models.

The outbreaks of infectious diseases pose significant challenges to human health and societal stability. Over the past two decades alone, we have witnessed several viral epidemics, including the severe acute respiratory syndrome (SARS) in 2003, the H1N1 influenza in 2009 [1], the Middle East respiratory syndrome (MERS) in 2012 [2], the Ebola hemorrhagic fever in 2014 [3], and the coronavirus disease-2019 (COVID-19) that emerged in late 2019 [4]. Beyond these known threats, humanity also faces the potential danger of other yet-to-be-identified viruses. The continuous emergence of viral infections has caused severe health hazards and economic burdens [5,6]. A comprehensive understanding of the viral infection process and unraveling pathogenic mechanisms are vital for enhancing diagnostic, therapeutic, and preventive strategies.
Viruses, as non-cellular microorganisms, depend on host cells for replication. Viral infection involves complex spatiotemporal dynamic interactions between the virus and the host [7,8]. Fluorescence imaging, a minimally invasive technique, enables real-time visualization of specific components in biological samples with multiple color channels [9]. Therefore, to accurately measure the dynamics, it is crucial to develop sensitive, specific, and stable imaging probes, along with gentle and reliable labeling techniques. Consequently, a range of fluorescent probes [10,11] are developed in conjunction with various labeling methods [12,13]. Additionally, viral infection involves complex interactions between various viral components and cellular structures [14,15], it is necessary to label various components of virus and host cells, capturing the real-time dynamics of viruses within host cells [13]. This complexity is evident not only in their intricate interactions with host cells but also in their dissemination across various tissues and organs [16].
This review focuses on the dynamic tracking of viral infection across cellular, organ, and in vivo levels, providing insights into the mechanisms of viral infection (Fig. 1). Initially, we review the latest advancements in virus labeling probes and labeling strategies that facilitate the observation and tracing of viruses. Next, we briefly summarize the categories and features of virus infection models and discuss the potential and challenges these models present in virus tracking and the acquisition of infection-related information. Finally, we proceed to demonstrate the application of these models for observing virus infection kinetics and deciphering the mechanisms, aiming for a comprehensive and profound understanding of viral biology and host interactions. This article is intended as a valuable reference for researchers who aim to apply the most effective labeling techniques and models within their sophisticated virology research.
The ideal virus-labeling technique must initially be mild and reliable enough to preserve viral infectivity [17]. Secondly, it should provide a strong and photostable enough signal for single-particle and long-term tracking [18]. Additionally, to monitor various stages of the infection process, it is essential to label different viral components, including the capsid, envelope, and genome [19,20]. This requires both optimal fluorescence probes and practical labeling techniques [12]. To date, three types of fluorescence probes are used for virus labeling: fluorescent proteins (FPs), small fluorescent dye molecules, and fluorescent NPs. The main labeling strategies include genetic engineering, chemical and physical methods, and labeling during virus assembly [12,13].
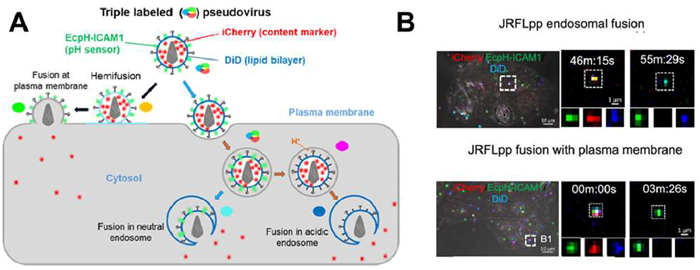
FPs can label specific cellular components, virus envelope proteins and capsid proteins by fusing the FP gene with the gene of interest to express the fusion protein [21,22]. Green fluorescent protein (GFP) is one of the most widely used probes, notable for its substrate-independent luminescence, excellent stability and ease of genetic manipulation in various organisms [23,24]. These properties make GFP an ideal tool for monitoring viral behaviors. For example, fusing the rabies virus (RV) ribonucleoprotein with enhanced GFP (EGFP) enables real-time tracking of RV particles in living cells [25]. The pH-sensitive GFP variants exhibit fluorescence changes under varying pH conditions, allowing tracking of viral behaviors in dynamic pH environments [24,26,27]. For instance, Sharma et al. labeled the envelope of human immunodeficiency virus type 1 (HIV-1) with pH-sensitive GFP variant EcpH-ICAM1 to analyze the single HIV-1 fusion events in TZM-bl cells (a genetically modified HeLa cell lines) (Fig. 2A). The fusion of the HIV JRFL (an envelope glycoprotein variant) with the endosome was indicated by the loss of the fluid-phase viral content marker iCherry, but there were no changes in the fluorescence of the viral membrane marker DiD or EcpH-ICAM-1. In contrast, the concurrent disappearance of both iCherry and DiD signals, while the EcpH-ICAM1 signal remained intact, was observed during the fusion of the viral membrane with the plasma membrane (Fig. 2B) [27].
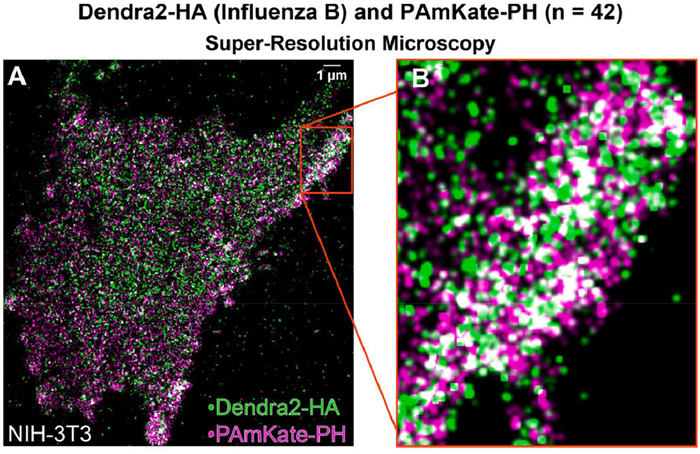
Recent advancements in bioimaging technology have led to the development of novel responsive FPs with unique properties, revolutionizing modern bioimaging. Among these, photoactivated fluorescent proteins (PAFPs) fluoresce only when exposed to specific light wavelengths, offering advantage in multi-color labeling and super-resolution imaging [28]. Researchers can achieve precise imaging of targeted regions or molecules by controlling the timing and location of irradiation [29]. Photoconvertible fluorescent proteins (PCFPs) such as Dendra2, EosFP, and Kaede can change color under different light wavelengths, facilitating multicolor imaging [30,31]. For example, Ngo et al. utilized PAmKate to label the pleckstrin homology (PH) domain, which binds to phosphatidylinositol-4,5-diphosphate (PIP2), and Dendra2 to label the hemagglutinin (HA) protein of influenza B virus (IBV). This allowed observation of HA-PIP2 co-localization, supporting the hypothesis of viral protein interactions with host cell phosphatidylinositol and providing insights into the viral life cycle (Fig. 3) [32].
Photoswitchable fluorescent proteins (PSFPs) can switch fluorescent states via illumination, achieving precise regulation of specific molecules in organisms [33,34]. For example, Dronpa is a monomeric negative PSFP, while rsEGFP2, an engineered retro PSFP derived from wild-type GFP (wtGFP), offers higher brightness, faster switching rate, and higher optical switching quantum yield (PQY). Zhou et al. constructed light-controlled proteins (FLIPs) by fusing Dronpa variants (Dronpa145K and Dronpa145N) to target proteins. In the dark, these variants bind and “trap” the protein in an inactive state. Upon illumination, they dissociate, thereby activating the protein. By applying FLIPs to the hepatitis C virus (HCV) NS3-4A protease, the team tracked protease activation and analyzed its role in host cells [35]. However, FPs may interfere with the normal structure and function of small viruses due to their larger size [24,36]. To minimize interference, peptides can be used as linkers between viruses and fluorescent tags [37]. For example, the His tag, consisting of at least six histidine residues, binds selectively to Ni2+, allowing Ni-NTA-based fluorescent probes to be used for live cell imaging and virus labeling [38].
Compared to FPs, fluorescent dye molecules have smaller molecular weights, greater penetration, and faster response times [39], and are easier to modify [40], making them versatility in viral labeling. They can label viral nucleic acids (RNA or DNA), capsids and envelopes through physical, chemical and metabolic strategies [41]. Physical labeling relies on electrostatic adsorption [42], hydrophobic-lipophilic interactions [43], or embedding [44]. For example, the lipophilic dye, DiD, can spontaneously embedded into the viral lipid membrane, achieving envelope labeling [27]. Chemical labeling such as covalent reactions [45], biological orthogonal reactions [46,47], biotin-streptavidin interactions [48] is extensively utilized in the viral envelope and/or capsid labeling. Seisenberger et al. covalently linked carboxyl-modified CY5 dyes to adenovirus capsid proteins for tracking its invasion into host cells [49,50]. Dense structural components, such as the nucleocapsids or genomes, pose challenges for labeling [51]. Metabolic labeling addresses this by incorporating nucleotide or amino acid analogs into viral nucleic acids or proteins during duplication [51]. For example, azidohomoalanine (AHA) and 5-vinyl-2′-deoxyuridine (VdU) were introduced into viral proteins and genomes, respectively, which can be labeled using strain-promoted azide-alkyne cycloaddition (SPAAC) and inverse electron demand Diels-Alder (iEDDA) reactions during natural propagation process of viruses in host cells (Fig. S1 in Supporting information) [52]. However, conventional fluorescent dyes, while useful, have limitations in long-term tracking, multicolor labeling, and labeling in complex systems due to issues such as photobleaching, broad emission spectra, and environmental sensitivity. Addressing these limitations has become a significant research focus [53].
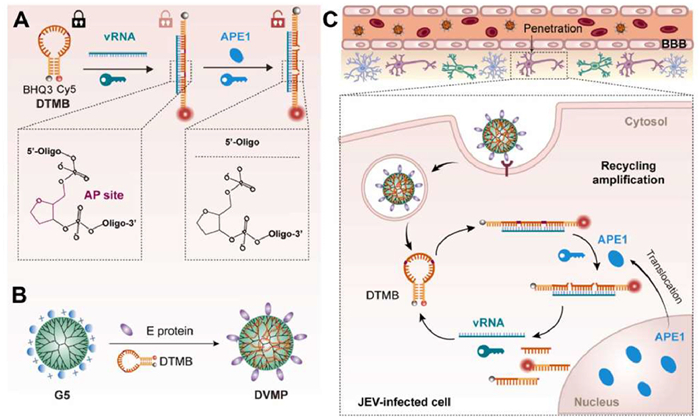
Recently, researchers have designed various responsive fluorescent probes based on principles such as förster resonance energy transfer (FRET), intramolecular charge transfer (ICT), and absorption competition-induced emission (ACIE). These probes exhibit changes in fluorescence intensity, lifetime and emission wavelength in response to the key information during infection such as viral proliferation, and cellular/tissues damage. Liu et al. used Japanese encephalitis virus (JEV) as a model to develop a dual-lock-and-key virus-mimicking nanoprobe (DVMP) [54]. This nanoprobe is fabricated from polyamide dendrimers (PAMAM) that harbor an internalized apurinic/apyrimidinic nucleic acid endonuclease 1 (APE1) and a viral RNA (vRNA) targeted double-trigger molecular beacon (DTMB). The DTMB is structured to incorporate two AP sites and vRNA-complementary sequences within its hairpin loop. This configuration allows it to bind specifically to vRNA and be precisely cleaved by APE1, thereby selectively amplifying the fluorescence signal in regions infected by the virus. This approach provides an ultra-specific and sensitive imaging of viral brain infections in vivo (Fig. 4).
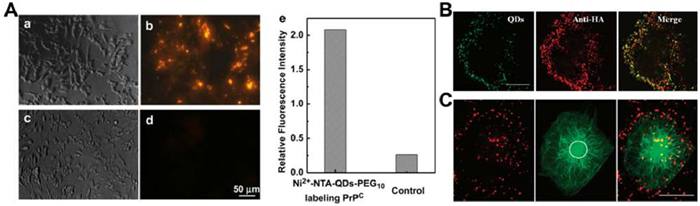
The fluorescent NPs exhibit superior brightness and photostability compared to fluorescent dye, rendering them ideal for virus labeling and long-term dynamic tracking [55]. Quantum dots (QDs) are frequently employed in single-virus tracking. They can be conjugated to viruses through methods such as biotin-streptavidin attachment, antibody binding, aptamer and peptide conjugation, lipid insertion, and bioorthogonal reactions [18,56]. For example, Ni-NTA-functionalized QDs label prions (PrPC) on cell surfaces by conjugation with the C-terminal His6-tag, displaying red fluorescence under blue light. Untransfected cells show minimal fluorescence, correlating with the absence of endogenous PrPC expression (Fig. 5A) [57]. Moreover, QD-labeled oligonucleotides containing the virus packaging signal can bind viral genomes in infected cells. Pang et al. biotinylated the influenza virus surface and labeled it with streptavidin-modified QDs (SA-QD) [58]. Multi-labeling methods have also been developed to clarify the process of viral infection [59]. For example, the viral envelope and genome were individually labeled with green QDs and Syto 82 (Fig. 5B), revealing an influenza virus infection model where the virus gathers at the “microtubule organizing center (MTOC)” (Fig. 5C) [58].
Besides, carbon quantum dots (CQDs) and rare earth-doped NPs have also been developed for virus labeling [60]. They have the advantages of attractive photoluminescence, light stability, and biocompatibility [61,62]. For instance, lanthanide-doped upconversion nanoparticles (UCNPs) were employed to label influenza A virus (IAV). Biotinylated DSPE-PEG2000 molecules were added to the host cell culture medium to biotinylate the viral envelope, which was then bound to avidin-modified UCNP [63]. Similarly, capsid proteins (VCPs) of porcine circovirus type 2 (PCV2) were conjugated to UCNPs to study their endocytosis pathway in hepatocellular carcinoma HepG2 cells using single-particle imaging under near-infrared light [64]. Fluorescent NPs can also be used to construct responsive probes based on the principles of FRET and ICT, enabling the study of virus infection events. The developments in imaging probes and labeling techniques have greatly advanced virology research, allowing real-time observation of viral infection and deepening our understanding of viral infection mechanisms and pathogenesis, therapeutic development [65].
Non-genetically encoded fluorescent dyes and NPs can target viral components by physical adsorption, chemical reaction, or metabolic action. Physical labeling quickly labels enveloped virus [27], while chemical labeling targets viral proteins with higher universality but often lacks sites-specific accuracy [45]. In contrast, FPs can be precisely targeted to specific viral sites using genetic engineering, thus providing higher specificity and spatial resolution (Table S1 in Supporting information).
Cells are crucial models for studying viral infections, offering a controlled environment to observe the complete viral life cycle, from attachment to release [66]. Primary cells, isolated directly from tissues, closely mimic in vivo conditions [67]. However, they have limited proliferation capacity, batch-to-batch variability, and require specific culture conditions, which can affect reproducibility [68,69]. In contrast, passaged cells form stable cell lines with consistent morphology and high scalability [70]. The choice between primary and passaged cells depends on the purpose of the study, experimental design, and the need for physiological simulation. Primary cells better simulate in vivo conditions, while passaged cells provide consistency and scalability. The more detailed comparison is shown in Table S2 (Supporting information). Careful consideration of these factors is essential to ensure the validity and applicability of experimental results.
Viral infection involves complex interactions between viruses and host cells, as well as their spread across tissues, organs, and individuals [71,72]. This process depends on tissue and individual susceptibility, viral adaptability, and the host's immune response [73,74]. Therefore, it is necessary to study viral infections in vivo. Mice are the most common in vivo model for human viral diseases due to their low cost, ease of breeding, and physiological similarities to humans, especially in immune, respiratory, and reproductive systems [75]. This environment, including temperature, humidity, and diet, can be precisely regulated [75]. Inbred mice possess a consistent genetic background for targeted gene editing, enabling the creation of specific models [76–78]. However, some viruses do not infect mice, and the pathogenic mechanisms can differ from humans. Humanized mouse models, created with immunodeficient mice by inserting specific genes associated with human viral infection, are used to study viral pathogenesis [79,80]. Primates, such as macaques and rhesus monkeys are widely used for COVID-19 [81], while orangutans are often used to study Ebola virus infection [82]. Rabbits and dogs can also be used for viral infection studies [83–85]. Future research should systematically compare different animal models to identify the most suitable model for specific viruses and research questions (Table S3 in Supporting information).
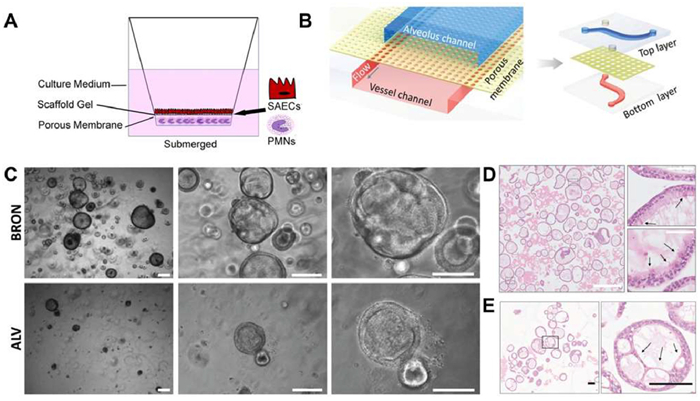
Viral infection pathways are complex, with variations in transmission modes, pathogenesis, disease progression, and clinical symptoms across different organ systems. Deciphering these dynamics in vivo is challenging due to the significant size discrepancy between viruses and animal models, highlighting the need for organ-level infection models [86]. Three-dimensional (3D) engineered tissue models, including hydrogel-based 3D cell culture models [87,88], organoids [86,89,90], and organ-on-a-chip [91,92], are promising models. Hydrogel-based 3D cell culture models mimic human organs structures, promoting complex cell-cell and cell-extracellular matrix interactions [93–96]. These models facilitate the study of viral infections at the organ level and aid in identifying new therapeutic targets [93]. For instance, the mucilAir™ medium, containing basal and goblet cells, is used to develop 3D in vitro lung tissue models. A gel scaffold enhances cell adhesion, and an air-liquid interface (ALI) simulates respiratory conditions (Fig. 6A) [97]. Imle et al. also constructed a 3D culture system of human CD4 T cells with collagen to mimic T cell density and migration, providing a specific microenvironment for virus transmission [98]. Organ-on-chip technology cultures tissue cells in microfluidic chips, which are fabricated via soft lithography [99], 3D printing [100–102], or plastic injection moulding [103,104]. These chips replicate in vivo conditions, including blood/air flow, respiratory motion, cardiac contraction, and electrophysiology [91,105–109]. For example, Zhang et al. constructed a human alveolar (ALV) chip using polydimethylsiloxane (PDMS) and polyethylene terephthalate (PET) membranes. Human pulmonary airway epithelial type II cell (AT II) line (HPAEpiC) was cultured in the upper channel, while lung microvasculature cells (HULEC-5a) were cultured in the lower channel. A peristaltic pump simulated hemodynamics by varying the medium flow rates (Fig. 6B) [110]. Organoids, formed by stem cell differentiation and self-organization [111,112], replicate organ structures and functions [113–118]. For instance, Engelsen et al. created large bronchiolar (BRON, upper panel) and ALV (lower panel) 3D organoids from adult stem cells, exhibiting a characteristic hollow lumen morphology (Fig. 6C). Ciliated cells were identified in hematoxylin and eosin (HE)-stained sections of BRON organoids, and AT1-like parenchymal cells were observed in ALV airway organoids (Figs. 6D and E) [119].
These models provide more physiologically relevant environments than traditional 2D cell cultures, enabling studies of viral infection mechanisms that closely mirror human body. However, each system comes with its own set of technical challenges, such as the need for specialized equipment, standardization and scalability. Each system has unique strengths, organ-on-chip for high-throughput studies, the organoids for complex tissue architecture, and hydrogel 3D culture models for customization. The in-depth analysis of the 3D engineered tissue models is shown in Table S4 (Supporting information). Overall, these multi-cellular models replicate organ microenvironment, demonstrating in vivo-like pathogenesis and viral replication [120]. However, replicating human-specific infectious diseases in these systems presents numerous challenges, including precise modeling of human pathogenesis, the involvement of immune cells, inter-organ interactions, and the integration of artificial intelligence-based analyses [121,122].
Understanding the dynamics of viral infection is crucial for unravelling its mechanisms. The previous section outlined viral labeling methods and the establishment of infection models, providing a foundation for insights into viral behavior. In this section, we will delineate the procedures for tracking viruses dynamics within these established models. Additionally, we will discuss the critical virological insights that can be obtained through the dynamic tracking of the virus infection process.
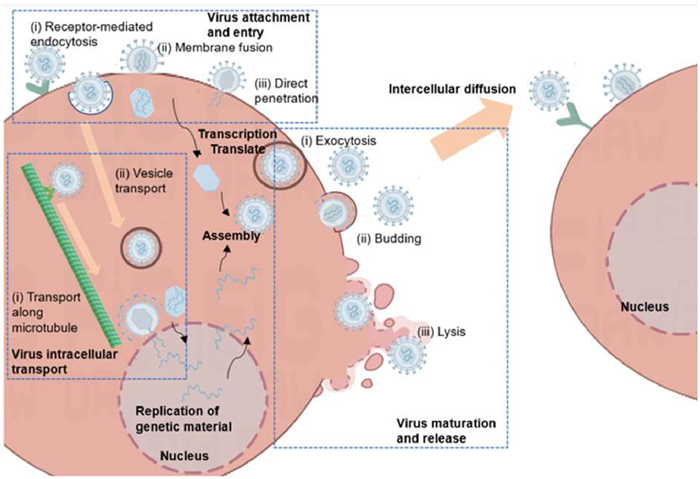
Viral infection is a highly complex, multi-stage process involving a series of dynamic interactions between viruses and host cells. The process of virus infection in and between cells is roughly shown in Fig. 7. Tracking viral behaviors at the cellular level can clarify many aspects of this process [55,123,124]. Liu et al. dynamically tracked fluorescently labeled influenza viruses at the cell level, revealing a five-stage intracellular transport process, attachment to the cell surface, movement along actin filaments, rapid movement toward the nucleus in a microtubule-dependent manner, interaction and fusion with the genome in late nuclear endosomes, and release into the cytosol [57].
Viral infection begins with endocytosis, a key phase in the virus life cycle that determines its ability to invade host cells and replicate [8]. There are specific ligands on the surface of the virus [125], such as glycoproteins and lipoproteins, they can recognize and bind to host cell receptors. The specific recognition is vital for infection [126,127]. Viruses enter cells through various endocytic pathways, including macropinocytosis, caveolar/raft-dependent endocytosis, and clathrin–caveolin/raft-independent pathways [128–130]. Live cell imaging has substantially improved our understanding of viral entry [131–134]. For example, tracking fluorescently labeled individual mouse leukemia viruses (MLVs) revealed their attachment to cell surface pseudopods and subsequent actin-dependent movement to endocytosis sites [135]. Another study demonstrated that severe fever with thrombocytopenia syndrome virus (SFTSV) infection recruits cytoplasmic lattice proteins to the plasma membrane, where they assemble to form lattice protein-coated capsids (CCPs) (Fig. 8A). These CCPs, under the action of dynamin, detach from the plasma membrane to enter the cytoplasm as complete lattice protein-coated vesicles (CCVs) (Fig. 8B) [132].
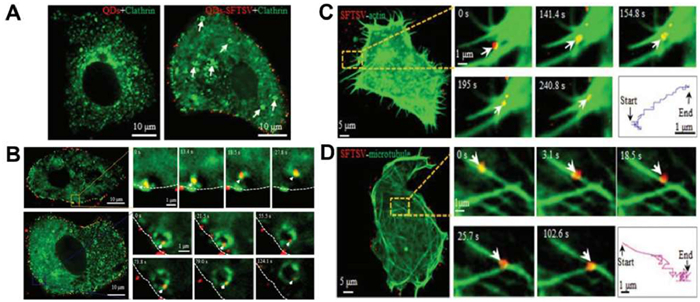
After entering the cell, viruses are transported within intracellular vesicles to specific cellular locations where they release their genome for replication. By labeling HIV integrase, Charneau et al. found that HIV complexes move towards the nucleus in a manner dependent on both microtubules and actin before entering the nucleus [133]. In contrast, SFTSV initially depends on actin filaments for intracellular transport. After endocytosis, it is then moved along microtubules towards the central cytoplasm (Figs. 8C and D) [132].
Following genome replication and protein synthesis, the newly formed viral components are transported to specific sites for assembly. The assembled progeny viruses are subsequently released via exocytosis [136,137], cell lysis [138–140], or budding [141–143]. HIV assembles and releases through budding, during which cytoplasmic membrane is incorporated into the virion to form a new envelope [144]. In this process, the Gag protein plays a key role in assembling and releasing virus particles [134,145]. Perlman et al. used biarsenate/tetracycline (TC) labeling to track HIV-1 Gag protein, revealing its distribution, clustering, and transport to the plasma membrane [145].
In summary, tracking virus infection at the cellular level elucidates the intricate details of the viral infection process, including internalization, transport, genome delivery, assembly, and release. This enhances our comprehensive understanding of viral infection mechanisms and advances the field of virology.
Monitoring viral infection within complex environments involves understanding the dynamic behavior of virus spread and diffusion among different tissues, organs, and individuals, as well as the body's immune response and defense mechanisms against viral infections. This comprehensive view further deepens our insight into viral infection kinetics and virus-host interactions.
Viruses spread in tissues and organs through various mechanisms, including local cell-to-cell movement and systemic dissemination [146]. The spread of the virus between different organs in the body is roughly shown in Fig. 9. Tracking the virus between tissues and organs can accurately understand the spread mechanism and path of the virus, such as the distribution of the virus at the lesion site [147], the sensitivity of different organs to the virus [148], and the damage degree of the virus infection to different organs [91]. Tracking the virus spread can provide more precise data for studying virus spread mechanisms by measuring virus spread speed, spread range, and virus population changes [13,149]. In addition, monitoring multiple parameters at the same time, such as the spread of the virus, the behavior of the cell, and the microenvironment changes of the tissue, can gain a more comprehensive understanding of the virus spread process [150].
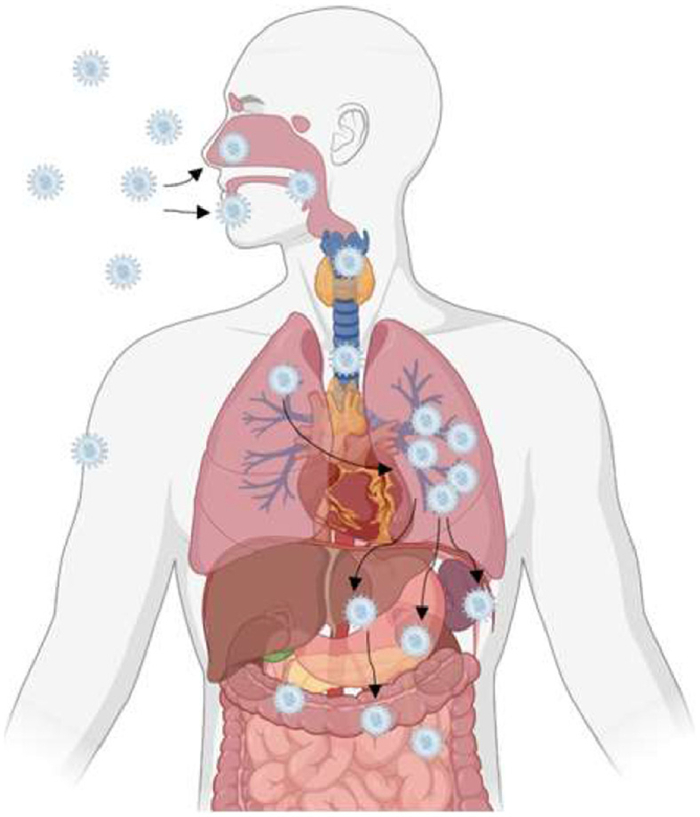
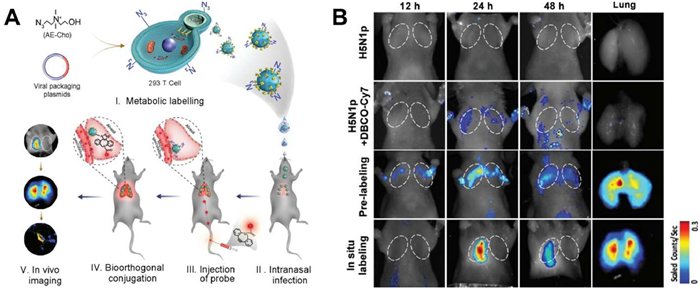
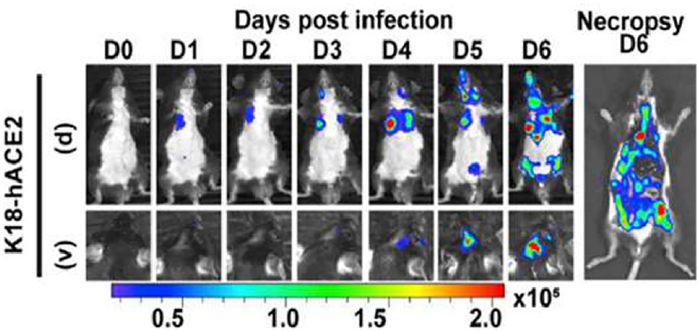
Influenza viruses, known for their high transmissibility and variability, have attracted considerable research interest [151,152]. In 2017, Cai et al. developed an in vivo labeling strategy to monitor viral particles (H5N1 pseudotype virus (H5N1p)) in infected lung tissues, revealing virus replication and spread in mouse lungs over time (Fig. 10) [153]. Human coronaviruses, like severe acute respiratory syndrome coronavirus 2 (SARS-CoV-2), primarily infect the upper respiratory tract, the progeny viruses subsequently spread to the lower respiratory tract and potentially other organs such as the heart, liver, kidneys, and digestive system [154]. In a groundbreaking 2021 study, Ullah et al. employed bioluminescence imaging to monitor SARS-CoV-2-nanoluciferase (Nluc) replication dynamics in human angiotensin converting enzyme 2 (hACE2) transgenic mice, elucidating that the virus initially replicates in the nasal cavity before disseminating to the lungs and eventually to various organs across the body (Fig. 11) [149]. Analogously, Zheng et al. used the fluorescent reporter Zika virus (ZIKV)-Nluc to track the transmission of ZIKV in mice in real time. The results showed that the virus infection was mainly confined to the inoculation site and abdominal cavity in the early stage and then gradually spread to the brain and other organs, in which the ileocecal part was the key visceral target of the virus infection [148].
Investigating the dynamics of immune responses in complex tissue settings is crucial for understanding how the host combats viral infections in diverse environments. Systematic analysis of the immune response mechanism can help us reveal several key aspects, first, by utilizing high-resolution imaging techniques such as confocal microscopy and super-resolution microscopy to observe the activation and migration of innate immune cells after viral infection. This includes the visualization of dynamic expression of pathogen recognition receptors (PRRs) and signaling pathways, revealing the rapidity and efficiency of the innate immune response. Secondly, the initiation and regulation of adaptive immune response can be analyzed. Through fluorescence labeling and flow cytometry, we can monitor the activation and proliferation of B cells and T cells as well as the production of antibodies and cytokines in real time, and explore the recognition and clearance process of cytotoxic T cells to infected cells and the immune response of B cells to infection. Further, we can investigate how viruses evade immune surveillance through a variety of strategies, including visualizing the interaction of viral proteins with host immune molecules, and the effects of viral infection on immune cell function. Finally, by integrating multimodal imaging techniques and bioinformatics analysis, we will build a comprehensive immune response network to systematically resolve immune regulatory mechanisms during viral infection. This analysis not only helps us understand the immunopathology of viral infection, but also provides a theoretical basis for the development of novel antiviral strategies and vaccine design. Through these studies, we expect to provide new perspectives and ideas for the treatment and prevention of viral infections [152,155].
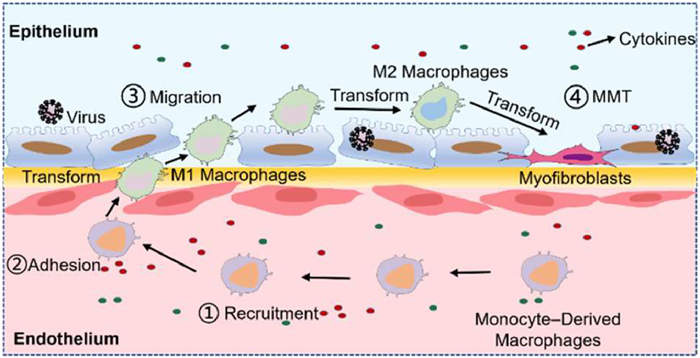
We monitored the immune response of mononuclear-derived macrophages to IAV H9N2 infection in an optimized human ALV chip. The virus infection induced the recruitment and polarization of macrophages into the M1 phenotype which exacerbated ALV barrier damage. Subsequently, M1 macrophages transitioned to the M2 phenotype and transformed into myofibroblasts, contributing to pulmonary fibrosis (PF) through altered cytokine expression (Fig. 12) [156]. Similarly, Salahudden et al. studied the pathogenesis of SARS-CoV-2 in a human distal lung-like organoid model and identified SCGB1A1+ club cells as the target cell population for SARS-CoV-2 infection [157].
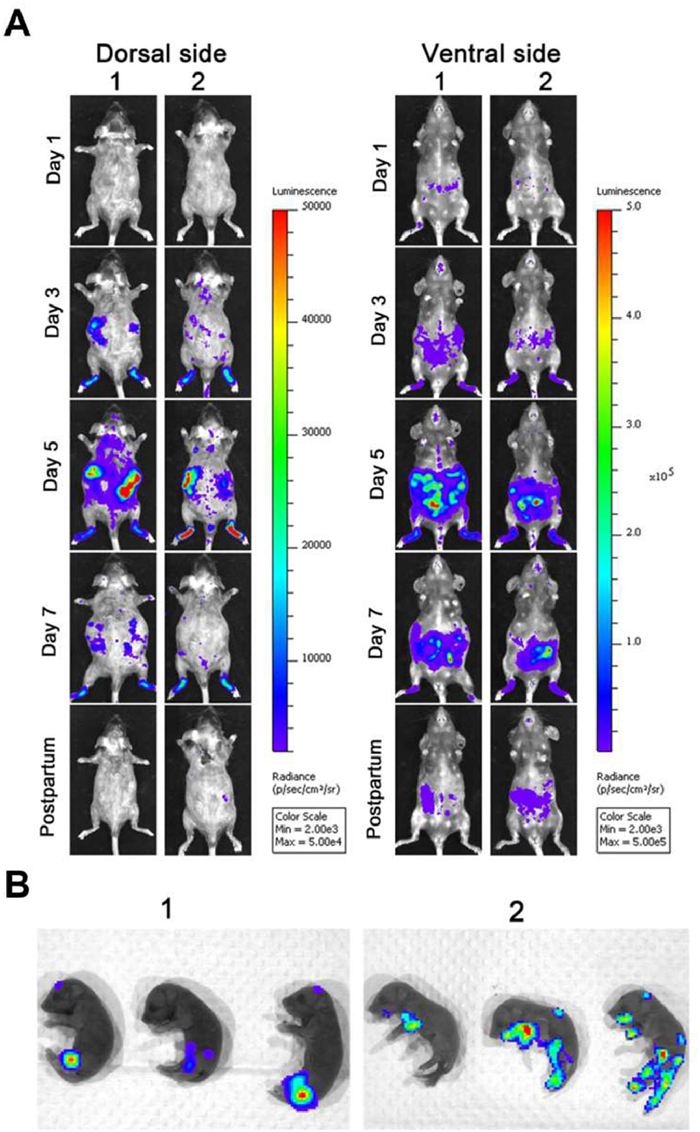
Investigating the transmission of viruses among individuals is crucial for controlling outbreaks, formulating public health policies, and understanding viral evolution. Virus transmission among individuals mainly includes horizontal and vertical transmission [158,159], both of which can be studied using in vivo tracing techniques. For example, Wei et al. discovered that the rice dwarf virus (RDV) was disseminated into the salivary cavities through a pathway involving the exosomal release mediated by Rab27a, confirming that exosomes play a crucial role in facilitating the horizontal transmission of viral pathogens from insect vectors to plant phloem [160]. Furthermore, Zheng et al. tracked ZIKV-Nluc infection dynamics in mice, providing the first real-time, noninvasive insights into the vertical transmission of ZIKV. After intraperitoneal injection of ZIKV-Nluc in pregnant AG6 mice, fluorescent signals were observed in newborn mice, indicating that ZIKV can infect the fetus through the placental barrier (Fig. 13) [148].
Dynamic tracking technologies are revolutionizing our understanding of viral infections by offering unprecedented insights into their complex dynamics and host interactions. At the cellular level, these advanced tools enable comprehensive tracking of the viral life cycle, from attachment and invasion to replication and release, providing a robust foundation for fundamental virological research. Moreover, they reveal the heterogeneity of infections, allowing for the detailed analysis of individual cell responses within infected populations.
Animal models, with their physiological similarities to humans, offer a research platform that mimics in vivo human conditions [161]. They allow for the study of systemic viral effects, including transmission, pathogenesis, organ damage, and immune responses. This comprehensive approach helps us to gain a deeper understanding of virological properties [162]. However, physiological and immunological differences between species, along with potential viral behavior variations, limit model predictability [163,164]. Using animal models for research is time-consuming and resource-intensive compared with in vitro cellular models. Ethical issues also arise with the use of animal models. Additionally, some nuanced information, such as the heterogeneity of the virus, transmission between organs, and the transient nature of the infection process, can be difficult to obtain in vivo. By combining with fluorescent tags with 3D tissue and in vivo tracking technology, we can visualize virus movement trajectories in complex environments in real-time [165]. This approach is instrumental in elucidating the overall dynamics of viral infections and the immune response of hosts. By tracking viruses in 3D tissue, researchers obtain in-depth insights into the viral distribution throughout tissues and organs, along with the interactions among viruses, host cells, and the immune system, facilitating deeper investigations into viral infection mechanisms.
Beyond scientific and technical factors, it is imperative to address the ethical and safety implications associated with various research models. Virus research involving animal models must comply with ethical standards and animal welfare regulations. Virus research using animal models must adhere to ethical principles and animal welfare standards. Researchers should prioritize the 3Rs principles (replacement, reduction, and refinement) to minimize animal use and suffering. For example, alternative methods like in vitro models or computational simulations should be explored whenever feasible. Proper feeding, anesthesia, and humane endpoints are essential to ensure animal welfare throughout the study. The employment of 3D tissue models also raises ethical issues, particularly when they involve human or embryonic cells, necessitating informed consent from donors and the safeguarding of their privacy. Future research should establish standardized protocols for the ethical use of 3D tissue models, including guidelines for data sharing, and model disposal. Additionally, the development and application of advanced fluorescent probes and nanomaterials must take into account potential environmental and biosafety risks. Guidelines for the safe handling, disposal, and recycling of these materials should be developed to mitigate potential risks. Meanwhile, collaboration with regulatory agencies and environmental scientists is crucial to ensure the responsible development and application of these technologies.
Looking ahead, the ongoing innovation in fluorescent probe and labeling technologies, coupled with the development of infection models, is poised to enhance our ability to conduct more detailed and comprehensive studies of viral infection processes through dynamic tracking. The broader application of cutting-edge imaging modalities and analytical methods, along with the integration of bioinformatics and computational modeling, will further refine our understanding of how viruses infect and interact with their hosts. These advancements not only address fundamental virological questions but also bolster our preparedness against emerging pathogens.
The authors declare that they have no known competing financial interests or personal relationships that could have appeared to influence the work reported in this paper.
Shujun Liu: Writing – original draft, Investigation, Formal analysis, Data curation. Wenfeng Xu: Project administration, Methodology, Data curation. Pengfei Jin: Writing – review & editing, Supervision, Funding acquisition, Conceptualization. Li-Li Huang: Writing – review & editing, Supervision, Funding acquisition, Conceptualization.
This work was funded by the National Natural Science Foundation of China (No. 22274011), Hebei Natural Science Foundation (No. B2024105013), Beijing Institute of Technology Research Fund Program for Young Scholars (No. 2020-2024), Beijing Natural Science Foundation Proposed Program (No. L242138), Capital's Funds for Health Improvement and Research (No. CFH 2024-1-4052) and National Health Commission Clinical Research Projects for Innovative Drugs (No. WKZX2023CX210007).
Supplementary material associated with this article can be found, in the online version, at doi:
Z.Hong Wu, Y. Jing, H. Wen Xian, et al., Influenza A (H1N1), in: P.X. Lu, B.P. Zhou (Eds.), Diagnostic Imaging of Emerging Infectious Diseases, Springer, Dordrecht, 2016, pp. 57–76.
E.I. Azhar, D.S.C. Hui, Z.A. Memish, C. Drosten, A. Zumla, Infect. Dis. Clin. N. Am. 33 (2019) 891–905. doi: 10.1016/j.idc.2019.08.001
S. Hasan, S.A. Ahmad, R. Masood, S. Saeed, J. Fam. Med. Prim. Care 8 (2019) 2189–2201. doi: 10.4103/jfmpc.jfmpc_297_19
S. Sanche, Y.T. Lin, C.G. Xu, et al., Emerg. Infect. Dis. 26 (2020) 1470–1477. doi: 10.3201/eid2607.200282
S.R. Stein, S.C. Ramelli, A. Grazioli, et al., Nature 612 (2022) 758–763. doi: 10.1038/s41586-022-05542-y
M. Rojas, D.M. Monsalve, Y. Pacheco, et al., J. Autoimmun. 106 (2020) 26. doi: 10.2307/j.ctv15d821h.8
E. de Wit, N. van Doremalen, D. Falzarano, V.J. Munster, Nat. Rev. Microbiol. 14 (2016) 523–534. doi: 10.1038/nrmicro.2016.81
A.E. Smith, A. Helenius, Science 304 (2004) 237–242. doi: 10.1126/science.1094823
A. Refaat, M.L. Yap, G. Pietersz, et al., J. Nanobiotechnol. 20 (2022) 450. doi: 10.1186/s12951-022-01648-7
J.H. Zhang, H.Y. Li, B. Lin, et al., J. Am. Chem. Soc. 143 (2021) 19317–19329. doi: 10.1021/jacs.1c04577
M. Pirzada, Z. Altintas, Chem. Soc. Rev. 51 (2022) 5805–5841. doi: 10.1039/d1cs01150b
D. Liu, L. Pan, H.J. Zhai, H.J. Qiu, Y. Sun, Front. Immunol. 14 (2023) 1204730. doi: 10.3389/fimmu.2023.1204730
S.L. Liu, Z.G. Wang, H.Y. Xie, et al., Chem. Rev. 120 (2020) 1936–1979. doi: 10.1021/acs.chemrev.9b00692
R. Aviner, J. Frydman, Cold Spring Harb. Perspect. Biol. 12 (2020) a034090. doi: 10.1101/cshperspect.a034090
W.B. Wang, J.Z. Chen, X.Q. Yu, H.Y. Lan, Int. J. Biol. Sci. 18 (2022) 4704–4713. doi: 10.7150/ijbs.72663
A. Chaillon, S. Gianella, S. Dellicour, et al., J. Clin. Investig. 130 (2020) 1699–1712. doi: 10.1172/jci134815
X.L. Ke, C.J. Li, D. Luo, et al., J. Nanobiotechnol. 19 (2021) 295. doi: 10.1109/iciba52610.2021.9688179
Z.G. Wang, S.L. Liu, D.W. Pang, Acc. Chem. Res. 54 (2021) 2991–3002. doi: 10.1021/acs.accounts.1c00276
A.X. Ma, C. Yu, M.Y. Zhang, et al., Nano Lett. 24 (2024) 2544–2552. doi: 10.1021/acs.nanolett.3c04600
A.A. Liu, Z.F. Zhang, E.Z. Sun, et al., ACS Nano 10 (2016) 1147–1155. doi: 10.1021/acsnano.5b06438
E.A. Rodriguez, R.E. Campbell, J.Y. Lin, et al., Trends Biochem. Sci. 42 (2017) 111–129. doi: 10.1016/j.tibs.2016.09.010
K.A. Lukyanov, Biochem. Biophys. Res. Commun. 633 (2022) 29–32. doi: 10.1016/j.bbrc.2022.08.089
J. Kong, Y.F. Wang, W. Qi, et al., Adv. Colloid Interface Sci. 285 (2020) 102286. doi: 10.1016/j.cis.2020.102286
R.N. Day, M.W. Davidson, Chem. Soc. Rev. 38 (2009) 2887–2921. doi: 10.1039/b901966a
Y. Klingen, K.K. Conzelmann, S. Finke, J. Virol. 82 (2008) 237–245. doi: 10.1128/JVI.01342-07
D.M. Shcherbakova, O.M. Subach, V.V. Verkhusha, Angew. Chem. Int. Ed. 51 (2012) 10724–10738. doi: 10.1002/anie.201200408
M. Sharma, M. Marin, H. Wu, D. Prikryl, G.B. Melikyan, ACS Nano 17 (2023) 17436–17450. doi: 10.1021/acsnano.3c05508
L. Olivi, C. Bagchus, V. Pool, et al., Nucleic Acids Res. 52 (2024) 5241–5256. doi: 10.1093/nar/gkae283
K. Nienhaus, G.U. Nienhaus, Chem. Soc. Rev. 43 (2014) 1088–1106. doi: 10.1039/C3CS60171D
V. Adam, R. Berardozzi, M. Byrdin, D. Bourgeois, Curr. Opin. Chem. Biol. 20 (2014) 92–102. doi: 10.1016/j.cbpa.2014.05.016
K. Nienhaus, G.U. Nienhaus, RSC Chem. Biol. 2 (2021) 796–814. doi: 10.1039/d1cb00014d
V.N. Ngo, D.P. Winski, B. Aho, et al., Virology 599 (2024) 110198. doi: 10.1016/j.virol.2024.110198
F. Pennacchietti, E.O. Serebrovskaya, A.R. Faro, et al., Nat. Methods 15 (2018) 601–604. doi: 10.1038/s41592-018-0052-9
L.T. Tang, C. Fang, Int. J. Mol. Sci. 23 (2022) 6459. doi: 10.3390/ijms23126459
X.X. Zhou, H.K. Chung, A.J. Lam, M.Z. Lin, Science 338 (2012) 810–814. doi: 10.1126/science.1226854
I. Chen, A.Y. Ting, Curr. Opin. Biotechnol. 16 (2005) 35–40. doi: 10.1016/j.copbio.2004.12.003
D.Y. Orgeirsdottir, J.H. Andersen, M. Perch-Nielsen, et al., Eur. J. Pharm. Sci. 183 (2023) 106400. doi: 10.1016/j.ejps.2023.106400
Y.K. Gong, L.F. Pan, Tetrahedron Lett. 56 (2015) 2123–2132. doi: 10.1016/j.tetlet.2015.03.065
N. Vogt, Nat. Methods 18 (2021) 27. doi: 10.1038/s41592-020-01026-x
M. Minoshima, S.I. Reja, R. Hashimoto, K. Iijima, K. Kikuchi, Chem. Rev. 124 (2024) 6198–6270. doi: 10.1021/acs.chemrev.3c00549
D. Sivaraman, P. Biswas, L.N. Cella, M.V. Yates, W. Chen, Trends Biotechnol. 29 (2011) 307–313. doi: 10.1016/j.tibtech.2011.02.006
N.K. Singh, K. Pushpavanam, M. Radhakrishna, ACS Appl. Bio Mater. 7 (2024) 596–608. doi: 10.1021/acsabm.3c00125
Y.P. Wang, K. Wu, M. Pan, et al., ACS Appl. Mater. Interfaces 12 (2020) 35873–35881. doi: 10.1021/acsami.0c08462
Y.D. Gang, H.F. Zhou, Y. Jia, et al., Front. Neurosci. 11 (2017) 121.
W. Wan, Y.A. Huang, Q.X. Xia, et al., Angew. Chem. Int. Ed. 60 (2021) 11335–11343. doi: 10.1002/anie.202015988
J.A. Prescher, C.R. Bertozzi, Nat. Chem. Biol. 1 (2005) 13–21. doi: 10.1038/nchembio0605-13
M. Jurkovic, M. Ferger, I. Draskovic, T.B. Marder, I. Piantanida, Pharmaceuticals 16 (2023) 1208. doi: 10.3390/ph16091208
T. Wang, Z.H. Zheng, X.E. Zhang, H.Z. Wang, Talanta 158 (2016) 179–184. doi: 10.1016/j.talanta.2016.04.052
C. Bräuchle, T. Endress, A. Zumbusch, et al., ChemPhysChem 3 (2002) 299–303. doi: 10.1002/1439-7641(20020315)3:3<299::AID-CPHC299>3.0.CO;2-R
G. Seisenberger, M.U. Ried, T. Endress, et al., Science 294 (2001) 1929–1932. doi: 10.1126/science.1064103
L. Wen, Y. Lin, Z.L. Zhang, et al., Biomaterials 99 (2016) 24–33. doi: 10.1016/j.biomaterials.2016.04.038
L.L. Huang, K.J. Liu, Q.M. Zhang, et al., Anal. Chem. 89 (2017) 11620–11627. doi: 10.1021/acs.analchem.7b03043
Y.F. Yang, F.C. Gao, Y.D. Wang, et al., Molecules 27 (2022) 21.
C. Yu, H.J. Chen, H.Y. Liu, et al., Nano Today 59 (2024) 102527. doi: 10.1016/j.nantod.2024.102527
D.Y. Jin, P. Xi, B.M. Wang, et al., Nat. Methods 15 (2018) 415–423. doi: 10.1038/s41592-018-0012-4
H.Y. Liu, Z.G. Wang, S.L. Liu, D.W. Pang, Nat. Protoc. 18 (2023) 458–489. doi: 10.1038/s41596-022-00775-7
M. Xie, K. Luo, B.H. Huang, et al., Biomaterials 31 (2010) 8362–8370. doi: 10.1016/j.biomaterials.2010.07.063
S.L. Liu, Z.L. Zhang, Z.Q. Tian, et al., ACS Nano 6 (2012) 141–150. doi: 10.1021/nn2031353
M. Bally, S. Block, F. Höök, et al., Anal. Bioanal. Chem. 413 (2021) 7157–7178. doi: 10.1007/s00216-021-03510-5
P. Gao, Z. Xie, M. Zheng, Chin. Chem. Lett. 33 (2022) 1659–1672. doi: 10.1016/j.cclet.2021.09.085
Y.Q. Li, P.X. Ma, Q. Tao, et al., Sens. Actuator B: Chem. 337 (2021) 129786. doi: 10.1016/j.snb.2021.129786
Y.X. Xue, C.C. Liu, G. Andrews, J.Y. Wang, Y. Ge, Nano Converg. 9 (2022) 15. doi: 10.1186/s40580-022-00307-9
G.J. Pang, Y.Y. Zhang, X.Y. Wang, et al., Nano Today 40 (2021) 101264. doi: 10.1016/j.nantod.2021.101264
Y. Ning, L. Wei, S. Lin, et al., Chin. Chem. Lett. 33 (2022) 4710–4714. doi: 10.1016/j.cclet.2021.12.084
S. Shen, W. Xu, J. Lu, et al., Chin. Chem. Lett. 35 (2024) 108360. doi: 10.1016/j.cclet.2023.108360
U.F. Greber, M. Way, Cell 124 (2006) 741–754. doi: 10.1016/j.cell.2006.02.018
Q. Li, W. Yin, W. Li, et al., Nano Lett. 18 (2018) 7457–7468. doi: 10.1021/acs.nanolett.8b02800
Y.Z. Liu, X.P. Lü, Z.X. Pan, et al., Chin. Med. J. 126 (2013) 3344–3347. doi: 10.3760/cma.j.issn.0366-6999.20130461
W. Wang, X. Ai, STAR Protoc. 2 (2021) 100756. doi: 10.1016/j.xpro.2021.100756
Q.R. Zhang, F.L. Tian, F. Wang, et al., ACS Nano 14 (2020) 7046–7054. doi: 10.1021/acsnano.0c01739
S.C. Weaver, C. Charlier, N. Vasilakis, M. Lecuit, Annu. Rev. Med. 69 (2018) 395–408. doi: 10.1146/annurev-med-050715-105122
Y.R. Guo, Q.D. Cao, Z.S. Hong, et al., Mil. Med. Res. 7 (2020) 11.
D. Primorac, K. Vrdoljak, P. Brlek, et al., Immunology 13 (2022) 848582.
M.Z.M. Zheng, L.M. Wakim, Mucosal Immunol. 15 (2022) 379–388. doi: 10.1038/s41385-021-00461-z
S.P. Nobs, A.A. Kolodziejczyk, L. Adler, et al., Nature 532 (2016) 512–516. doi: 10.1038/nature17655
R.J. Platt, S.D. Chen, Y. Zhou, et al., Cell 159 (2014) 440–455. doi: 10.1016/j.cell.2014.09.014
N. Liu, E.N. Olson, Circ. Res. 130 (2022) 1827–1850. doi: 10.1161/circresaha.122.320496
S.A. Chen, S. Sun, D. Moonen, et al., Cell Rep. 27 (2019) 3780–3789. doi: 10.1016/j.celrep.2019.05.103
X. Li, W. Yin, A. Li, et al., J. Med. Virol. 95 (2023) e28470. doi: 10.1002/jmv.28470
J.R. Spengler, J. Prescott, H. Feldmann, C.F. Spiropoulou, Curr. Opin. Virol. 25 (2017) 90–96. doi: 10.1016/j.coviro.2017.07.028
W.H. Yu, J.B. Wang, Y. Yang, et al., J. Med. Virol. 95 (2023) e28846. doi: 10.1002/jmv.28846
A. Vucetic, A. Lafleur, M. Côté, et al., Front. Cell. Infect. Microbiol. 13 (2023) 1275277. doi: 10.3389/fcimb.2023.1275277
L. Wang, L. Liu, L. Wang, Rev. Med. Virol. 28 (2018) e1961. doi: 10.1002/rmv.1961
K.K. Patel, T. Strive, R.N. Hall, et al., Transbound. Emerg. Dis. 69 (2022) e1959–e1971.
R. Tangwangvivat, S. Chaiyawong, N. Nonthabenjawan, et al., Virol. J. 19 (2022) 162. doi: 10.1186/s12985-022-01888-x
K.S. Hwang, E.U. Seo, N. Choi, J. Kim, H.N. Kim, Bioact. Mater. 21 (2023) 576–594.
R. Bhowmick, T. Derakhshan, Y. Liang, et al., Tissue Eng. Part A 24 (2018) 1468–1480. doi: 10.1089/ten.tea.2017.0449
X.L. Zhu, X.T. Ding, SLAS Discov. 22 (2017) 626–634. doi: 10.1177/2472555217701247
R. Plebani, H.Q. Bai, L.L. Si, et al., Int. J. Mol. Sci. 23 (2022) 10071. doi: 10.3390/ijms231710071
Y. Wang, H. Wang, P. Deng, et al., Lab Chip 18 (2018) 3606–3616. doi: 10.1039/c8lc00869h
P. Wang, L. Jin, M. Zhang, et al., Nat. Biomed. Eng. 8 (2024) 1053–1068.
S. Satta, S.J. Rockwood, K.D. Wang, et al., Circ. Res. 132 (2023) 1405–1424. doi: 10.1161/circresaha.122.321877
A. Fedi, C. Vitale, P. Giannoni, G. Caluori, A. Marrella, Sensors 22 (2022) 1517. doi: 10.3390/s22041517
S. Maji, H. Lee, Int. J. Mol. Sci. 23 (2022) 2662. doi: 10.3390/ijms23052662
P.Q. Ma, Y. Chen, X.Y. Lai, et al., Macromol. Biosci. 21 (2021) e2100191. doi: 10.1002/mabi.202100191
H. Liu, Y. Wang, K. Cui, et al., Adv. Mater. 31 (2019) e1902042. doi: 10.1002/adma.201902042
T. Do, L. Synan, G. Ali, H. Gappa-Fahlenkamp, Stem Cell Res. Ther. 13 (2022) 464. doi: 10.1186/s13287-022-03134-1
A. Imle, P. Kumberger, N.D. Schnellbächer, et al., Nat. Commun. 10 (2019) 2144. doi: 10.1038/s41467-019-09879-3
D.A. Ferreira, M. Rothbauer, J.P. Conde, et al., Adv. Sci. 8 (2021) 2003273. doi: 10.1002/advs.202003273
K. Gold, A.K. Gaharwar, A. Jain, Biomaterials 196 (2019) 2–17. doi: 10.1016/j.biomaterials.2018.07.029
Y.S. Zhang, A. Arneri, S. Bersini, et al., Biomaterials 110 (2016) 45–59. doi: 10.1016/j.biomaterials.2016.09.003
S.L. Mi, Z.C. Du, Y.Y. Xu, W. Sun, J. Mater. Chem. B 6 (2018) 6191–6206. doi: 10.1039/c8tb01661e
J. Yu, S. Lee, J. Song, et al., Nano Converg. 9 (2022) 16. doi: 10.21037/acr-21-70
S. Lee, J. Lim, J. Yu, et al., Lab Chip 19 (2019) 2071–2080. doi: 10.1039/c9lc00148d
K. Ronaldson-Bouchard, D. Teles, K. Yeager, et al., Nat. Biomed. Eng. 6 (2022) 351–371. doi: 10.1038/s41551-022-00882-6
F.F. Wu, D. Wu, Y. Ren, et al., J. Hepatol. 70 (2019) 1145–1158. doi: 10.1016/j.jhep.2018.12.028
B. Gabbin, V. Meraviglia, M.L. Angenent, et al., Mater. Today Bio 23 (2023) 100818. doi: 10.1016/j.mtbio.2023.100818
M.J. Rupar, T. Sasserath, E. Smith, et al., Sci. Rep. 13 (2023) 10509. doi: 10.1038/s41598-023-35694-4
G.D. Vatine, R. Barrile, M.J. Workman, et al., Cell Stem Cell 24 (2019) 995–1005. doi: 10.1016/j.stem.2019.05.011
M. Zhang, P. Wang, R. Luo, et al., Adv. Sci. 8 (2020) 14. doi: 10.1182/blood-2020-134350
C. Günther, B. Winner, M.F. Neurath, T.S. Stappenbeck, Gut 71 (2022) 1892–1908. doi: 10.1136/gutjnl-2021-326560
M. Poletti, K. Arnauts, M. Ferrante, T. Korcsmaros, J. Crohns Colitis 15 (2021) 1222–1235. doi: 10.1093/ecco-jcc/jjaa257
V. Veninga, E.E. Voest, Cancer Cell 39 (2021) 1190–1201. doi: 10.1016/j.ccell.2021.07.020
X.Y. Tang, S.S. Wu, D. Wang, et al., Signal Transduct. Target. Ther. 7 (2022) 168. doi: 10.1038/s41392-022-01024-9
J. Tanaka, H. Senpuku, M. Ogawa, et al., Nat. Cell Biol. 25 (2023) 508. doi: 10.1038/s41556-023-01107-x
H.X. Xu, D.C. Jiao, A.G. Liu, K.M. Wu, J. Hematol. Oncol. 15 (2022) 58. doi: 10.3390/infrastructures7040058
K. Salewskij, J.M. Penninger, Circ. Res. 132 (2023) 498–510. doi: 10.1161/circresaha.122.321768
X.M. Tang, D.X. Xue, T. Zhang, et al., Nat. Cell Biol. 25 (2023) 381–389. doi: 10.1038/s41556-023-01095-y
C.T. Ekanger, F. Zhou, D. Bohan, et al., Front. Cell. Infect. Microbiol. 12 (2022) 1–23.
C. Wang, J. Wang, D. Liu, Z.L. Zhang, Chin. Chem. Lett. 35 (2024) 110302. doi: 10.1016/j.cclet.2024.110302
R. Nishinakamura, Cell Stem Cell 30 (2023) 1017–1027. doi: 10.1016/j.stem.2023.07.011
H. Wang, X.F. Ning, F. Zhao, H. Zhao, D. Li, Theranostics 14 (2024) 788–818. doi: 10.7150/thno.90492
Y.P. Zhang, Z.G. Wang, Y.F. Tian, et al., Angew. Chem. Int. Ed. 62 (2023) e202217230. doi: 10.1002/anie.202217230
H.Y. Liu, Y.S. Hu, C. Yu, et al., Sci. Bull. 69 (2024) 502–511. doi: 10.1016/j.scib.2023.11.020
S. Murali, R.R. Rustandi, X.W. Zheng, A. Payne, L. Shang, Viruses 14 (2022) 717. doi: 10.3390/v14040717
C.F. Soon, S.H. Zhang, P.V. Suneetha, et al., Front. Immunol. 10 (2019) 2076. doi: 10.3389/fimmu.2019.02076
Y.S. Wan, J. Shang, R. Graham, R.S. Baric, F. Li, J. Virol. 94 (2020) e00127-20. doi: 10.1128/JVI.00127-20
N.L. Meyer, M.S. Chapman, Trends Microbiol. 30 (2022) 432–451. doi: 10.1016/j.tim.2021.09.005
P.G. Spear, R.J. Eisenberg, G.H. Cohen, Virology 275 (2000) 1–8.
J. Shang, Y.S. Wan, C.M. Luo, et al., Proc. Natl. Acad. Sci. U. S. A. 117 (2020) 11727–11734. doi: 10.1073/pnas.2003138117
S. Boersma, H.H. Rabouw, L.J.M. Bruurs, et al., Cell 183 (2020) 1930–1945. doi: 10.1016/j.cell.2020.10.019
J. Liu, M.Y. Xu, B. Tang, et al., Small 15 (2019) e1803788. doi: 10.1002/smll.201803788
N. Arhel, A. Genovesio, K.A. Kim, et al., Nat. Methods 3 (2006) 817–824. doi: 10.1038/nmeth928
X.H. Dong, H. Li, A. Derdowski, et al., Cell 120 (2005) 663–674. doi: 10.1016/j.cell.2004.12.023
M.J. Lehmann, N.M. Sherer, C.B. Marks, M. Pypaert, W. Mothes, J. Cell Biol. 170 (2005) 317–325. doi: 10.1083/jcb.200503059
D. Chen, Q.X. Zheng, L. Sun, et al., Dev. Cell 56 (2021) 3250–3263. doi: 10.1016/j.devcel.2021.10.006
Y.T. Liu, S. Shivakoti, F. Jia, et al., Cell Discov. 6 (2020) 2.
G. Wang, D. Zhang, R. Orchard, D.C. Hancks, T.A. Reese, Nature 616 (2023) 152–158. doi: 10.1038/s41586-023-05851-w
J. Moshiri, A.R. Craven, S.B. Mixon, M.R. Amieva, K. Kirkegaard, Nat. Microbiol. 8 (2023) 629–639. doi: 10.1038/s41564-023-01339-5
D. Choi, E. Park, K.E. Kim, et al., Cancer Res. 80 (2020) 3130–3144. doi: 10.1158/0008-5472.can-19-3105
E. Morita, W.I. Sundquist, Annu. Rev. Cell Dev. Biol. 20 (2004) 395–425. doi: 10.1146/annurev.cellbio.20.010403.102350
A.L. Pinto, R.K. Rai, J.C. Brown, et al., Nat. Commun. 13 (2022) 1609. doi: 10.1038/s41467-022-29255-y
L.J. Wu, D.N. Jin, D. Wang, et al., Protein Cell 13 (2022) 120–140. doi: 10.1007/s13238-020-00764-0
S.W. Yoo, A.A. Waheed, P. Deme, et al., Proc. Natl. Acad. Sci. U. S. A. 120 (2023) e2219543120. doi: 10.1073/pnas.2219543120
M. Perlman, M.D. Resh, Traffic 7 (2006) 731–745. doi: 10.1111/j.1398-9219.2006.00428.x
X. Sewald, N. Motamedi, W. Mothes, Curr. Opin. Cell Biol. 41 (2016) 81–90. doi: 10.1016/j.ceb.2016.04.008
S.A.J. Guagliardo, T. Smith, D.H. Hamer, et al., Emerg. Infect. Dis 30 (2024) 2381–2384.
T. Wang, P.H. Li, Y. Zhang, et al., Theranostics 10 (2020) 6430–6447. doi: 10.7150/thno.43177
I. Ullah, J. Prevost, M.S. Ladinsky, et al., Immunity 54 (2021) 2143–2158. doi: 10.1016/j.immuni.2021.08.015
J.A. Pulit-Penaloza, N. Brock, J.A. Belser, et al., Emerg. Microbes Infect. 13 (2024) 2332667. doi: 10.1080/22221751.2024.2332667
J.H. Kwon, K. Bertran, D.H. Lee, et al., Emerg. Microbes Infect. 12 (2023) 2218945. doi: 10.1080/22221751.2023.2218945
A.X. Han, S.P.J. de Jong, C.A. Russell, Nat. Rev. Microbiol. 21 (2023) 805–817. doi: 10.1038/s41579-023-00945-8
H. Pan, W.J. Li, X.J. Yao, et al., Small 13 (2017) 1604036. doi: 10.1002/smll.201604036
U.M. Ashraf, A.A. Abokor, J.M. Edwards, et al., Physiol. Genom. 53 (2021) 51–60. doi: 10.1152/physiolgenomics.00087.2020
E. Mitsi, M.O. Diniz, J. Reiné, et al., Nat. Commun. 14 (2023) 6815. doi: 10.1038/s41467-023-42433-w
C.G. Wang, S.J. Liu, C.Y. Li, et al., ACS Appl. Mater. Interfaces 16 (2024) 60045–60055. doi: 10.1021/acsami.4c15125
A.A. Salahudeen, S.S. Choi, A. Rustagi, et al., Nature 588 (2020) 670–675. doi: 10.1038/s41586-020-3014-1
S. Herfst, M. Imai, Y. Kawaoka, R.A.M. Fouchier, Curr. Top. Microbiol. Immunol. 385 (2014) 137–155. doi: 10.1007/82_2014_387
C.C. Wang, K.A. Prather, J. Sznitman, et al., Science 373 (2021) eabd9149. doi: 10.1126/science.abd9149
Q. Chen, Y.Y. Liu, J.P. Ren, et al., eLife 10 (2021) e64603. doi: 10.7554/eLife.64603
X. Jiang, X. Meng, Q. Hu, et al., Chin. J. Zoonoses 34 (2018) 558–562. doi: 10.3390/en11030558
Y.Z. Liu, S. Maya, A. Ploss, Viruses 13 (2021) 777. doi: 10.3390/v13050777
K. Shifflett, A. Marzi, Virol. J. 16 (2019) 165. doi: 10.1186/s12985-019-1272-z
G. Forlani, M. Shallak, R.S. Accolla, M.G. Romanelli, Int. J. Mol. Sci. 22 (2021) 8001. doi: 10.3390/ijms22158001
J. Geiser, G. Boivin, S. Huang, et al., Viruses 13 (2021) 139. doi: 10.3390/v13010139

Figure 1 Schematic diagram of the virus infection models and dynamic tracking on the models.

Figure 2 Analysis of single HIV-1 fusion events. (A) Schematic illustration of the strategy employed to distinguish the potential HIV-1 fusion sites within cells. (B) Examples demonstrating the fusion of HIV-1 JRFL Env pseudo-virus with pH-neutral endocytic vesicles or the plasma membrane of TZM-bl cells. Reproduced with permission [27]. Copyright 2023, American Chemical Society.

Figure 3 Representative image of Dendra2-HA (green) of IBV and PAmKate-PH (magenta) in fixed NIH-3T3 cell. Reproduced with permission [32]. Copyright 2024, Elsevier.

Figure 4 Schematic diagram of design and working principle of DVMP. (A) Clarification fluorescence response of a DTMB to vRNA and APE1. (B) The production process of DVMP. (C) Schematic diagram of DVMP working mechanism. Reproduced with permission [54]. Copyright 2024, Elsevier.

Figure 5 Virus labeling and tracking with QDs. (A) Microscope images and quantitative analysis of QDs-labeled PrPC. Reproduced with permission [56]. Copyright 2010, Elsevier. (B) Fluorescence images of QD-labeled influenza viruses (green), co-localizing with immunofluorescence labeled HA (red) in host cells. Reproduced with permission [58]. Copyright 2012, American Chemical Society. (C) Fluorescence images of QD-labeled influenza viruses (red) in MDCK cells expressing GFP-tagged microtubules (green) (scale bar: 20 µm). The white circle indicates the MTOC. Reproduced with permission [57]. Copyright 2012, American Chemical Society.

Figure 6 3D engineered tissue models. (A) Schematic diagram of 3D in vitro lung tissue models constructed using a gel scaffold. Reproduced with permission [97]. Copyright 2022, Springer. (B) Schematic diagram of a lung organ-on-a-chip. Reproduced with permission [110]. Copyright 2020, Wiley. (C) Representative images of BRON and ALV 3D organoids. Magnification, 4×left, 10×middle and 20×right. Scale bar: 250 µm. Reproduced with permission [119]. Copyright 2022, Frontiers. (D) HE stained sections of BRON organoids (arrows, ciliated cells). Scale bar: 100 µm (left) and 50 µm (right, zoomed inserts). Reproduced with permission [119]. Copyright 2022, Frontiers. (E) HE stained sections of ALV airway organoids (arrows, thin-walled cells with AT1 morphology). Scale bar: 100 µm. Reproduced with permission [119]. Copyright 2022, Frontiers.

Figure 7 Schematic diagram of the infection and spread of the virus infection in and between cells.

Figure 8 Dynamic tracking of virus entry pathway. (A) SFTSV (red) recruits clathrin (green) to the plasma membrane, forming CCVs (white arrows). (B) SFTSV is internalized via clathrin reorganization (white arrow indicates CCVs) (0–124.1 s). (C) SFTSV (red) moves along actin filaments at the cell periphery (0–390 s). (D) SFTSV (red) is transported along microtubules (green) in the cell interior. Reproduced with permission [132]. Copyright 2019, Wiley.

Figure 9 Schematic diagram of the spread of the virus between different organs in the body.

Figure 10 In situ tracking virus infection by in vivo biological orthogonal reaction. (A) Schematic illustration of the virus labeling and dynamic tracking in vivo. (B) In vivo imaging of mice infected by H5N1p with different labeling strategies from 12 h to 48 h post infection by in vivo imaging system. Reproduced with permission [153]. Copyright 2017, Wiley.

Figure 11 Representative images from temporal bioluminescence imaging (BLI) of SARS-CoV-2-Nluc-infected mice in ventral (v) and dorsal (d) positions at the indicated dpi and after necropsy. Reproduced with permission [149]. Copyright 2021, Cell Press.

Figure 12 Schematic summary of H9N2 virus-induced PF in the human alveolus chip. Reproduced with permission [156]. Copyright 2024, American Chemical Society.

 扫一扫看文章

扫一扫关注我们
 DownLoad:
 下载:
下载:

 下载:
下载: