Scheme 1.
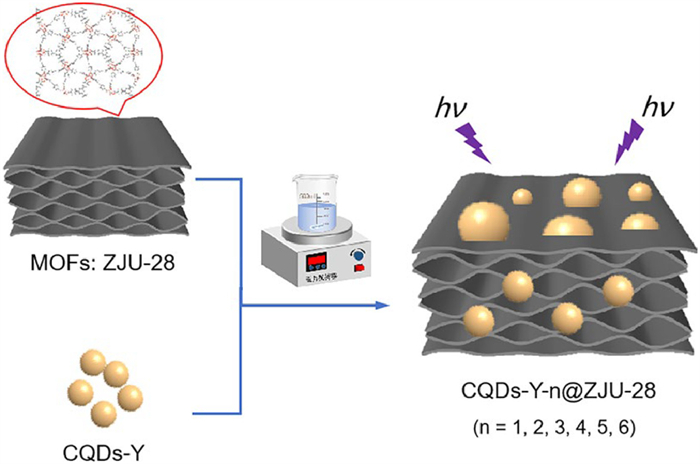
Schematic illustration of the synthesis of CQDs-Y-n@ZJU-28 composite using ZJU-28 and CQDs-Y.
Metal-organic framework supported carbon quantum dots as white light-emitting phosphor
Xinbao Tong , Jiaying Liu , Yanqi Zhao , Jingjun Li , Ye Tian , Qingyi Liu , Shuiying Gao , Rong Cao

The evolution of white light-emitting diode (WLED) technology has gained significant attention due to the growing demand for energy-efficient and eco-friendly lighting. Traditionally, WLEDs use phosphor materials that absorb blue light from an LED chip and emit it in visible spectrum. However, these devices often depend on rare earth elements [1-3], such as yttrium-based phosphors, which face challenges including high cost, scarcity, environmental concerns, and poor stability [4-6]. Carbon quantum dots (CQDs), zero-dimensional nanomaterials with unique properties like small size, excellent biocompatibility, and easy synthesis, present a promising alternative [7-9]. Their remarkable fluorescence properties, high quantum efficiency, tunable emission wavelengths, and superior color saturation make them ideal candidates for LED-based luminescent materials [10-12]. However, the aggregation-induced quenching (AIQ) effect in solid CQDs, caused primarily by intermolecular π-π interactions and resonance energy transfer (RET), significantly reduces their fluorescence efficiency [10,13-16]. In the liquid state, wavelength-dependent photoluminescence leads to instability and a broad emission spectrum, which hinders their use in WLEDs.
To address these challenges, a promising approach involves developing CQDs-based composite materials that embed CQDs within stable frameworks, creating host-guest relationships. Among these, the exploration of CQDs-composited luminescent metal-organic frameworks (LMOFs) has gained traction in recent years and has shown significant progress [17-22]. In such systems, CQDs are incorporated into crystalline, porous metal-organic framework (MOF) by electrostatic attraction or embedding [23,24], preventing AIQ and preserving their fluorescent properties [25-28]. This approach facilitates the introduction of multiple tunable emission centers, resulting in high-performance multi-emission systems [29-31]. By overlapping emission spectra, these composites can even emit a wide range of colors, enabling the creation of white light. For instance, Youngme et al. incorporated blue-emitting carbon dots (CDs) into lanthanide-based MOFs, where halide ions were used as co-doped metal centers [32]. The resulting CD-3@Ln-MOF emitted white light upon excitation at 370 nm, although it had a modest quantum yield of 9%. In a similar vein, Wang et al. synthesized CDs/Zr-MOF using citric acid-derived CDs and Zr-MOF, achieving multi-hued white light and single-wavelength-emitting LEDs with enhanced emission control [33]. These studies have successfully demonstrated the feasibility of utilizing CQDs-composited LMOFs for controlling white light emission [20,34]. However, the potential for further enhancing and diversifying their functionality remains, with more advanced synthetic designs expected to extend and refine the capabilities of CQDs-based materials.
In this study, we proposed using electrostatic interactions to create novel CQDs-composited LMOFs (CQDs-Y-n@ZJU-28) for variable temperature fluorescence and white light emission (Scheme 1). Yellow-fluorescent, positively charged CQDs were synthesized and subsequently adsorbed onto the negatively charged sites of the anionic MOF, ZJU-28. The channels of ZJU-28 were filled with Me2NH2+ cations to stabilize the CQDs-Y. When the CQD-Y are adsorbed or embedded into MOF framework, they interact with the cations, improving attachment and reducing AIQ, thereby enhancing both stability and fluorescence emission. To achieve white light emission, we loaded yellow quantum dots (CQDs-Y) into the blue ZJU-28, constructed through the utilization of the In3+ metal connectors and the bridging ligand of 1,3,5-tris(4-carboxyphenyl)benzene (H3BTB), assembling to the composite material CQDs-Y-n@ZJU-28. Upon excitation at 365 nm with an LED chip, the CQDs-Y-n@ZJU-28 composite material emits bright white light. Detailed investigations have confirmed that the successful construction of WLED phosphor with excellent thermal stability and chemical stability, and its luminescence has notably maintained for several months. Furthermore, the emitted light exhibits minimal variations in white light within the temperature range of 277–437 K, remaining within the white light region.
ZJU-28 was synthesized according to a previous strategy (Scheme S1 in Supporting information) [14] and it exhibited a blue fluorescence upon excitation at 365 nm UV light (Fig. S1 in Supporting information). The synthesis of yellow-fluorescent carbon quantum dots (CQDs-Y) was achieved through a fluorine (F)-doping strategy (Fig. 1a). Initially, we optimized the synthetic conditions for green-fluorescent CQDs (denoted as CQDs-G), which were derived from terephthalic acid and m-phenyl dimethylamine precursors via a hydrothermal method at 180 ℃ (Scheme S2 in Supporting information). To further tune the fluorescence property, 3-fluoroaniline was introduced as a doping agent for modulation (Fig. 1a and Scheme S3 in Supporting information). The solution color of CQDs-Y was observed with a shift from yellow-green to brownish-yellow under ambient light, in contrast to CQDs-G. Under 365 nm UV light, the fluorescence of CQDs-Y exhibited a shift from green to yellow, a red shift attributed to F-doping (Fig. 1a and Fig. S2 in Supporting information). The high electronegativity of the fluorine atom and the polarization of the C-F bond modify the surface of CQDs, resulting in a longer emission wavelength for F-doped CQDs-Y compared to CQDs-G. Moreover, the CQDs-Y remained stable after F doping, preserving the bright yellow fluorescence for up to 20 months.
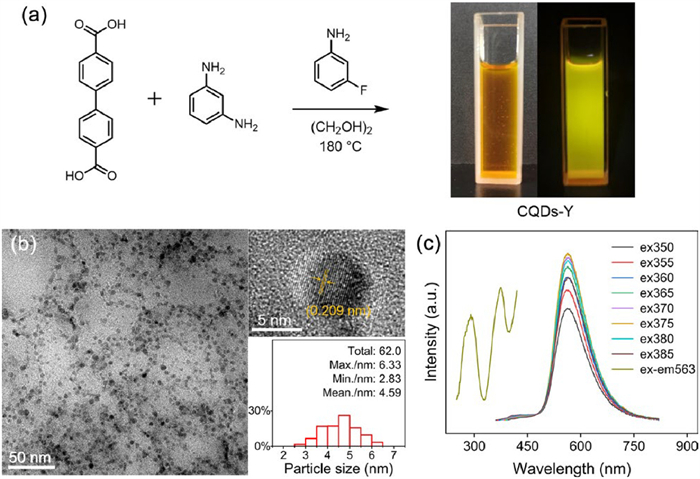
To further confirm the success synthesis of yellow-fluorescent CQDs-Y, we investigated its morphology and structure using transmission electron microscopy (TEM) and fluorescence (FL) emission spectroscopy. As shown in Fig. 1b, the TEM image revealed a predominantly spherical shape of CQDs-Y, with no visible aggregation. High-resolution TEM (HR-TEM) images further demonstrate the high crystallinity of CQDs-Y, with an interplanar spacing of approximately 2.1 Å. The average particle size of CQDs-Y was measured to be 4.59 nm, providing strong evidence for the successful synthesis of CQDs-Y. In comparison, the TEM image of CQDs-G shows an average particle size of 3.77 nm (Fig. S3 in Supporting information), suggesting that the particle size influenced the emission wavelength of CQDs-Y, with larger particles typically leading to redshifted emission.
Benefiting from their nanoscale size, both CQDs-Y and CQDs-G demonstrated excellent solubility. We thus investigated the FL emission spectra of these two CQDs dispersed in ethanol under various excitation wavelengths. Notably, upon UV excitation at 350 nm, CQDs-Y exhibited a broad yellow emission band centered at 564 nm (Fig. 1c). As the excitation wavelength increased from 350 nm to 385 nm, the FL intensity gradually increased, while the emission peak remained at 564 ± 2 nm, without noticeable shifts. The highest FL intensity of CQDs-Y was observed at 375 nm excitation, suggesting the absence of excitation-dependent photoluminescence behavior, which is common in previous CQDs reports. Additionally, CQDs-G exhibited a comparable emission centered at 525 nm (Fig. S4 in Supporting information), showing similar wavelength-independent fluorescence characteristics.
The CQDs-based LMOF composites (CQDs-Y-n@ZJU-28) were synthesized under mild conditions with low-speed stirring at room temperature. Electrostatic interactions between the positively charged CQDs-Y and negatively charged ZJU-28 facilitated the efficient formation of CQDs-Y-n@ZJU-28 (n = 1, 2, 3, 4, 5, 6), where n represents the varying quantities of CQDs-Y. The spontaneous electrostatic interactions ensure strong integration, making the process simple and effective.
To verify the successful incorporation of CQDs-Y into ZJU-28, the CQDs-Y-n@ZJU-28 composites were analyzed using Fourier transform infrared (FT-IR) spectroscopy and X-ray diffraction (XRD) patterns. The FT-IR spectra shows that the characteristic peak intensities of CQDs-Y-4@ZJU-28 are similar to those of ZJU-28, suggesting that the fundamental functional groups of ZJU-28 remain intact within the CQDs-Y-4@ZJU-28 (Fig. 2a). The powder XRD patterns (Fig. S5 in Supporting information) reveal that CQDs-Y-n@ZJU-28 exhibits diffraction peaks similar to those of ZJU-28. However, a shift in the diffraction peaks was observed with increasing the CQDs-Y content in CQDs-Y-n@ZJU-28. This shift suggests that the electrostatic interactions between CQDs-Y and ZJU-28 are stronger as the increase of CQDs-Y concentration. Furthermore, the incorporation of CQDs-Y appears to influence the crystalline structure of ZJU-28. Although a high content of CQDs-Y may slightly disrupt the crystal lattice, the overall structure of ZJU-28 remains intact, confirming the successful synthesis of the CQDs-Y-n@ZJU-28 composites.
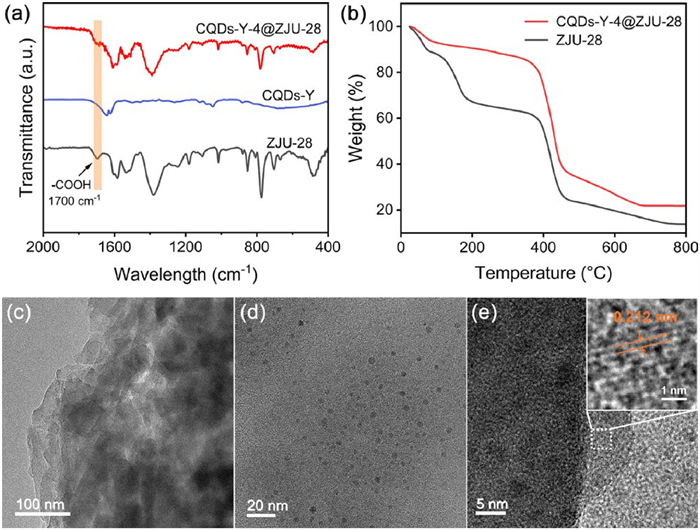
In order to investigate the thermal stability of CQDs-Y@ZJU-28 composite, thermogravimetric analysis (TG) of ZJU-28 and CQDs-Y-4@ZJU-28 was performed under nitrogen atmosphere (Fig. 2b). The results show that the initial-stage degradation of ZJU-28 and CQDs-Y-4@ZJU-28 occurs within the temperature range of 150–400 ℃. The CQDs-Y-4@ZJU-28 exhibits a weight reduction of approximately 18%, primarily stemming from the elimination of residual solvent and the decomposition of amide groups. Remarkably, this value is lower than the substantial 40% weight loss that observed in ZJU-28. The TG curves of both ZJU-28 and CQDs-Y-4@ZJU-28 manifest a precipitous decline at 400 ℃, signifying the disintegration of MOF framework. Within the temperature interval of 400–800 ℃, the CQDs-Y-4@ZJU-28 solely undergoes a modest weight reduction of 15%, thereby retaining a solid residue of 21%, surpassing the mere 13% of ZJU-28. These findings indicates that the incorporation of CQDs-Y into the ZJU-28 structure endows CQDs-Y-4@ZJU-28 with enhanced thermal stability.
TEM images elucidated that CQDs-Y effectively functionalize the surface of ZJU-28 (Fig. S6 in Supporting information) without experiencing any aggregation, both at the 100 nm and 20 nm scales (Figs. 2c and d). The interaction between the unbound carboxyl groups of ZJU-28 and the hydroxyl groups present on the surface of CQDs-Y signifies the presence of highly monodisperse CQDs-Y within CQDs-Y-4@ZJU-28. Considering that the pore size of ZJU-28 in the c-axis direction is <1 nm, it can be inferred that a majority of the CQDs bind to accessible sites on the surface of ZJU-28. HR-TEM images provide compelling evidence of the successful and uniform incorporation of CQDs-Y into the MOF structure (Fig. 2e). Furthermore, the interplanar crystal spacing of CQDs-Y within the composite material measures approximately 2 Å, consistent with that of individual CQDs-Y.
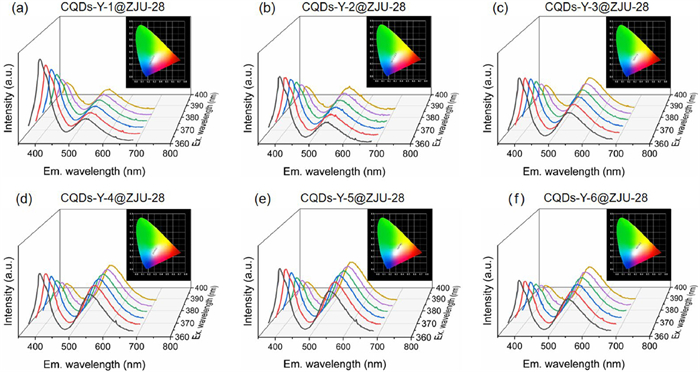
ZJU-28 and CQDs-Y exhibit distinctive emission peaks centered at approximately 390 nm (Fig. S7 in Supporting information) and 564 nm (Fig. 1c), respectively, when subjected to various excitation wavelengths. Moreover, the emission properties of CQDs-Y show negligible dependence on the excitation wavelength. Consequently, the near-white fluorescence of the composite materials originates from the combined emission of both ZJU-28 and CQDs-Y, with CQDs-Y’s fluorescence properties impeccably preserved after integration into ZJU-28. The relative proportion of yellow and blue light within the composite material significantly influences the intensity and tonality of the resulting white light. Hence, in order to achieve an optimum ratio, the emission intensities of CQDs-Y and ZJU-28 are carefully considered to ensure their harmonious overlap and the production of a desirable white light. For this purpose, a series of composite materials were subjected to fluorescence emission spectra measurements under various excitation wavelengths, accompanied by the corresponding CIE coordinates for comprehensive evaluation [35]. As illustrated in Fig. 3, when the quantum dot concentration is kept constant, the relative intensity of the emission peak corresponding to ZJU-28 at 400 nm gradually decreases as the excitation wavelength increases by 5 nm within the range of 360–385 nm. The CIE coordinates further corroborate this phenomenon by exhibiting a progressive shift towards the yellow region, signifying the transition of the composite material powder’s fluorescence color towards orange. This coordinated migration of points on the CIE diagram becomes particularly conspicuous in the interactive display of Figs. 3a–f, effectively exemplifying the gradual displacement of the coordinates towards the yellow region. The migration process of the coordinates on the CIE diagram, provides compelling evidence of the composite material powder’s fluorescence color transitioning from blue to white, and subsequently to yellow, as the quantum dot content is augmented. To provide a more intuitive observation of this phenomenon, the spectra of CQDs-Y-n@ ZJU-28 at 365 nm excitation wavelength are summarized in Fig. S8a (Supporting information). The CIE coordinates transitions strongly demonstrate that as the quantum dot content increases, the fluorescence color shifts from blue to white, and then to yellow (Fig. S8b in Supporting information). Notably, CQDs-Y-4@ZJU-28 emits nearly ideal white light, with CIE coordinates of (0.3277, 0.3281), which closely match the ideal white light coordinates of (0.33, 0.33). This highlights the potential of CQDs-Y-n@ ZJU-28 for lighting applications and its tunable properties. The intricate network of channels and voids within ZJU-28 is occupied by a substantial quantity of exceedingly disordered solvent molecules and Me2NH2+ cations, approximated to account for 64.7% of the entire volume. Corresponding to analogous investigations conducted on other anionic MOFs, the inherent Me2NH2+ cations exhibit strong electrostatic interactions. When quantum dots are adsorbed onto the surface of MOFs or partially embedded within their framework, their abundant reactive surface groups interact with these endogenous cations, leading to enhanced immobilization. As a result, this interaction effectively reduces the harmful aggregation-induced quenching effect that quantum dots often experience within MOFs.
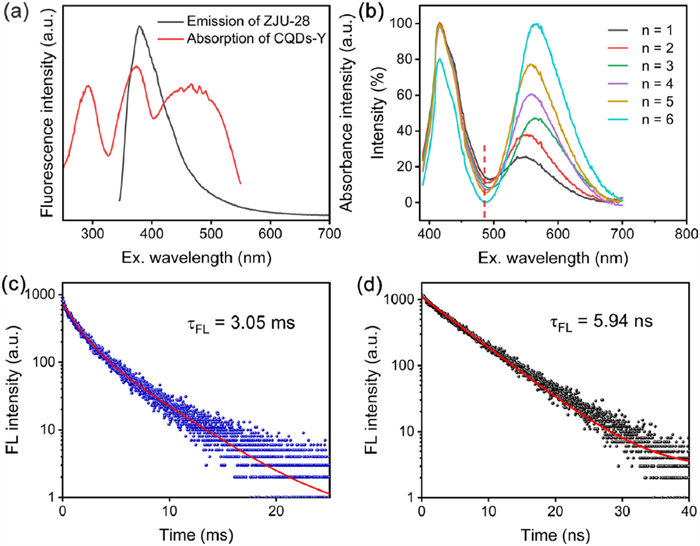
To investigate the mechanism by which CQDs-Y and ZJU-28- based LMOF composites regulate luminescence, the emission spectrum of ZJU-28 and the absorption spectrum of CQDs-Y were analyzed to determine the existence of compatible energy transfer between them (Fig. 4a). Evidently, a significant spectral overlap between the two is observed, resulting in independent energy absorption and excitation upon UV irradiation of the composite material. The MOF emits wavelengths within the absorption range of CQDs-Y, facilitating efficient energy transfer to CQDs-Y through the mechanism of Förster resonance energy transfer (FRET), consequently inducing secondary excitation. The amalgamation of yellow and blue fluorescence within the composite material gives rise to the manifestation of white fluorescence. This mechanism greatly enhances the efficiency and intensity of fluorescence, thereby augmenting the brilliance of the white light emission. The fluorescence emission spectra intensities of CQDs-Y-n@ZJU-28 with different contents of CQDs-Y were normalized under λ = 365 nm excitation (Fig. 4b), which presented that the relative intensity ratio between the emission peaks at 400 nm and 564 nm gradually decreased. Additionally, the emission intensity near 490 nm slightly decreased with increasing CQDs-Y content, indicating that FRET occurred within the system. The time-resolved fluorescence decay curves for CQDs-Y-n@ZJU-28 and CQDs-Y were measured under 365 nm excitation and 560 nm emission (Figs. 4c and d, Fig. S9 in Supporting information). Each decay curve was fitted with a logarithmic function to derive the average lifetime. The results showed that CQDs-Y had an average lifetime of 5.94 ns. In comparison, the CQDs-Y-n@ZJU-28 demonstrated signally longer lifetimes, ranging from 2 ms to 3.05 ms, with CQDs-Y-4@ZJU-28 exhibiting the longest lifetime of 3.05 ms. This increased fluorescence lifetime of CQDs-Y-n@ZJU-28 suggests a strong interaction between CQDs-Y and ZJU-28, further confirming the presence of FRET within the system.
Owing to the gradual elevation of temperature in LED chips during operation, potentially reaching up to 150 ℃, direct contact between phosphors and chips can induce heating. Consequently, the thermal stability and chemical stability of phosphors emerge as pivotal factors influencing the efficacy of white LED devices. Higher heat resistance correlates with enhanced longevity of WLED devices, underscoring the importance of stability in applications demanding prolonged usage, such as street lighting or automotive illumination systems. To demonstrate its thermal stability, a temperature-dependent analysis of the CQDs-Y-4@ZJU-28 composite material was conducted. The fluorescence spectra confirm that the color change of the composite, whether at ambient temperature or elevated temperatures (277–437 K), is consistently within the spectrum of white light (Fig. 5a). This corroborates its excellent thermal resistance, and as the temperature increases, the fluorescence emission peak intensity of the composite material at approximately 560 nm demonstrates a distinctly defined linear relationship (Fig. 5b).
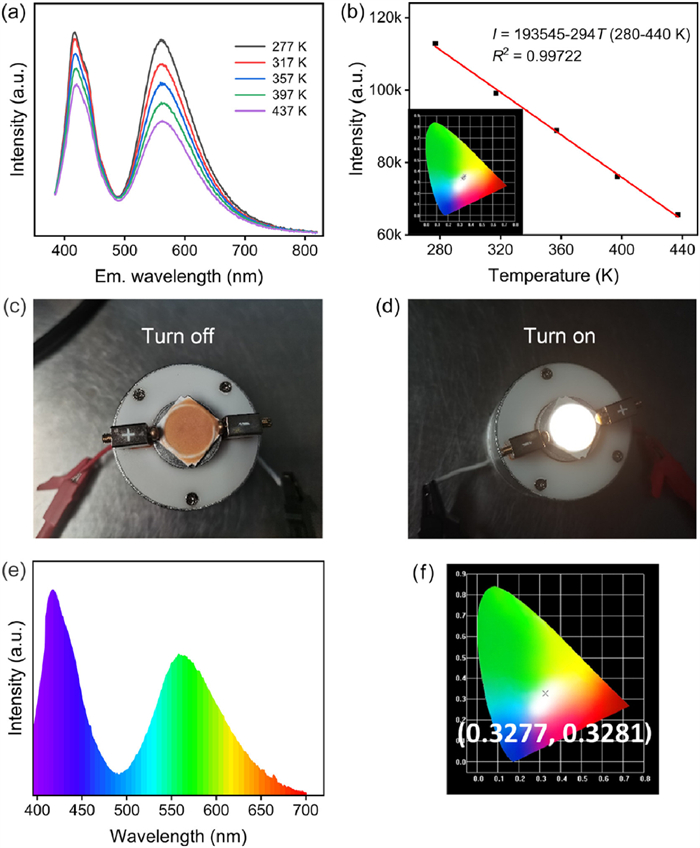
To evaluate the potential performance of CQDs-Y-n@ZJU-28 for LED applications, experiments were conducted to measure the internal quantum efficiency (IQE), external quantum efficiency (EQE), and absorption efficiency. As shown in Fig. S10 and Table S1 (Supporting information), CQDs-Y-4@ZJU-28 exhibited superior performance, with an IQE of 17.78%, an EQE of 8.85%, and an absorption efficiency of 49.8%. These results highlight the high photoelectric conversion efficiency of CQDs-Y-n@ZJU-28, making it a promising candidate for LED applications. To further elucidate the practical applications of CQDs-Y-4@ZJU-28 composite materials as a white light-emitting substance, we meticulously coated the composite powder onto the surface of a chip (λex = 365 nm) using an adhesive and assembled a white light-emitting diode (Fig. 5c). When a voltage of 3 V was applied, the CQDs-Y-4@ZJU-28 were excited by the 365 nm wavelength, resulting in the emission of bright white light (Fig. 5d), alongside the corresponding fluorescence spectra (Fig. 5e) and CIE coordinates (Fig. 5f). These results indicate that CQDs-Y-4@ZJU-28 composite materials have the potential to function as a single-phase white light-emitting material. Furthermore, a comprehensive investigation revealed that the luminous efficacy of the white LED was 0.56 lm/W. Additionally, the color rendering index (CRI) of CQDs-Y-4@ZJU-28 was found to be 78, with a corresponding color temperature of 3384 K, signifying that it emits warm white light. Compared to reported WLED materials, CQDs-Y-4@ZJU-28 shows good performance (Table S2 in Supporting information). Additionally, photostability tests showed the luminescence intensity remained at 93% after 6 h of continuous exposure, indicating excellent photostability.
In summary, this study represents a significant progression in the domain of non-rare-earth white light materials by integrating luminescent metal-organic frameworks (LMOFs) with carbon quantum dots (CQDs) to fabricate the CQDs-Y-n@ZJU-28 composite material. Yellow carbon quantum dots (CQDs-Y) are incorporated into the blue-emitting LMOF ZJU-28 to produce the CQDs-Y-n@ZJU-28 composite, resulting in the invention of a novel WLED phosphor. Under 365 nm ultraviolet excitation, it emits warm white light characterized by coordinates (CIE: 0.3277, 0.3281). Furthermore, it exhibits tunable emission properties and remarkable LED performance, displaying a CRI of 78 and a correlated color temperature of 3384 K, along with EQE of 8.85%. Within a temperature range of 277–437 K, the emitted light experiences negligible color deviation at the white end of the spectrum, positioning it as a highly promising candidate for advanced WLED applications.
The authors declare that they have no known competing financial interests or personal relationships that could have appeared to influence the work reported in this paper.
Xinbao Tong: Writing – original draft, Methodology, Investigation, Formal analysis, Data curation. Jiaying Liu: Writing – original draft, Software, Investigation, Formal analysis. Yanqi Zhao: Investigation, Formal analysis. Jingjun Li: Methodology, Investigation. Ye Tian: Resources, Investigation. Qingyi Liu: Formal analysis. Shuiying Gao: Writing – review & editing, Investigation, Funding acquisition, Formal analysis, Conceptualization. Rong Cao: Writing – review & editing, Project administration, Funding acquisition, Conceptualization.
The authors acknowledge the financial support of National Key Research and Development Program of China (No. 2021YFA1501500), the National Natural Science Foundation of China (Nos. 22033008, 22220102005, 22171265), Fujian Science & Technology Innovation Laboratory for Optoelectronic Information of China (No. 2021ZZ103).
Supplementary material associated with this article can be found, in the online version, at doi:
J. Othong, J. Boonmak, V. Promarak, F. Kielar, S. Youngme, ACS Appl. Mater. Inter. 11 (2019) 44421–44429. doi: 10.1021/acsami.9b13814
Y. Li, M. Sun, Y. Yang, et al., J. Mater. Chem. C 9 (2021) 8683–8693. doi: 10.1039/d1tc02042k
Q. Zhang, W. Ge, X. Zhang, X. Chen, Dalton Trans. 51 (2022) 8714–8722. doi: 10.1039/d2dt00979j
C.R. Ronda, T. Jüstel, H. Nikol, J. Alloy. Compd. 275-277 (1998) 669–676.
R.P. Rao, D.J. Devine, J. Lumin. 87-89 (2000) 1260–1263.
K.M. Goodenough, F. Wall, D. Merriman, Nat. Resour. Res. 27 (2017) 201–216.
X. Yang, X. Li, B. Wang, et al., Chin. Chem. Lett. 33 (2022) 613–625. doi: 10.1016/j.cclet.2021.08.077
K. Jiang, S. Sun, L. Zhang, et al., Angew. Chem. Int. Ed. 54 (2015) 5360–5363. doi: 10.1002/anie.201501193
L. Wang, W. Li, L. Yin, et al., Sci. Adv. 6 (2020) eabb6772.
T. Hu, Z. Wen, C. Wang, et al., Nanoscale Adv. 1 (2019) 1413–1420. doi: 10.1039/c8na00329g
H. Zhao, X. Yang, R. Xu, et al., J. Mater. Chem. A 6 (2018) 20152–20160. doi: 10.1039/c8ta05970e
B. Ju, H. Nie, Z. Liu, et al., Nanoscale 9 (2017) 13326–13333.
S. Li, L. Li, H. Tu, et al., Mater. Today 51 (2021) 188–207.
F. Huo, W. Liang, Y. Tang, et al., J. Mater. Sci. 54 (2019) 6815–6825. doi: 10.1007/s10853-019-03370-6
H. Ding, J. Xu, L. Jiang, et al., Chin. Chem. Lett. 32 (2021) 3646–3651. doi: 10.1016/j.cclet.2021.04.033
Y. Wu, X. Fang, J. Shi, W. Yao, W. Wu, Chin. Chem. Lett. 32 (2021) 3907–3910. doi: 10.1016/j.cclet.2021.04.040
P. Li, Z. Zhou, Y.S. Zhao, Y. Yan, Chem. Commun. 57 (2021) 13678–13691. doi: 10.1039/d1cc05541k
A.J. Amali, H. Hoshino, C. Wu, M. Ando, Q. Xu, Chem. Eur. J. 20 (2014) 8279–8282. doi: 10.1002/chem.201402982
L. Xu, G. Fang, J. Liu, et al., J. Mater. Chem. A 4 (2016) 15880–15887.
G. Li, X. Wang, J. Zhang, CrystEngComm 20 (2018) 5056–5060. doi: 10.1039/c8ce00955d
Y. Wang, B. Wang, H. Shi, et al., Inorg. Chem. Front. 5 (2018) 2739–2745. doi: 10.1039/c8qi00637g
B. Wang, D. Liu, Y. Peng, X. Peng, IEEE Trans. Instrum. Meas. 69 (2020) 3527–3537. doi: 10.1109/tim.2019.2935576
B.B. Guo, J.C. Yin, N. Li, et al., Adv. Opt. Mater. 9 (2021) 2100283.
Y. Tang, T. Xia, T. Song, et al., Adv. Opt. Mater. 6 (2018) 1800968.
S. Bhattacharjee, C. Chen, W.S. Ahn, RSC Adv. 4 (2014) 52500–52525.
Z. Zhang, Y. Pan, Y. Fang, et al., Nanoscale 8 (2016) 500–507.
Z.R. Yang, M.M. Wang, X.S. Wang, X.B. Yin, Anal. Chem. 89 (2017) 1930–1936. doi: 10.1021/acs.analchem.6b04421
K. Jiang, Y. Wang, X. Gao, C. Cai, H. Lin, Angew. Chem. Int. Ed. 57 (2018) 6216–6220. doi: 10.1002/anie.201802441
W. Gao, H. Song, X. Wang, et al., ACS Appl. Mater. Interfaces 10 (2018) 1147–1154. doi: 10.1021/acsami.7b16991
J. Zhang, X. Zhao, M. Xian, C. Dong, S. Shuang, Talanta 183 (2018) 39–47.
A. Wang, Y.L. Hou, F. Kang, et al., J. Mater. Chem. C 7 (2019) 2207–2211. doi: 10.1039/c8tc04171g
X. Chen, H. Gao, M. Yang, et al., Energy Storage Mater. 18 (2019) 349–355.
A. Karmakar, J. Li, Chem. Commun. 58 (2022) 10768–10788. doi: 10.1039/d2cc03330e
G. Li, H. Wang, T. Zhang, et al., Adv. Funct. Mater. 26 (2016) 8478–8486. doi: 10.1002/adfm.201603734
A.R. Robertson, Color Res. Appl. 2 (1977) 7–11. doi: 10.1002/j.1520-6378.1977.tb00104.x

Scheme 1 Schematic illustration of the synthesis of CQDs-Y-n@ZJU-28 composite using ZJU-28 and CQDs-Y.

Figure 1 (a) Synthesis route and photographs of CQDs-Y under ambient light and 365 nm UV light. (b) Transmission electron microscopy (TEM), high-resolution TEM (HR-TEM) images, and particle size distribution of CQDs-Y. (c) Fluorescence (FL) emission spectra of CQDs-Y at various excitation wavelengths, with an inset of FL excitation spectrum.

Figure 2 Structural and morphological characterization of CQDs-Y-4@ZJU-28. (a) FT-IR spectrum of CQDs-Y-4@ZJU-28. (b) TG analysis curve of ZJU-28 and CQDs-Y-4@ZJU-28. TEM of CQDs-Y-4@ZJU-28 at (c) 100 nm and (d) 20 nm, respectively. (e) HR-TEM of CQDs-Y-4@ZJU-28.

Figure 3 FL emission spectra at various excitation wavelengths, and corresponding CIE coordinates: (a) CQDs-Y-1@ZJU-28, (b) CQDs-Y-2@ZJU-28, (c) CQDs-Y-3@ZJU-28, (d) CQDs-Y-4@ZJU-28, (e) CQDs-Y-5@ZJU-28, and (f) CQDs-Y-6@ZJU-28.

Figure 4 (a) Fluorescence emission spectra of ZJU-28 and absorption spectra of CQDs-Y. (b) Normalized fluorescence emission spectrum of CQDs-Y-n@ZJU-28 at 365 nm. Fluorescence decay curves fitting of (c) CQDS-Y-4@ZJU-28 and (d) CQDs-Y.

Figure 5 (a)Variable temperature fluorescence emission spectrum of CQDs-Y-4@ZJU-28 under 370 nm excitation. (b) Intensity fitting curve corresponding to the 546 nm peak of Fig. 5a and CIE coordinates (illustration). (c) The LED test of CQDs-Y-4@ZJU-28 powder assembled under daylight. (d) Luminous photograph of CQDs-Y-4@ZJU-28 powder excited at 365 nm. (e) Fluorescence spectra and (f) CIE coordinate under LED test.

 扫一扫看文章

扫一扫关注我们
 DownLoad:
 下载:
下载:
 下载:
下载: