Key Laboratory of Functional Inorganic Material Chemistry, Ministry of Education of the People's Republic of China, Heilongjiang University, Harbin 150080, China
b.
School of Advanced Energy, Sun Yat-sen University, Guangzhou 510275, China
Received Date:
15 January 2025 Accepted Date:
05 March 2025 Revised Date:
05 March 2025 Available Online:
15 June 2026
Abstract:
The electrocatalytic two-electron oxygen reduction reaction (2e– ORR) offers an environmentally friendly method for hydrogen peroxide (H2O2) production, yet the development of efficient and cost-effective electrocatalysts remains a significant challenge. Herein, we have synthesized Ni3N2 clusters anchored on N-doped carbon nanostructures (Ni3N2/NC) through a straightforward biomass-derived modification-pyrolysis method for efficient H2O2 production. Theoretical calculations reveal that the D-band center of Ni sites in Ni3N2/NC shows a downshift and successive state, which is beneficial to the formation of key *OOH intermediates and occurrence of subsequent reactions. Remarkably, Ni3N2/NC achieves a 2e– ORR selectivity of 91.65% and an onset potential of 0.69 V. When tested in a practical flow cell, Ni3N2/NC exhibits a Faradaic efficiency (FE) of 91.42% and attains a maximum H2O2 yield of 3.26 mol gcat−1 h−1 at 100 mA/cm2. Additionally, the FE remains above 85% during a 12 h constant current stability test at 40 mA/cm2, highlighting its potential for sustainable H2O2 production.
Hydrogen peroxide (H2O2) is a potential energy carrier and environmentally friendly oxidant in various chemical industries and environmental remediation [1–4]. Traditionally, H2O2 is produced industrially via the energy-intensive anthraquinone (AQ) loop process, leading to significant energy consumption and organic waste generation [5]. Although the direct reaction of hydrogen (H2) with oxygen (O2) has been proposed as an alternative to the AQ process, it is severely limited due to the risks of explosion and low production efficiency [6,7]. Currently, the electrochemical two-electron oxygen reduction reaction (2e– ORR) pathway has garnered significant attention for the synthesis of H2O2. The state-of-the-art electrocatalysts for 2e– ORR primarily based on precious metal alloys, such as Pt–Hg and Pd–Hg [8,9], due to their low overpotentials and high selectivity. However, the scarcity and high cost of precious metal combined with the toxicity of mercury, restrict their broader application. Consequently, there is a critical need to develop stable, efficient and economical non-precious metal electrocatalysts that maintain high selectivity for H2O2 synthesis during the ORR process [10–12].
Heteroatom-doped carbon nanostructures offer significant advantages in the catalysis of 2e– ORR [13–16]. The integration of heteroatoms leads to the redistribution of electrons within the carbon framework, effectively increasing the number of defects and active sites, thereby significantly enhancing electrocatalytic activity. Additionally, transition metals such as Fe [17], Co [18], Zn [19], Mn [20], Ni [21], and Cu [22] are emerging as promising substitutes for precious metals, which can synergize with carbon-based catalysts to achieve highly efficient 2e– ORR performance.
Due to the size effect, clusters demonstrate high atomic utilization and exceptional catalytic capability, offering numerous active sites that facilitate the adsorption and activation of reaction intermediates. It can accelerate the adsorption of O2 and inhibit the cleavage of the O–O bond, thereby enhancing the efficiency of H2O2 production. Qi et al. reported a novel Co(OH)2 cluster catalyst supported by cyclodextrin, which optimized the electronic structure and enhanced adsorption of the *OOH intermediate [23]. Hu et al. found that Ni clusters promote strong *OOH adsorption while weakening *O adsorption, thus boosting 2e− ORR activity [24]. Biomass cellulose has risen as a superior carbon source due to its low cost, abundant availability, and simple processing [25]. By controlling the coordination strength and metal content, single-atom or cluster catalysts supported carbon nanostructures can be synthesized [26]. Based on these considerations, the development of transition metal clusters combined with heteroatom-doped carbon nanostructures derived from biomass may be a feasible approach to achieve efficient H2O2 production.
In this study, Ni3N2 clusters anchored to nitrogen-doped carbon structures (Ni3N2/NC) have been synthesized using biomass cellulose. The cellulose is extracted from coconut shells through an alkaline hydrothermal method and subsequently treated with Fenton oxidation, which facilitates the coordination of metal ions with melamine. Following pyrolysis not only formed the nitrogen-doped carbon substrate but also successfully anchored the Ni3N2 clusters, providing plentiful active sites for the adsorption and activation of reaction intermediates. Consequently, Ni3N2/NC exhibited exceptional catalytic performance in the 2e− ORR to produce H2O2 originated from the synergistic interaction between the Ni3N2 clusters and the N-doped carbon structures. Remarkably, Ni3N2/NC demonstrated a high ORR selectivity and an ultra-high H2O2 production rate. In flow cell tests, it maintained a Faradaic efficiency (FE) of over 85% for H2O2 production, operating continuously for 12 h at a current density of 40 mA/cm2. Our work offers novel insights into the development of cost-effective catalysts for the efficient H2O2 electrosynthesis.
Materials and reagents: Natural coconut coir, NiCl2·6H2O, melamine, FeSO4·7H2O, Ce(SO4)2, RuO2, KCl, and K3[Fe(CN)6] were purchased from Aladdin Chemical Reagents Co., Ltd. Methanol, 30 wt% hydrogen peroxide, KOH, and H2SO4 were obtained from Tianjin Fuyu Fine Chemicals Co., Ltd. VXC72R conductive carbon black, commercial carbon paper (CC), and Nafion solution (5 wt%) were sourced from Shanghai Hesen Electric Co., Ltd. All chemical reagents used in the synthesis were of analytical grade and did not require further purification.
Synthesis of Ni3N2/NC: Typically, cellulose fibers (CF) were firstly extracted from coconut shells using a traditional alkaline hydrothermal method. The process involved immersing 5 g of coconut shell in 120 mL of 6 mol/L KOH and heating at 150 ℃ for 8 h. After washing with deionized water, the CF was obtained. Subsequently, CF was oxidized based on the Fenton reaction. Specifically, 0.5 g of CF was dispersed in 30 mL of deionized water, to which 0.09 mmol of FeSO4·7H2O was added and stirred for 15 min. Next, 4.8 mL of 30 wt% hydrogen peroxide was added, and the mixture was stirred at 40 ℃ for 3.5 h. The oxidized cellulose fibers (OCF) were then isolated via suction filtration and continuously washed with deionized water. The OCF powder was then dispersed in 40 mL of methanol, with 3 mmol of melamine and 0.042 mmol of NiCl2·6H2O added and stirred at room temperature for 30 min. This mixture was transferred to a stainless steel autoclave lined with polytetrafluoroethylene and heated to 100 ℃ for 12 h. The resultant N-doped OCF precursor was collected by filtration, washed with methanol, and then pyrolyzed under a nitrogen atmosphere at 1000 ℃ for 2 h to prepare Ni3N2/NC. To investigate the impact of melamine and NiCl2·6H2O on the electrocatalytic activity, control samples were prepared using only melamine, denoted as NC, and without either compound, denoted as CCN.
The morphology and structure were characterized using transmission electron microscopy (TEM, JEM-2100/JEOL, accelerating voltage of 200 kV) and scanning transmission electron microscopy (STEM, JEM-F200, accelerating voltage of 200 kV). X-ray diffraction (XRD) patterns were conducted using a Rigaku D/max-IIIB diffractometer with Cu Kα radiation (λ = 1.5406 Å). Raman spectroscopy was performed using a Jobin Yvon HR 800 micro-Raman spectrometer at an excitation wavelength of 457.9 nm. X-ray photoelectron spectroscopy (XPS) was carried out on a VG ESCALABMK Ⅱ using an Al Kα monochromatic X-ray source. Fourier-transform infrared (FTIR) spectroscopy was conducted using a Nicolet 6700 FTIR spectrometer (Thermo Fisher Scientific, USA). Ultraviolet-visible (UV–vis) spectroscopy was performed on a Shimadzu UV-2550 spectrometer (Shimadzu, Japan), respectively. Attenuated total reflectance surface-enhanced infrared absorption spectroscopy (ATR-SEIRAS) data were collected using a Thermo Scientific iS50 FTIR spectrometer equipped with a fast-scanning liquid nitrogen-cooled mercury cadmium telluride (MCT) detector and a high-temperature reaction chamber. Inductively coupled plasma atomic emission spectroscopy (ICP-AES) was measured on an Agilent 725. X-ray absorption fine structure (XAFS) measurements were performed in transmission mode at the BL 14W1 beamline of the Shanghai Synchrotron Radiation Facility (SSRF), using a Si (111) double-crystal monochromator for energy selection.
The electrochemical performance was evaluated using a typical three-electrode system on a DH7003–2 electrochemical workstation. Pt foil (1.0 cm2) served as the counter electrode, and a commercial reversible hydrogen electrode (RHE) acted as the reference electrode. A rotating ring-disk electrode (RRDE) with a glassy carbon disk (diameter: 5.61 mm) and a platinum ring (inner/outer ring diameters: 6.25/7.92 mm) was used as the working electrode. The preparation of the working electrode was as follows: 2.5 mg of catalyst was dispersed in a mixed solution of 0.275 mL ethanol, 0.5 mL deionized (DI) water, and 0.25 mL of 0.5 wt% Nafion. Then, the mixture was sonicated for 2 h to obtain a homogeneous ink (the preparation method for the H-cell and flow cell was the same as described above). Subsequently, 25.3 µL of the catalyst slurry was dropped onto the surface of the glassy carbon disk (loading: 0.25 mg/cm2) and dried to form a smooth film.
The ORR performance was evaluated in an O2-saturated 0.1 mol/L KOH electrolyte with continuous oxygen flow during the test. Linear sweep voltammetry (LSV) was employed over a potential range of 0–1 V (vs. RHE) at a scan rate of 5 mV/s. The potential of the Pt ring electrode was maintained at 1.5 V vs. RHE to detect the H2O2 generated on the disk electrode. The H2O2 selectivity, electron transfer number (n), and H2O2 yield was calculated as following formulas.
H2O2(%)=200×Iring/NIdisk+Iring/N
(1)
n=4×IdiskIdisk+Iring/N
(2)
where Iring and Idisk represent the ring current and disk current, respectively, and N is the collection efficiency of the ring electrode, which was calibrated using the [Fe(CN)6]3−/4− redox system and determined to be 0.365.
RRDE measurements were conducted at different rotation speeds, and the electron transfer number n was calculated using the following Koutecky-Levich (K-L) equation:
where J is the measured current density, JL and JK are the diffusion-limited and kinetic-limited current densities, respectively; ω is the angular rotation frequency; n is the number of transferred electrons; F is Faraday's constant (96,485 C/mol); C0 is the bulk concentration of O2 (1.22 × 10⁻⁶ mol/cm3); D0 is the diffusion coefficient of O2 (1.93 × 10⁻⁵ cm2/s); and ν is the viscosity of the electrolyte (0.01 cm2/s).
The electrochemical measurements were converted to the reversible hydrogen electrode (RHE) using the following equation:
Evs.RHE=Evs.Ag/AgCl+0.198V+0.0592′pH
(5)
The actual H2O2 production rate was studied in a two-chamber three-electrode H-cell system separated by a Nafion 117 membrane. Each chamber was filled with 35 mL of 0.1 mol/L KOH, and the cathode was purged with O2 for at least 30 min to achieve saturation. The working electrode was prepared by ultrasonic spraying of Ni3N2/NC ink onto commercial carbon paper (HCP120) with dimensions of 1.0 × 1.0 cm2. An Ag/AgCl electrode and a carbon rod were used as the reference electrode and counter electrode, respectively. The system was then maintained at a constant potential of 0.5 V (vs. RHE), and the ORR was conducted for 0.5 h under different loadings.
The production rate of H2O2 at different potentials was accurately quantified by cerium sulfate titration. The experimental principle is as follows:
2Ce4++H2O2→2Ce3++2H++O2
(6)
A standard Ce(SO4)2 solution (0.5 mmol/L) was prepared by dissolving Ce(SO4)2 salt in a 0.5 mol/L sulfuric acid solution. The calibration curve for absorbance versus Ce4+ concentration was established by measuring the absorbance of different Ce(SO4)2 solutions with known concentrations (0.1–0.5 mmol/L) at 317 nm (Fig. S11 in Supporting information). After electrolysis for a certain period, 100 µL of the electrolyte from the cathode chamber, neutralized with 0.5 mol/L sulfuric acid solution, was added to the standard Ce(SO4)2 titrant solution. The yield of H2O2 was then determined based on the decrease in the concentration of Ce4+ using the following equation:
where VCe4+ is the volume of added Ce(SO4)2, CCebefroe4+ is the concentration of Ce4+ before the reaction, CCeafter4+ is the concentration of Ce4+ after the reaction, and Vele is the volume of electrolyte injected after the reaction. The absorbance values of different concentrations of Ce4+ at 317 nm were linearly fitted to obtain the standard concentration-absorbance curve.
The Faradaic efficiency (FE) is calculated using the following equation:
FE(%)=(2×C×V×F)/Q×100%
(8)
where F is Faraday's constant (96,485 C/mol), C is the concentration of H2O2, V is the volume of the electrolyte, and Q is the total charge during the ORR.
Flow cell performance test: A well-mixed catalyst ink was uniformly applied to the gas diffusion layer (GDL) as the cathode, with a loading of Ni3N2/NC of approximately 0.5 mg/cm2 and an effective catalytic area of 4 cm2. The anode for water oxidation was prepared by loading 1.0 mg/cm2 of RuO2/black carbon catalyst (based on RuO2 loading) onto the GDL electrode, with Ag/AgCl as the reference electrode. A 1 mol/L KOH aqueous solution was used as the electrolyte. The oxygen flow rate was set at 100 mL/min to ensure real-time saturation of oxygen during the reaction. The flow rate of the liquid electrolyte was fixed at 70 mL/min, which carried off the generated H2O2 (with a circulating electrolyte volume of 1 L). A Nafion 117 membrane was used to separate the cathode and anode. The electrochemical synthesis of H2O2 was tested at constant currents of 10, 20, 40, 80, or 100 mA/cm2, followed by quantification of the generated H2O2 concentration using the cerium sulfate titration method. The H2O2 accumulation stability test was conducted at a constant current of 40 mA/cm2 for 12 h. To prevent the decomposition of accumulated H2O2, the electrolyte was replaced every 4 h.
Density functional theory (DFT) calculations were performed using the CASTEP module in Material Studio. The electronic exchange and correlation effects were described using the Perdew-Burke-Ernzerhof generalized gradient approximation (PBE-GGA) functional. The cutoff energy was set to 400 eV, and the vacuum level was set to 20 Å to avoid interactions between periodic slabs. A self-consistent field (SCF) tolerance of 2 × 10⁻⁶ eV was used for the expansion of wave functions. To evaluate the 2e– ORR activity of CCN, NC, Ni3N2 clusters, and Ni3N2/NC, the corresponding models were constructed. A 1 × 1 × 1 Monkhorst-Pack K-point sampling was employed throughout, with convergence criteria for energy and forces set to 2 × 10⁻⁵ eV and 0.05 eV/Å, respectively.
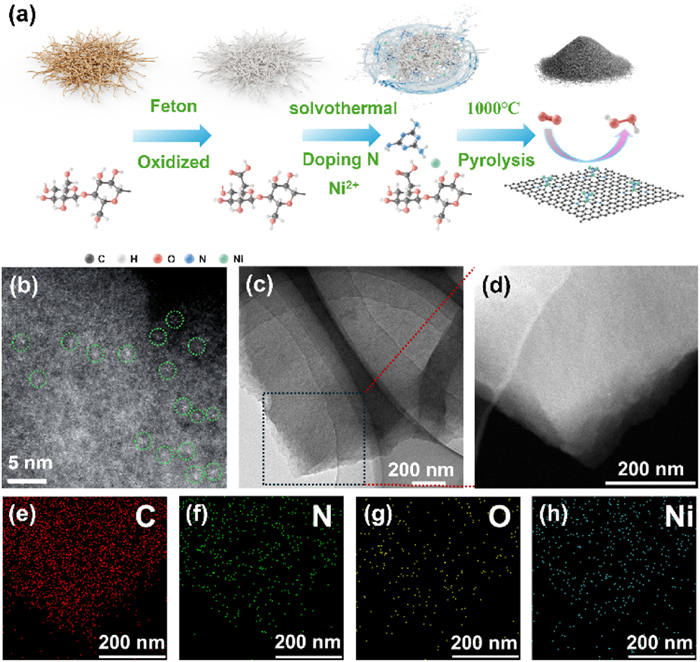
The synthesis process of Ni3N2/NC was illustrated in Fig. 1a. First, one-dimensional cellulose fibers (CF) were extracted from coconut shells employing a traditional alkaline hydrothermal method (Fig. S1 in Supporting information) [27]. Then, the CF were treated via Fenton oxidation to produce oxidized cellulose fibers (OCF) [28,29]. The functional groups include carboxyl and hydroxyl in the OCF could coordinate with Ni2+ ions and melamine through a solvothermal strategy. Subsequent pyrolysis under a nitrogen ambient at 1000 ℃ resulted in the formation of Ni3N2/NC. For comparative analysis, nitrogen-doped carbon (NC) and cellulose carbon nanostructures (CCN) were also synthesized using the same method but without introducing Ni2+ ions and melamine, respectively. Scanning electron microscopy (SEM) images reveal that all the three samples consist of disordered carbon aggregates (Fig. S2 in Supporting information). The aberration-corrected high-angle annular dark field scanning transmission electron microscopy (HAADF-STEM) clearly shows the uniform dispersion of metal clusters approximately 0.5 nm in Ni3N2/NC (Fig. 1b). Furthermore, no significant nanoparticles are observed in the transmission electron microscopy (TEM) image (Fig. 1c). High-resolution TEM (HRTEM) image (Fig. S3 in Supporting information) displays the presence of amorphous carbon features with no metallic signatures. Elemental mapping confirms the uniform distribution of Ni, N, and C in the Ni3N2/NC (Figs. 1d-h). Additionally, inductively coupled plasma atomic emission spectroscopy (ICP-AES) analysis indicates that the Ni content in Ni3N2/NC is 0.12 wt% with iron content being nearly negligible, suggesting that the metal clusters in Fig. 1b are predominantly composed of Ni atoms.
Figure 1
Figure 1.
Synthesis and structural characterizations. (a) Schematic illustration for the fabrication process of Ni3N2/NC. (b) Aberration-corrected HAADF-STEM. (c) TEM images of Ni3N2/NC. (d) HAADF-STEM and (e-h) the corresponding elemental mapping images of Ni3N2/NC.
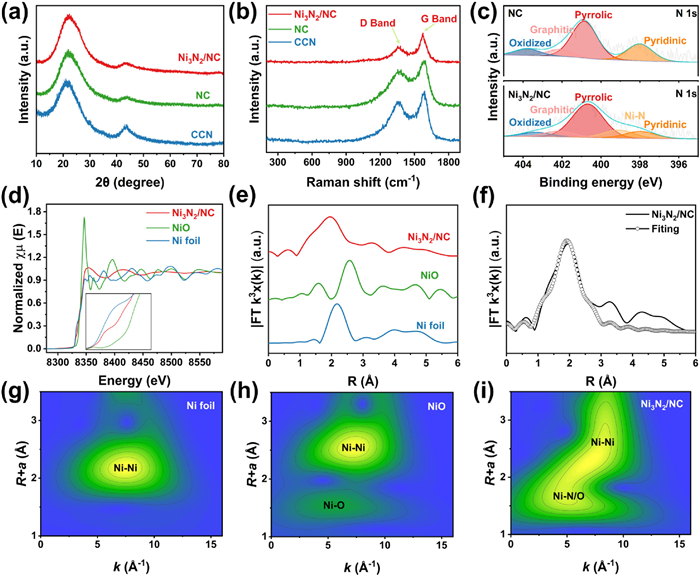
The X-ray diffraction (XRD) pattern in Fig. 2a exhibits two distinct peaks at 21° and 44°, corresponding to amorphous carbon [30]. The Raman spectra displayed in Fig. 2b show two prominent peaks located at approximately 1348 and 1585 cm–1, which correspond to the D band and G band, respectively. The D band is indicative of disordered or defective carbon nanostructures, while the G band is associated with sp2 hybridized carbon found in aromatic structures [25,31].
Figure 2
Figure 2.
Spectroscopic characterizations. (a) XRD patterns and (b) Raman spectra of Ni3N2/NC, NC and CCN. (c) N 1s XPS spectrum of Ni3N2/NC and NC. (d) Normalized XANES spectra at Ni K-edge and (e) corresponding k3-weighted FT-EXAFS spectra of Ni3N2/NC and references. (f) Ni K-edge EXAFS fitting curves of Ni3N2/NC at R space. WT-EXFAS of (g) Ni foil, (h) NiO and (i) Ni3N2/NC.
Importantly, the observed ID/IG ratio is relatively low, suggesting a greater graphitic content in the Ni3N2/NC material compared to CCN and NC. This enhanced graphitic character is beneficial for facilitating electron transfer during electrocatalytic reactions, potentially leading to improved catalytic performance. The higher graphitic content may enhance the conductivity and stability of the material, making it more effective in electrocatalytic applications. The composition and valence states were investigated using X-ray photoelectron spectroscopy (XPS). The wide spectra of Ni3N2/NC recover the presence of C and N elements, along with weak signals for Ni due to its low concentration (Fig. S4a in Supporting information). The high-resolution C 1s spectrum in Fig. S4b (Supporting information) can be deconvoluted into four peaks, including C–C/C=C (284.8 eV), C–N (285.7 eV), C–O (286.7 eV), and O–C=O (288.8 eV) [32]. The N 1s spectrum can be deconvoluted into five peaks, including oxidized-N (403.4 eV), graphitic-N (402.1 eV), pyrrolic-N (400.8 eV), Ni-N (399.1 eV), and pyridinic-N (397.9 eV) (Fig. S4c in Supporting information). A comparison between NC and Ni3N2/NC in Fig. 2c clearly shows the peak corresponding to nickel-bound nitrogen, indicating the coordination between Ni and N atoms. Additionally, the presence of graphitic-N, pyrrolic-N, and pyridinic-N indicates N-doping within the carbon framework, which could enhance the electrocatalytic activity. As shown in Fig. S4d (Supporting information), the high-resolution O 1s spectra exhibit no peaks correspond to metal–O, indicating the absence of metal oxides. The Ni 2p spectrum can be deconvoluted into four distinct peaks (Fig. S4e in Supporting information). The peaks at 872.9 and 855.6 eV correspond to Ni2+ 2p1/2 and Ni2+ 2p3/2, respectively, while the peaks at 869.9 and 852.6 correspond to the Ni0 2p1/2 and Ni0 2p3/2. The results suggest that the valence state of Ni species is between 0 and +2. The lower peaks for Ni0 metallic indicate that Niδ+ exhibits single dispersed characteristic without forming elemental nickel, which is in agreement with the above XRD and HAADF-STEM results. Moreover, no Ni species were detected in NC (Fig. S5 in Supporting information), while neither Ni nor N species were observed in CCN (Fig. S6 in Supporting information).
X-ray absorption near-edge structure (XANES) and extended X-ray absorption fine structure (EXAFS) measurements were employed to analyze the structural details of the catalyst. As the XANES spectrum displayed in Fig. 2d, the pre-edge absorption peak of Ni K-edge for Ni3N2/NC is located between those of Ni foil and NiO, suggesting the oxidation state of Ni is between 0 and +2, aligning with XPS results. Quantitative analysis of the K-edge position further confirms the specific valence of the Ni species in Ni3N2/NC is +1.45 (Fig. S7 in Supporting information). The Fourier transform of the extended X-ray absorption fine structure (EXAFS) spectrum of Ni3N2/NC (Fig. 2e) shows a prominent peak at 1.98 Å in the R space, close to the Ni-O peak of NiO. It is well known that distinguishing between nitrogen and oxygen coordination with metals is not feasible in synchrotron radiation. However, XPS results reveal the absence of nickel-oxygen bonds in Ni3N2/NC, suggesting that the specific peak should be attributed to Ni-N bond. A minor peak corresponding to the Ni-Ni path is also observed at approximately 2.53 Å [33]. The FT-EXAFS spectrum can be well-fitted using backscattering paths for Ni-N and Ni-Ni (Fig. 2f and Table S1 in Supporting information). The results indicate that the coordination numbers for Ni-N and Ni-Ni are approximately 1.79 and 1.77, respectively, suggesting that the nickel species in Ni3N2/NC are primarily present as Ni3N2 clusters. Figs. 2g−i also demonstrate the existence of Ni-N and Ni-Ni bond.
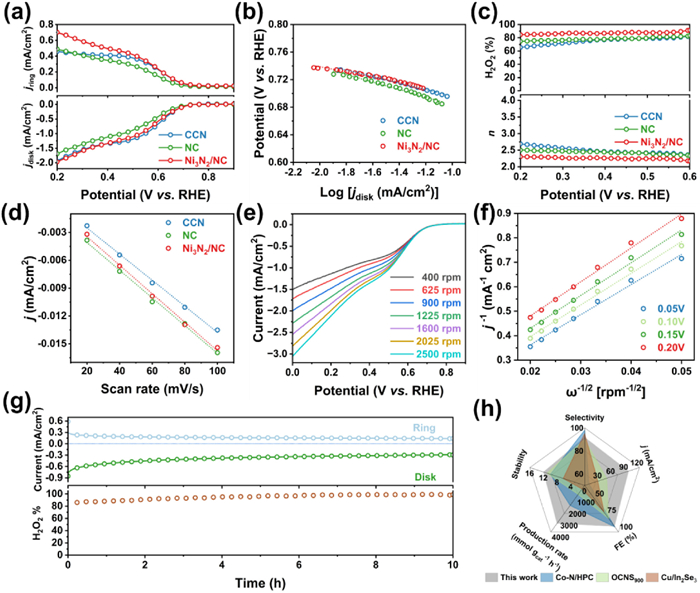
The electrocatalytic performance of the 2e– ORR was studied using a rotating ring-disk electrode (RRDE) by a three-electrode system in O2-saturated 0.1 mol/L KOH. The collection efficiency of the RRDE was experimentally determined to be 0.365 utilizing a ferrocyanide/ferricyanide redox reaction, which is consistent with the theoretical value of 0.37 (Fig. S8 in Supporting information) [34]. To quantify the production of H2O2, the potential of the Pt ring electrode was maintained at 1.5 V (vs. RHE) to specifically oxidize H2O2 produced at the disk electrode during the test [35]. As depicted in Fig. S9 (Supporting information), the optimal catalyst loading is established at 0.25 mg/cm2. Linear sweep voltammetry (LSV) curves (Fig. 3a) reveal that Ni3N2/NC shows a notable increase in ring current density compared to NC and CCN, indicating enhanced 2e– ORR selectivity. It is much better than the reported similar electrocatalysts [36–39]. Moreover, the Tafel slope for Ni3N2/NC of 36.84 mV/dec is superior to that of CCN and NC, which are 47.46 and 54.68 mV/dec, respectively, suggesting faster ORR kinetics (Fig. 3b).
Figure 3
Figure 3.
Electrocatalytic performance toward H2O2 production. (a) LSV curves at 1600 rpm under 5 mV/s and (b) corresponding Tafel slopes of CCN, NC and Ni3N2/NC. (c) Calculated H2O2 selectivity and electron transfer number n. (d) Double-layer capacitances (Cdl) of CCN, NC and Ni3N2/NC determined at 1.07 V (vs. RHE) in the CV curves to avoid the interference of Faradaic currents. (e) LSV curves of Ni3N2/NC at different rotation speeds, and (f) corresponding K-L plots and the calculated electron transfer number (n). (g) Chronopotentiometry curves of Ni3N2/NC at 0.6 V (vs. RHE) for 10 h. (h) Performance comparison of Ni3N2/NC with the reported advanced electrocatalysts. All the tests were conducted in O2-saturated 0.1 mol/L KOH electrolyte.
The selectivity for H2O2 and the electron transfer number (n) calculated from the LSV curve (Fig. 3a) are illustrated in Fig. 3c. Notably, Ni3N2/NC achieves a H2O2 selectivity of over 84.80% across a potential range of 0.2–0.6 V vs. RHE with a maximum value of 91.65%, significantly higher than that of CCN and NC. Although CCN achieves similar onset potential and diffusion-limited current density as that of Ni3N2/NC, it shows a relatively low H2O2 selectivity of approximately 68%. In contrast, NC exhibits better H2O2 selectivity at around 78% compared to CCN, but both its onset potential and diffusion-limited current density are noticeably lower. It is concluded that Ni3N2 clusters play pivotal role in enhancing the electrocatalytic performance for the 2e– ORR pathway. Additionally, the calculated n for Ni3N2/NC is 2.17, aligning closely with a nearly 2e– ORR pathway. Moreover, Ni3N2/NC also demonstrates the most positive onset potential at 0.695 V (vs. RHE) and the highest H2O2 current density (jH2O2 at 0.25 V (vs. RHE) of –1.78 mA/cm2, surpassing both CCN (0.693 V, –1.72 mA/cm2) and NC (0.677 V, –1.51 mA/cm2).
The double-layer capacitance (Cdl) of Ni3N2/NC was assessed by cyclic voltammetry (CV) scans at various scan rates to estimate the electrochemical active surface area (ECSA) (Fig. S10 in Supporting information) [40]. Obviously, Ni3N2/NC demonstrates the highest Cdl value of 154 µF/cm2, indicating an the enhanced electrocatalytic activity is originated from the extensive ECSA (Fig. 3d). The LSV curves conducted at various rotation speeds are shown in Fig. 3e, and the Koutecky-Levich (K-L) equation is applied to calculate the n (Fig. 3f). The calculated n average value of 2.14 aligns closely with results from the RRDE method, thereby corroborating the 2e– ORR pathway for Ni3N2/NC with H2O2 as the final product. Stability evaluation was performed using chronoamperometry at fixed disk and ring potentials of 0.6 and 1.5 V (vs. RHE), respectively. As shown in Fig. 3g, the H2O2 selectivity remained above 85% after 10 h, revealing the excellent electrocatalytic stability of Ni3N2/NC. Consequently, Ni3N2/NC demonstrates outstanding performance in H2O2 electrosynthesis, surpassing that of recently developed state-of-the-art atomically dispersed electrocatalysts (Fig. 3h and Table S3 in Supporting information).
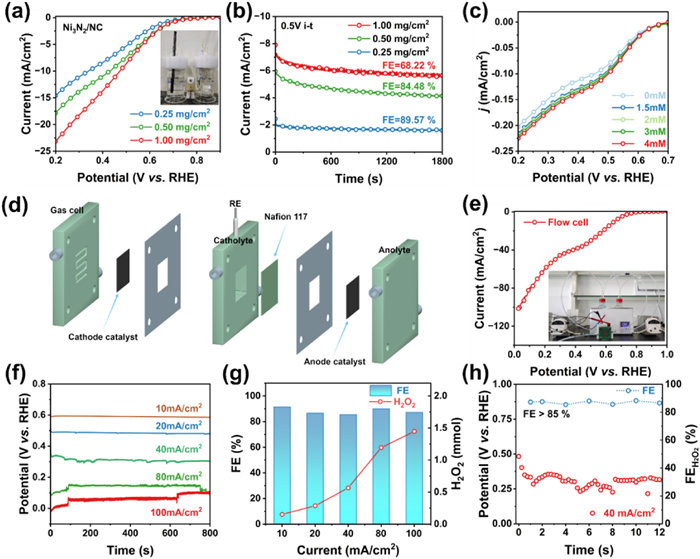
To evaluate the Faradaic efficiency (FE) and H2O2 yield of the Ni3N2/NC catalyst, the H2O2 production was measured using a ceric sulfate-UV spectrophotometry method [41]. Fig. 4a depicts a series of experiments wherein H2O2 generation was carried out using an H-cell system. This system utilized carbon paper loaded with varying amounts of catalyst as the working electrode, and the cathode electrolyte was continuously purged with O2 under vigorous stirring. After operating at 0.5 V for 1800 s, the electrolyte was collected for H2O2 quantification. Remarkably, the Ni3N2/NC with a catalyst loading of 0.50 mg/cm2, achieved an FE of 84.48% and an H2O2 yield of 144.37 mmol gcat−1 h−1, outperforming the systems with catalyst loadings of 0.25 mg/cm2 (FE = 89.57%, yield = 113.92 mmol gcat−1 h−1) and 1.00 mg/cm2 (FE = 68.22%, yield = 152.16 mmol gcat−1 h−1) (Fig. 4b).
Figure 4
Figure 4.
Electrochemical H-cell and flow cell performances of Ni3N2/NC. (a) LSV curves under H-cell system and (b) chronopotentiometry curves at 0.5 V for 1800 s of Ni3N2/NC with different loadings on working electrode in O2-saturated 0.1 mol/L KOH. (c) LSV curves of Ni3N2/NC in the N2-saturated 0.1 mol/L KOH with different concentrations of pre-added H2O2. (d) Schematic illustration of the assembled flow cell. (e) LSV curves and (f) chronopotentiometry curve at different current densities for the H2O2 production in flow cell. (g) H2O2 production and Faraday efficiency at different current densities, (h) chronopotentiometry curve and corresponding FEH2O2 at 40 mA/cm2 in flow cell.
Due to the possibility that H2O2 may undergo further reduction in the presence of the electrocatalyst [42], we conducted investigations on the electrocatalytic H2O2 reduction reaction in nitrogen-saturated solutions with H2O2 concentrations ranging from 0 to 4 mmol/L. As shown in Fig. 4c, Ni3N2/NC exhibits a negligible H2O2 reduction current density, suggesting its potential as a promising candidate for H2O2 production. Nevertheless, challenges such as the low solubility of O2 in aqueous solution and slow mass transfer in the H-cell setup limit the scalability of H2O2 production. To address this, we assembled a three-phase flow cell reactor using 1 mol/L KOH as the flowing electrolyte for electrochemical testing (Fig. 4d) [43]. Impressively, the 2e– ORR activity of Ni3N2/NC in this setup showed significant enhancement compared to that obtained in the H-cell setup (Fig. 4e), indicating that the local concentration of gaseous O2 was substantially increased [30]. Figs. 4f and g demonstrate that Ni3N2/NC consistently generated H2O2 over 800 s across a current range of 10–100 mA/cm2 with the yield escalating from 0.15 mmol to 1.45 mmol. Concurrently, the H2O2 yield per unit mass of catalyst improves from 0.34 mol gcat–1 h–1 to 3.26 mol gcat–1 h–1, with the Faradaic efficiency decreasing from 91.42% to 85.42% (Fig. 4g). Fig. 4h shows that during the 12-h H2O2 accumulation stability test conducted at a constant current of 40 mA/cm2, the redox potential remained stable, with the faradaic efficiency (FE) consistently exceeding 85%. To prevent the decomposition of accumulated H2O2, the catholyte was replaced every four hours. This demonstrates the potential of the Ni3N2/NC catalyst for large-scale H2O2 production. The H2O2 yield achieves in the flow cell exceeded that in the H-cells by an order of magnitude and also significantly outperformed recently reported 2e– ORR catalysts (Fig. 3h and Table S3). Overall, the synthesized Ni3N2/NC demonstrates significant potential for the practical production of H2O2.
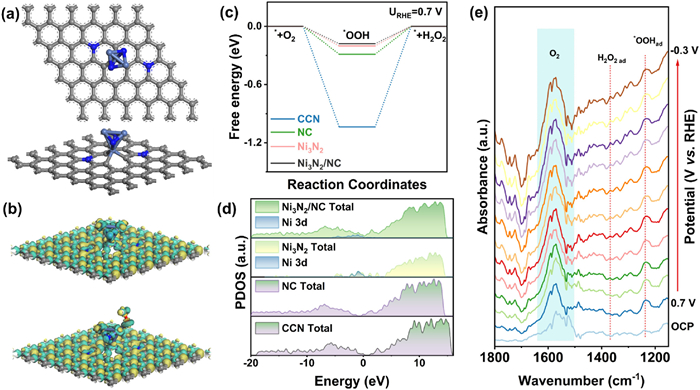
To elucidate the catalytic mechanism underlying the generation of H2O2, the Ni3N2/NC, CCN, NC and Ni3N2 (composed of clusters) models were constructed based on their structural characteristics for DFT calculations (Fig. 5a and Fig. S12 in Supporting information) [44,45]. The free energies of intermediates include O2, *OOH, H2O2, *O, *OH and H2O on different models were calculated for both the 2e− and 4e− ORR processes. Bader charge analysis for the NC model reveals the transfer of a + 0.15 positive charge to the carbon atoms adjacent to nitrogen, identifying C atoms as the active sites (Fig. S12a). Correspondingly, the Ni sites in the Ni3N2 model are determined to be active (Fig. S12b). For the Ni3N2/NC model, Ni3N2 clusters were intercalated among the nitrogen atoms of the NC substrate. Both the Bader charge distribution (Fig. S12c) and differential charge analysis (Fig. 5b) suggest that Ni likely serves as a more effective active site in the Ni3N2/NC model.
Figure 5
Figure 5.
Theoretical calculations and in-situ characterizations. (a) Optimized structures of Ni3N2/NC model from top view and front view. (b) Charge density differences (Δρ = ρA+B – ρA – ρB) of Ni3N2/NC model adsorbed *OOH. Yellow stands for electron accumulation and cyan for electron loss, the isosurface value is 0.0015 e/Bohr3. (c) Free energy diagram of O2 reduction paths where each intermediate state is kept at a realistic potential of 0.7 V (vs. RHE). (d) DOS plots of CCN, NC, Ni3N2 and Ni3N2/NC models, including the d-orbitals of Ni atom in Ni3N2 and Ni3N2/NC. (e) In situ ATR-SEIRAS of Ni3N2/NC in O2-saturated 0.1 mol/L KOH under the potential of 0.7~−0.3 V (vs. RHE).
The adsorption of the *OOH intermediate is a key factor that determines the catalytic activity and selectivity of the 2e– ORR. Fig. 5c illustrates the free energy diagram of the critical *OOH intermediate in the 2e– ORR pathway, with the potential of each intermediate fixed at 0.7 V (vs. RHE) [18]. At this potential, the 2e− ORR reaches thermodynamic equilibrium. The overpotential required for the formation of *OOH on the CCN model is −1.04 eV, which contrasts sharply with the −0.29 eV observed for the NC model. It suggests that N-doping into the carbon substrate promotes the 2e− ORR pathway. In the case of the Ni3N2 model, the overpotential slightly increases to −0.20 eV, indicating a propensity for Ni3N2 clusters to facilitate 2e− ORR activity. Combining the Ni3N2 cluster with the N-doped carbon substrate in the Ni3N2/NC model further reduces the overpotential to −0.18 eV, reflecting lower energy barriers and enhanced ORR kinetics. When the *OOH intermediate is adsorbed, the Ni atom in the Ni3N2 cluster serves as the active site, facilitating direct electron transfer to the *OOH intermediate.
Additionally, free energy diagrams for the 4e– ORR were computed (Fig. S13 in Supporting information). The free energy values of the *OOH, *O and *OH intermediates for the Ni3N2/NC, NC and Ni3N2 models are greater than 0 eV (Fig. S14 in Supporting information), indicating that the 4e– ORR reactions are endothermic and non-spontaneous. Notably, the Ni3N2/NC model exhibits the highest overpotential at 0.35 eV. The NC model exhibits relatively high free energies for both *OOH and *O, while the reaction to form *OH is exothermic, suggesting potential decomposition of H2O2 if produced. Although the Ni3N2/NC model increases the overpotential for the formation of *OH in the 4e– ORR, it lowers the overpotential for the 2e– ORR. Projected density of states (PDOS) calculations include full orbital and specific analysis of Ni 3d orbitals, were conducted for the CCN, NC, Ni3N2 and Ni3N2/NC models (Fig. 5d). It reveals that Ni3N2/NC model has a pronounced peak at–0.96 eV for Ni 3d orbital, which is lower than the –0.89 eV observed for Ni3N2 model. This enhancement is attributed to the combination of Ni3N2 with the nitrogen-doped carbon substrate. The result indicates a downward shift of the Ni d-band center, also confirmed by a decrease in intensity (Fig. S15 in Supporting information).
In situ attenuated total reflectance surface-enhanced infrared absorption spectroscopy (ATR-SEIRAS) was further used to monitor the formation of intermediates on Ni3N2/NC. As depicted in Fig. 5e, the adsorbed *OOH intermediate appears at 1238 cm−1 between 0.7 and −0.3 V. Notably, the corresponding peak intensity initially increases and then decreases as the reaction progresses, which is attributed to the kinetics being proportional to the overpotential. Concurrently, the absorption peak for H2O2 at 1368 cm−1 gradually increases with the rising applied potential, further confirming the occurrence of 2e− ORR process on Ni3N2/NC [46]. Additionally, the NC sample prominently displays an adsorbed *OOH peak at 1238 cm−1, however, no corresponding peak for H2O2 is observed (Fig. S16 in Supporting information). It suggests that NC possesses limited capacity to accumulate H2O2, leading predominantly to H2O2 reduction reaction. The result aligns with the DFT calculations that NC demonstrates spontaneous reactions in subsequent steps of the 4e− ORR pathway. It can further conclude that the Ni3N2 clusters is beneficial for the production and accumulation of H2O2. Therefore, N-doped carbon substrate could modulate the electronic structure of Ni in Ni3N2 clusters, resulting in a downward shift of the Ni d-band center. The binding energy between the Ni site and *OOH is moderate, allowing Ni to serve as the actual catalytic active site during the 2e– ORR process.
In conclusion, we introduce an efficient catalyst for the 2e− ORR to H2O2 production, comprising Ni3N2 clusters anchored on N-doped carbon nanostructures derived from biomass. The N-doped carbon nanostructures adjust the electronic structure of Ni in Ni3N2 clusters, causing a downward shift in the Ni d-band center, while the Ni3N2 clusters is beneficial for the production and accumulation of H2O2. Consequently, the over reduction of *OOH is effectively inhibited, which in turn restricts the competitive reaction associated with 2e− ORR. Thus, the Ni3N2/NC achieves a 91.65% selectivity for H2O2 in an alkaline electrolyte, exhibiting an onset potential of 0.69 V (vs. RHE). Additionally, it demonstrates a FE of 84.48% and a H2O2 yield of 144.37 mmol gcat h–1 in an H-cell system. Remarkably, in a flow cell setup, it shows superior electrocatalytic performance in H2O2 generation with a FE of 91.42% and a maximum H2O2 production rate of 3.26 mol gcat h–1 at 100 mA/cm2. This study provides a cost-effective approach for constructing efficient 2e− ORR catalysts, thereby advancing the commercialization of H2O2 production technologies.
Declaration of competing interest
The authors declare that they have no known competing financial interests or personal relationships that could have appeared to influence the work reported in this paper.
We gratefully acknowledge the support of this research by the National Natural Science Foundation of China (No. 22179034), the Natural Science Foundation of Heilongjiang Province (No. ZD2023B002), the Fundamental Research Funds for the Central Universities of Sun Yat-sen University (No. 76280-31610003).
Supplementary materials
Supplementary material associated with this article can be found, in the online version, at doi:10.1016/j.cclet.2025.111045.
[1]
Y. Liu, X. Quan, X. Fan, H. Wang, S. Chen, Angew. Chem. Int. Ed. 54 (2015) 6837–6841. doi: 10.1002/anie.201502396
[2]
N. Wang, S. Ma, P. Zuo, J. Duan, B. Hou, Adv. Sci. 8 (2021) 2100076. doi: 10.1002/advs.202100076
[3]
Z. Deng, S.J. Choi, G. Li, X. Wang, Chem. Soc. Rev. 53 (2024) 8137–8181. doi: 10.1039/d4cs00412d
C. Tang, L. Chen, H. Li, et al., J. Am. Chem. Soc. 143 (2021) 7819–7827. doi: 10.1021/jacs.1c03135
[45]
G. Xing, M. Tong, P. Yu, et al., Angew. Chem. Int. Ed. 61 (2022) e202211098.
[46]
T. Lu, M. Sun, F. Wang, et al., ACS Nano 18 (2024) 15035–15045. doi: 10.1021/acsnano.4c01698
Figure 1
Synthesis and structural characterizations. (a) Schematic illustration for the fabrication process of Ni3N2/NC. (b) Aberration-corrected HAADF-STEM. (c) TEM images of Ni3N2/NC. (d) HAADF-STEM and (e-h) the corresponding elemental mapping images of Ni3N2/NC.
Figure 2
Spectroscopic characterizations. (a) XRD patterns and (b) Raman spectra of Ni3N2/NC, NC and CCN. (c) N 1s XPS spectrum of Ni3N2/NC and NC. (d) Normalized XANES spectra at Ni K-edge and (e) corresponding k3-weighted FT-EXAFS spectra of Ni3N2/NC and references. (f) Ni K-edge EXAFS fitting curves of Ni3N2/NC at R space. WT-EXFAS of (g) Ni foil, (h) NiO and (i) Ni3N2/NC.
Figure 3
Electrocatalytic performance toward H2O2 production. (a) LSV curves at 1600 rpm under 5 mV/s and (b) corresponding Tafel slopes of CCN, NC and Ni3N2/NC. (c) Calculated H2O2 selectivity and electron transfer number n. (d) Double-layer capacitances (Cdl) of CCN, NC and Ni3N2/NC determined at 1.07 V (vs. RHE) in the CV curves to avoid the interference of Faradaic currents. (e) LSV curves of Ni3N2/NC at different rotation speeds, and (f) corresponding K-L plots and the calculated electron transfer number (n). (g) Chronopotentiometry curves of Ni3N2/NC at 0.6 V (vs. RHE) for 10 h. (h) Performance comparison of Ni3N2/NC with the reported advanced electrocatalysts. All the tests were conducted in O2-saturated 0.1 mol/L KOH electrolyte.
Figure 4
Electrochemical H-cell and flow cell performances of Ni3N2/NC. (a) LSV curves under H-cell system and (b) chronopotentiometry curves at 0.5 V for 1800 s of Ni3N2/NC with different loadings on working electrode in O2-saturated 0.1 mol/L KOH. (c) LSV curves of Ni3N2/NC in the N2-saturated 0.1 mol/L KOH with different concentrations of pre-added H2O2. (d) Schematic illustration of the assembled flow cell. (e) LSV curves and (f) chronopotentiometry curve at different current densities for the H2O2 production in flow cell. (g) H2O2 production and Faraday efficiency at different current densities, (h) chronopotentiometry curve and corresponding FEH2O2 at 40 mA/cm2 in flow cell.
Figure 5
Theoretical calculations and in-situ characterizations. (a) Optimized structures of Ni3N2/NC model from top view and front view. (b) Charge density differences (Δρ = ρA+B – ρA – ρB) of Ni3N2/NC model adsorbed *OOH. Yellow stands for electron accumulation and cyan for electron loss, the isosurface value is 0.0015 e/Bohr3. (c) Free energy diagram of O2 reduction paths where each intermediate state is kept at a realistic potential of 0.7 V (vs. RHE). (d) DOS plots of CCN, NC, Ni3N2 and Ni3N2/NC models, including the d-orbitals of Ni atom in Ni3N2 and Ni3N2/NC. (e) In situ ATR-SEIRAS of Ni3N2/NC in O2-saturated 0.1 mol/L KOH under the potential of 0.7~−0.3 V (vs. RHE).

 DownLoad:

 下载:
下载:


 下载:
下载:
