Citation:
Hui Bian, Xinyi Yuan, Nan Zhang, Zhuo Xu, Juhong Lian, Ruibin Jiang, Junqing Yan, Deng Li, Shengzhong (Frank) Liu. Correlating vacancy-defect density with CO2 activation for promoted CO2 methanation over CsPbBr3 photocatalyst[J]. Chinese Chemical Letters,
2025, 36(7): 111034.
doi:
10.1016/j.cclet.2025.111034
Correlating vacancy-defect density with CO2 activation for promoted CO2 methanation over CsPbBr3 photocatalyst
English
Correlating vacancy-defect density with CO2 activation for promoted CO2 methanation over CsPbBr3 photocatalyst
Received Date:
01 January 2025 Accepted Date:
04 March 2025 Revised Date:
27 February 2025 Available Online:
15 July 2025
Abstract:
Constructing vacancy-decorated metal halide perovskites (MHPs) have emerged as promising pathway to enhance photocatalytic activity and selectivity for solar CO2 reduction. However, the controllable construction of vacancy defects is still challenging, and our understanding of the roles of these defects, particularly their effects on the adsorption activation of surface reaction molecules, is still insufficient. Herein, we elaborately designed and synthesized adjustable Br vacancies in CsPbBr3 catalysts by manipulating the dissolution and recrystallization speed of precursors during the ball milling process using solvents with gradient polarities. We found that the Br vacancies could promote the charge separation, while having slight influence on the band structure of CsPbBr3. More importantly, temperature-programmed desorption results combined with theoretical calculations revealed that Br vacancies can significantly enhance the adsorption of CO2 and CO on the surface, specifically increasing the adsorption strength between CO and the active sites. This finding provides a substantial opportunity for achieving high activity and selectivity in photocatalytic CO2 methanation. Accordingly, a high rate of CO2 photoreduction to CH4 up to 17.94 ± 0.81 µmol g-1 h-1 along with superior selectivity of 95.8% were acquired for CsPbBr3HX featuring with the richest Br vacancy defects, which is 18.9-fold compared that of CsPbBr3CAN with the lowest Br vacancy defects. This investigation deepens insights into action mechanism of defects on halide perovskites catalysts, offering a novel strategy for the high-effective conversion of CO2 into valuable products.
Photocatalytic reduction of carbon dioxide (CO2) into valuable fuel is a promising approach to solve current energy and environmental problems [1]. Among them, the reduction of CO2 to methane (CH4) is significantly challenging due to the complex eight-electron-proton transfer process [2]. Metal halide perovskites (MHPs) possess intriguing merits of high light absorption coefficient, long charge diffusion length and adjustable band gaps, offering great potential for photocatalytic CO2 reduction [3-7].
For MHPs, the inherent soft crystal lattice property of perovskite contributes to high structural tolerance factor, which allows great tolerance to lattice mismatch or atomic deletion, providing a great opportunity for defect adjustment of perovskites materials [8]. Generally, defects in MHPs can trigger the reduced open-circuit voltage in solar cells or severe carrier recombination in LED, thus there is a negative correlation between the defect density and its efficiency [9,10]. Nevertheless, the contribution of defects should be discussed differently for field of photogenerated charges of surface catalysis and the improved charge photocatalysis. Some defects are believed to capture photogenerated charges for surface catalysis and improve charge separation efficiency, while some defects as deep energy level defects also trap photogenerated charges but inversely act as recombination center, leading to the carrier nonradiative recombination and reducing the charge separation efficiency [11-13]. Therefore, understanding defects formation mechanism and elucidating how the defects could boost a photocatalytic reaction is essential yet complex and challenging.
Aiming to address the aforementioned challenges, extensive research efforts are focused on the defect engineering of halide perovskite with enhanced capabilities [14-16]. In particularly, the introduction pathway and mechanism of halogen vacancy have been extensively investigated. He et al. reported a controllable approach to synthesize the Br vacancy-rich Cs2AgBiBr6via the visible light irradiation on the Cs2AgBiBr6 double perovskite, which indicates Br vacancies in Cs2AgBiBr6 can optimize the local atomic arrangement and electronic structure, contributing to a high charge separation efficiency [17]. Similarly, Pi et al. discovered that Cl-deficient 3D hierarchical Cs2NaBiCl6 porous microspheres were prepared via a simple grinding method by utilizing the moisture adsorption by the chlorides, revealing Cl vacancies can suppress photogenerated electron-holes recombination and reduce the free energy barrier for the generation of key intermediate [18]. These above findings disclose halogen vacancies of MHPs usually play a positive effect in photocatalysis. Nevertheless, conventional investigations pay more attention to the effect of halogen vacancies on behavior of photogenerated carriers for MHPs photocatalysis, their effects on adsorption activation of surface reaction molecules on their surfaces (such as CO2 and CO) are not well established yet. In this regard, exploring an effective and controllable preparation method of halogen defect-rich MHPs nanocrystals is of great significance but still unfulfilled.
According to the growth mechanism of halide perovskite, the density of surface vacancy defects could be elaborately designed and well controlled by manipulating its crystal growth. In this work, we added solvent to assist CsBr and PbBr2 dissolution and recrystallization during the ball milling process, and changed the polarity of the solvent to modulate the dissolution speed of CsBr and PbBr2, and then changed the crystallization growth process of CsPbBr3 to achieve the regulation of the Br vacancy density. We found the improvement of the solvent polarity benefits the increase in the crystallization of CsPbBr3, thereby declining the vacancy density. The results showed surface Br vacancies show a small effect on the energy band structure and a moderate effect on improving the photogenerated charge separation and carrier lifetime. By comparing the photocatalytic CO2 reduction activity and selectivity of CsPbBr3 with different vacancy densities, the adsorption ability of CO2 and CO on the catalysts surface is significantly activated by Br vacancies, which is responsible for the boosted catalytic activity and selectivity.
CsPbBr3 catalysts were prepared via the wet-mechanochemical ball-milling process (Fig. 1a). During the process, the solvent additives with different polarities were added and the dissolution of CsBr and PbBr2 precursors varied with the solvent polarities. According to the crystal growth theory, the crystallinity of CsPbBr3 should be tuned by adjusting the polarity of solvent. In this work, four solvents including acetonitrile (ACN), ethanol (EA), carbon tetrachloride (CT) and hexane (HX) were used, where these solvents have gradient polarities of 6.2, 4.3, 1.6, 0.06, respectively (Table S1 in Supporting information). Hence, the corresponding catalysts were denoted as CsPbBr3-ACN, -EA, -CT, and -HX, respectively. Note that the sample names are further simplified in the figures as the abbreviations of corresponding solvents.
Figure 1
Figure 1.
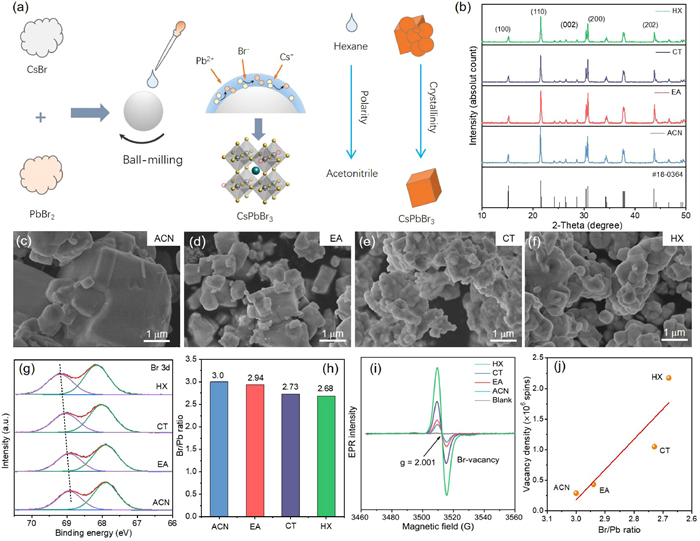
(a) Schematic of the ball-milling process to prepare CsPbBr3 using different solvents. (b) XRD patterns. (c-f) SEM images. (g) Br 3d XPS spectra. (h) Fitted results of the Br/Pb ratio. (i) EPR spectra and (j) Br vacancy density (represented by peak intensity of the EPR spectra) for different CsPbBr3 samples.
Fig. 1b shows the XRD patterns of different CsPbBr3 catalysts prepared by ball-milling method using different solvents. All CsPbBr3 samples could be indexed as the orthorhombic phase (JCPDS No. 18–0364), where the representative peaks corresponding to (100), (110), (002) and (200) planes were all observed [19]. The difference in the crystallinities of CsPbBr3 samples could be further seen from the change of the crystal morphologies (Figs. 1c-f). The CsPbBr3-ACN showed a regular grain morphology and a large grain size, indicating a good crystallinity. As the decrease of solvent polarity, the shape and size of the crystalline grains of CsPbBr3 became more irregular and smaller, corresponding to the decrease in crystallinity. Taking the CsPbBr3-ACN as the basis and setting its crystallinity as 1, the relative crystallinities of different CsPbBr3 samples were obtained by comparing the peak intensities of (110), (200) and (202) planes, which verifying the effectiveness of controlling the crystallization of CsPbBr3 by adjusting the solvent polarity (Fig. S1 in Supporting information).
It is noted that the organic solvents tend to adsorb on the CsPbBr3 surface and these organic residues could produce CO or CH4 during the photocatalytic process via photochemical reactions [20]. To eliminate the interference of organic solvents, the infrared spectroscopy technique was adopted to examine the organic residues over the CsPbBr3 catalysts (Fig. S2 in Supporting information), indicating the organics on CsPbBr3 after ball-milling were removed during the overnight heat treatment. The surface areas were further measured by the N2 adsorption/desorption isotherm, where the BET surface areas of CsPbBr3—HX, -CT, -EA, and -ACN were determined as 3.41 ± 0.29, 2.98 ± 0.18, 2.21 ± 0.04, and 1.40 ± 0.02 m2/g, respectively (Fig. S3 in Supporting information). It is concluded that the surface area of CsPbBr3 decreases with the increase of crystallinity, corresponding to the larger grain size in SEM images. X-ray photoelectron spectroscopy (XPS) was performed to study the surface element valence states of different CsPbBr3 catalysts. As shown in the C 1s spectra (Fig. S4a in Supporting information), the four CsPbBr3 samples had an identical binding energy for the C 1s peak, indicating that the carbon species are the same on the four catalysts. It further confirms that there are no solvent residues on the CsPbBr3 surface. As for the Cs 3d and Pb 4f spectra, the CsPbBr3—HX showed a slight left-shift toward a higher binding energy as compared to CsPbBr3-ACN (Figs. S4b and c in Supporting information). This shift to higher binding energy was more obvious in the Br 3d peaks for CsPbBr3—HX, comparing to the spectrum of CsPbBr3-ACN (Fig. 1g). It is also observed that the shift degree of the binding energy of Br 3d increased in the order of CsPbBr3-EA, CsPbBr3—CT, CsPbBr3—HX. Typically, a shift to higher binding energy in XPS spectra for halogen elements indicates an electron-deficient environment, which corresponds to the formation of halogen-vacancies on the surface of perovskites [17,21-23]. Thus, using CsPbBr3-ACN as a baseline for comparison, we can infer that Br vacancies are present on the surfaces of the other three CsPbBr3 samples, with vacancy density increasing in correlation with the degree of shift.
Fig. S5 (Supporting information) depicts the steady-state photoluminescence (PL) spectra of four CsPbBr3 catalysts, where all showed one emission band at ~552 nm. It is observed that the PL intensity actually decreased with the solvent polarity. In general, the PL intensity of perovskite is negatively related to the Br vacancy density [24,25]. Therefore, we can infer that the defect density of CsPbBr3—HX is the highest. Besides, the surface Br/Pb ratio of CsPbBr3 was calculated to monitor the relative Br content indirectly based on the Br 3d and Pb 4f XPS spectra, where the peak areas and atomic sensitivity factors were counted (Table S2 in Supporting information). As shown in Fig. 1h, a reduced Br/Pb ratio (2.68) was observed in the CsPbBr3—HX sample compared with the CsPbBr3-ACN (3.00). It is demonstrated that, with the polarity of solvent decreasing, the surface of CsPbBr3 changed from Br-deficient (low Br/Pb ratio) to Br-rich (high Br/Pb ratio). The Br vacancy defects of our CsPbBr3 catalysts were further detected by the low-temperature solid-state EPR spectra. As shown in Fig. 1i, all the four samples showed only one single Lorentzian line centered at a g value of about 2.001, which represents the existence of Br vacancies [26]. It is also noted that the EPR signal of CsPbBr3—HX was the highest, corresponding to the richest Br vacancies. The relationship of Br vacancy density and the Br/Pb ratio of the four CsPbBr3 samples was drawn in Fig. 1j, the calculated Br vacancy amount showed a quasi-linear relationship with the Br/Pb ratio, clearly supporting the rationality of our Br vacancy quantifications using the EPR and XPS results. To sum up, by adjusting the polarity of solvent used in the ball-milling process, the crystallinity of CsPbBr3 catalyst was changed and hence the surface Br vacancy density was controlled.
The catalytic performance of CsPbBr3 samples for solar CO2 reduction was evaluated in a flow microreactor with continuous CO2 gas and H2O vapor passing through the floating catalyst bed (Fig. S6 in Supporting information). Only CH4 and CO were detected as the carbonaceous product, while H2 was yielded as the byproduct (Fig. S7 in Supporting information) [27]. As shown in Fig. 2a, the CsPbBr3-ACN, which has the lowest Br vacancy density, only yielded low production rates of 0.95 ± 0.08 and 0.56 ± 0.08 µmol g-1 h-1 for CH4 and CO evolving, respectively. On the contrary, the CsPbBr3—HX, which has the richest Br vacancy defects, showed the highest activity for solar CO2 reduction with CH4 and CO production rates being 17.94 ± 0.81 and 1.06 ± 0.12 µmol g-1 h-1, respectively. When we counted the number of electrons participating in CO2 reduction and took the difference of BET surface areas into consideration, it was found that the surface area-normalized electron consumption rate of CsPbBr3 for solar CO2 reduction is positively related to the Br vacancy density (Fig. 2b), demonstrating that the Br vacancy would facilitate the photocatalytic CO2 reduction over CsPbBr3 catalysts.
Figure 2
Figure 2.
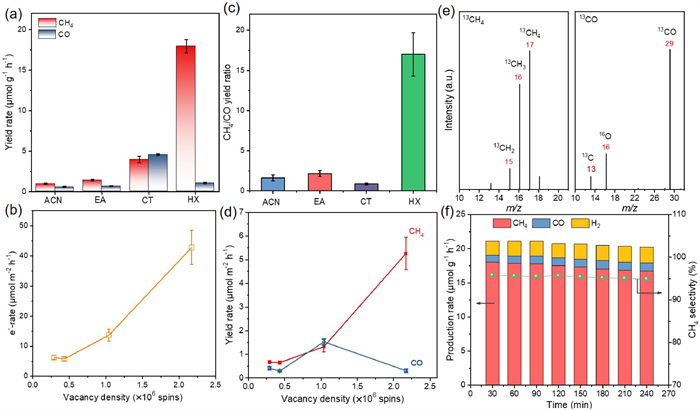
(a) Production rates of CH4 and CO. (b) Relationship between Br vacancy quasi-density and the surface area-normalized electron consumption rate. (c) The ratio of CH4/CO production rate. (d) Relationship between Br vacancy quasi-density and the surface area-normalized production rate of CH4 and CO. (e) 13CH4 and 13CO mass spectra for 13CO2 photocatalytic reduction on CsPbBr3—HX. (f) Stability test of CsPbBr3—HX at 150 ℃ under 3 sun irradiation.
The product selectivity of different CsPbBr3 catalysts was further investigated. As we compared the ratio of production rates for CH4 and CO, it is shown that the CH4/CO yield ratio of CsPbBr3—CT was only 0.87, while that of CsPbBr3—HX was 16.99, which is much higher than the others (1.63 for CsPbBr3-ACN and 2.16 for CsPbBr3-EA) (Fig. 2c). The CH4 selectivity for the four samples was further calculated, where CsPbBr3—HX demonstrated the highest value of 95.8% (75.6%, 79.4% and 73.2% for CsPbBr3-ACN, -EA, -CT, respectively) (Fig. S8 in Supporting information). The photocatalytic performance of CsPbBr3—HX in this work exceeds most of reported CsPbBr3-based photocatalysts (Table S5 in Supporting information). As shown in Fig. 2d, the normalized yield rate of CH4 is positively related to the Br vacancy density, while that of CO shows a volcanic relationship with the Br vacancy density. It is suggested that, besides determining the photocatalytic activity of CsPbBr3, the Br vacancy also affects the product selectivity.
To consolidate the above findings, the carbon source of CH4 products was investigated via the 13C-labeled isotopic test, where 13CO2 was used as the reactants. The mass spectra of collected gaseous products matched well with the 13CH4 and 13CO chemicals (Fig. 2e), verifying that these products are reduced from the CO2 input. In addition, the stability of the champion photocatalyst, CsPbBr3—HX, for solar CO2 conversion was studied. During the test, CH4, CO and H2 were continuously produced with the CH4 selectivity keeping at around 95% (Fig. 2f). After 4-h test, the CsPbBr3—HX catalyst maintained more than 92% of its initial activity for the production of CH4 (from 18.02 µmol g-1 h-1 to 16.70 µmol g-1 h-1), demonstrating a reasonable durability for photocatalytic CO2 reduction. To unravel the origins of CH4 selectivity, we investigated the effects of Br vacancy on the photocatalytic processes, including light absorption, charge separation, and surface reaction.
Fig. S9 (Supporting information) displays the UV–vis spectra of different CsPbBr3 samples. The four catalysts showed small difference in the light absorbance and absorption edges. It is indicated that the surface Br vacancies have not formed the intra-band defect states and hence there is no defect-induced light absorption for our CsPbBr3 catalysts [28]. The energy band gaps (Eg) of the four catalysts were further determined by the Tauc plots (Fig. S10 in Supporting information), where the Eg for CsPbBr3-ACN, -EA, -CT, and -HX were 2.28, 2.27, 2.27 and 2.27 eV, respectively. The band structures were further obtained by determining the Fermi energy level (Ef), the conduction band minimum (ECBM), and the valence band maximum (EVBM) via the Eg and ultraviolet photoelectron spectroscopy (Table S3 in Supporting information). As shown in the schematic of band diagrams in Fig. S11 (Supporting information), the Br vacancy would gradually uplift the ECBM and EVBM of CsPbBr3 by less than 0.1 eV following the sequence of CsPbBr3-ACN, -EA, -CT, and -HX. Therefore, the Br vacancies have little influence on the band structure of CsPbBr3, which would not contribute to the rather big difference in the photocatalytic activities.
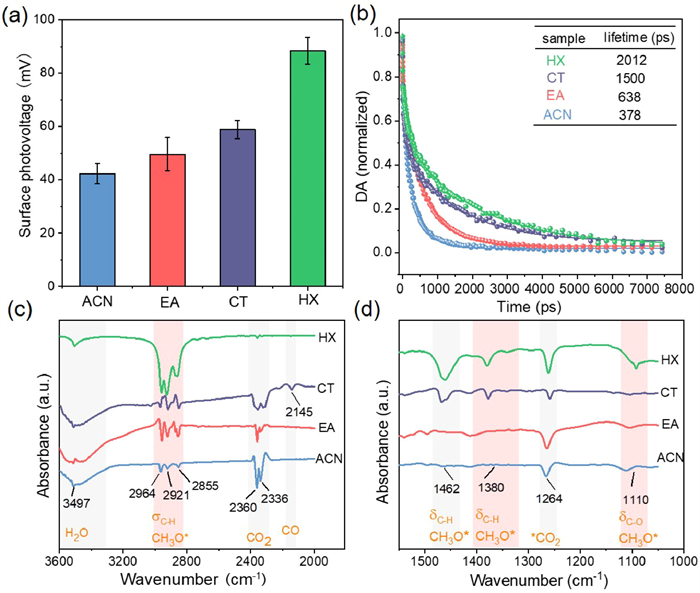
The effect of Br vacancy defects on the charge separation of CsPbBr3 was then investigated by the surface photovoltage (SPV) and femtosecond transient absorption (TA) spectra. Fig. 3a shows the measured SPV signals of different CsPbBr3 samples. CsPbBr3—HX with abundant Br vacancy defects demonstrated the largest SPV signal, reaching 88.4 ± 5.0 mV, while CsPbBr3-ACN with the least Br vacancy density had the smallest SPV value of 42.3 ± 3.9 mV. As the signal of SPV is directly related to the accumulation of surface charges upon irradiation, the value of SPV then measures the charge separation ability of the photocatalyst [29]. Therefore, it is suggested that the surface Br vacancy defects could facilitate the charge separation process by acting as charge-trapping states.
Figure 3
Figure 3.
(a) Surface photovoltage plots. (b) Transient absorption spectroscopy curves. In-situ DRIFT spectra of CsPbBr3 prepared with different solvents: Wavelength range of 1810–3600 cm-1 (c), and 1000–1550 cm-1 (d). Test process: Before test, the reaction cell was purged with Ar at a flow rate of 30 sccm and heated at 150 ℃ for 20 min. Then, the gas input was switched to CO2 and H2O vapor at a flow rate of 5 sccm. A background spectrum was collected after a 15 min equilibrium. The light was then turned on and the in-situ spectra after 20 min equilibrium were recorded.
The charge carrier dynamics was further analyzed by the TA spectra. As shown in Fig. S12 and Table S4 (Supporting information), the TA kinetics probed at ~517 nm showed a typical absorption decay, from which the lifetime of photogenerated holes can be determined [15]. As shown in Fig. 3b, the hole signal of CsPbBr3—HX demonstrated the slowest decay kinetics as compared to the others, corresponding to the longest hole-lifetime of 2012.1 ps. As a contrast, the absorption decay of CsPbBr3-ACN is the fastest among them and the lifetime is only 378.6 ps. It is clear that the Br vacancy defects would prolong the lifetime of the photogenerated holes. Hence, for the charge separation part, the Br vacancy defects is supposed to promote the charge separation, allowing more photogenerated charges to survive for the surface catalytic CO2 reaction.
To further confirm the nature of defect-induced photocatalytic process, the effect of Br vacancy defects on the surface catalytic process was investigated. We first study the reaction mechanism by probing the possible reaction intermediates with in-situ DRIFT spectra. Figs. 3c and d display the acquired in-situ DRIFT spectra for photocatalytic CO2 reduction on different CsPbBr3 catalysts at 150 ℃ after 20 min illumination. For all the four samples, the characteristic bands of H2O at 3497 cm-1 and CO2 at 2360 and 2336 cm-1 were all observed [30,31]. Notably, the peak at 2145 cm-1 corresponding to CO was only observed in spectrum of CT-CsPbBr3, which is consistent with the high production rate of CO over CT-CsPbBr3. In addition, the carboxylate species of *CO2 were also identified from the bands at 1610 and 1264 cm-1, implying that the adsorbed CO2 molecules were activated in the same way on the four samples. The three peaks in range of 2975–2840 cm-1, which are characteristics of C—H stretch bands (σC) for CH3 group, correspond to the signals from absorbed methane (CH4), methyl intermediate (CH3*) and/or methoxyl intermediate (CH3O*). The corresponding C—H vibration bands (δC) of CH3 at 1462 and 1380 cm-1 were also observed for all the four samples. Furthermore, an obvious peak at ~1110 cm-1 was detected in all spectra of different samples, which band is the characteristic of C—O stretch bands (σC) [32]. Then, it is supposed that the CH3O* intermediate is involved in the photocatalytic CO2 reduction over the four CsPbBr3 catalysts. Therefore, it is concluded that the Br vacancy defects tend not to change the reaction pathway for photocatalytic CO2 reduction over CsPbBr3.
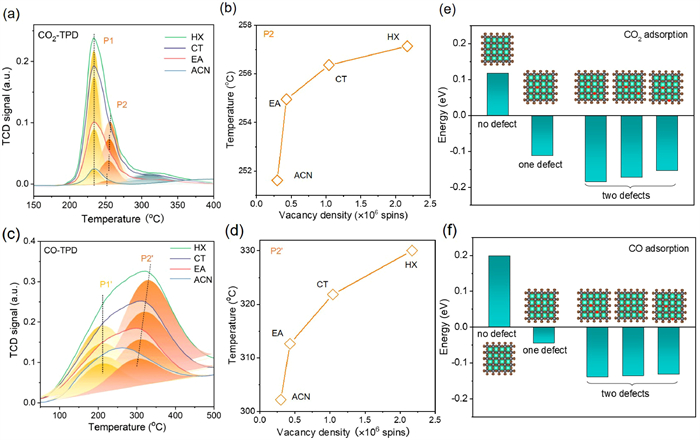
We then put our focus on the adsorption and activation of surface reactants of the role of Br vacancies, where the two molecules of CO2 and CO were examined. Temperature-programmed desorption (TPD) technique was adopted to evaluate the interaction between the molecules and the catalytic sites [33,34]. As shown in the CO2-TPD curves in Fig. 4a, the former CO2 desorption peaks of four samples located at P1 had identical peak temperature (233 ± 1 ℃), corresponding to same CO2 adsorption sites. While, the latter peaks of CsPbBr3-ACN, -EA, -CT, and -HX located at P2 showed peak temperatures of 251.7, 254.5, 256.6, and 257.5 ℃ (Fig. 4b), respectively, where the desorption temperature increased with the Br-vacancy density, revealing that the vacancy-relevant sites deliver an enhanced interaction with the adsorbed CO2 molecules. Furthermore, the amounts of CO2 adsorbed could also be derived from the integrated area of the desorption peak. By further normalizing the adsorption amount to the BET surface area and relating this amount to the defect density, it is found that the total normalized adsorption amount of CO2 on CsPbBr3 increased with the vacancy density together with a gradually decrease rate (Fig. S13a in Supporting information). This phenomenon could be explained by the vacancy-induced chemisorption of CO2 on CsPbBr3: initially, the adsorbing capacity of CO2 increased with the density of Br vacancy defects; then, as the chemisorbed CO2 on the surface gradually became saturated, the adsorbing capacity tended to reach a plateau with further increasing Br vacancy density. Therefore, the increased CO2 adsorption induced by the Br vacancy defects is thought to accelerate surface reactions and hence improve the activity.
Figure 4
Figure 4.
(a) CO2-TPD and (b) the change of adsorption temperature at P2 desorption peaks for CO2-TPD. (c) CO-TPD and (d) the change of adsorption temperature at P2′ desorption peaks for CO-TPD. (e) CO2 and (f) CO adsorption energy of CsPbBr3 with different number of defects.
The CO adsorption on the surface sites of CsPbBr3 was also investigated to reveal the cause for the change of CH4 productivity, given that *CO is one of the key intermediates for CH4 production. As shown in Fig. 4c, the CO-TPD curves of different samples all showed desorption peaks located at P1′ and P2′, corresponding to the chemisorption of CO at the reactive sites. Similarly, the CO desorption peaks of four samples located at P1′ had fixed peak temperature corresponding to same CO adsorption sites. It is also observed that the desorption temperature of CO became higher ranging from 302 ℃ to 330 ℃ for P2′ desorption peak when the polarity of the solvents increased (Fig. 4d). It is concluded that the interaction between the active sites and the CO molecular is enhanced along with the enrichment of surface Br vacancies. In addition, it is found that the total normalized adsorption amount of CO located at P2′ on CsPbBr3 displays continuous upsurge with the increase of defect density (Fig. S13b in Supporting information). Nevertheless, the strong interaction, along with sufficient amount of CO adsorption, contribute to the high selectivity of CH4. As a result, due to weak CO interaction and insufficient CO adsorption amount, CsPbBr3—CT exhibited the lowest value of CH4 selectivity, while the opposite case is observed for CsPbBr3—HX. These findings suggested that Br vacancy defects favor to improve CO adsorption capacity, thus leading to high CH4 selectivity. This was mainly attributed to the fact that vacancies tended to change the local charge density on the surface, which helped to break the chemical bonds between molecules and increased the interaction between adsorbed molecules and the catalyst surface during the catalytic process, thereby improving the adsorption of CO2 and CO [26,35].
Further, the high activity and selectivity mechanism induced by Br vacancy defects through DFT calculations was investigated. Theoretically, different kinds of vacancies on catalyst are closely related to the CO2 and CO adsorption energy, thereby achieving the tailored regulation of activity and selectivity [36,37]. To this end, upon keeping the crystal structural stability of perovskite, we then constructed series of Br vacancy defects with different numbers and sites using the Vienna ab initio Simulation Package (VASP). The CO2 and CO adsorption energy of CsPbBr3 catalyst depending on Br vacancy defects with different numbers and sites were presented in Figs. 4e and f. The value of adsorption energy of CO2 is positive with the absence of any defects. On the contrary, the adsorption energy of CO2 and CO change from positive to negative in the presence of defects, and the adsorption energy of two defects was significantly lower than that of a single defect. This firmly implied the increase in Br vacancy defects significantly contributed to CO2 and CO adsorption in photocatalyst CO2 reduction. More importantly, no matter where the two defects are distributed in the crystal, its adsorption energy of CO2 is significantly lower than that of one defect. This indicates that the number of defects, rather than their locations, has a significant influence on the adsorption energy. Such distinctive variations in adsorption energy definitely demonstrate that the numbers of Br vacancy defects are beneficial to promote the enhancement of catalytic activity and selectivity.
In this work, we developed a series of CsPbBr3 photocatalysts with adjustable surface Br vacancies defects via the ball milling method using solvents with different polarities for highly efficient and selective photocatalytic CO2 reduction in a solid-gas phase reaction. Benefiting from Br vacancy defects, the carrier separation capacity and adsorption of CO2 and CO molecules have been boosted, thereby accelerating surface reaction kinetics in catalytic process. In addition, the interaction between the active sites and the CO molecular is enhanced as surface Br vacancies upsurge, resulting in a decrease in the production of the two-electron CO and concurrently improving the eight-electron reaction. Consequently, the richest Br vacancy defects endow CsPbBr3—HX with high rate of CO2 photoreduction to CH4 up to 17.94 ± 0.81 µmol g-1 h-1 along with superior selectivity of 95.8%, which is 18.9-fold compared that of CsPbBr3—CAN with the lowest Br vacancy defects. This work proposes a simple method to synthesize a Br vacancy rich CsPbBr3 and opens an entrance to substantially enhance the photocatalytic activity and selectivity.
Declaration of competing interest
The authors declare that they have no known competing financial interests or personal relationships that could have appeared to influence the work reported in this paper.
CRediT authorship contribution statement
Hui Bian: Writing – original draft. Xinyi Yuan: Writing – original draft. Nan Zhang: Data curation. Zhuo Xu: Resources. Juhong Lian: Writing – original draft. Ruibin Jiang: Writing – review & editing. Junqing Yan: Writing – review & editing. Deng Li: Writing – review & editing. Shengzhong (Frank) Liu: Writing – review & editing.
Acknowledgments
This work was financially supported by the National Natural Science Foundation of China (Nos. 22072081, 22302148), the Nature Science Foundation of Shaanxi in China (No. 2024JC-YBQN-0468), Scientific Research Program Funded by Education Department of Shaanxi Provincal Government (Nos. 22JK0379, 24JK0665) and Youth Talent Scientific Research Program Funded by Weinan Normal University (No. 2022RC17).
Supplementary materials
Supplementary material associated with this article can be found, in the online version, at doi:10.1016/j.cclet.2025.111034.
L. Song, Q. Zhang, S. Ullah, et al., J. Mater. Chem. C 11 (2023) 4526–4535. doi: 10.1039/d3tc00406f
[26]
Y. Wang, Q. Zhou, Y. Zhu, et al., Appl. Catal. B 294 (2021) 120236.
[27]
Y. Li, C. Wang, M. Song, et al., Appl. Catal. B 243 (2019) 760–770.
[28]
L. Wang, B. Zhu, J. Zhang, et al., Matter 5 (2022) 4187–4211.
[29]
B.N. Choi, J.Y. Seo, Z. An, et al., Chem. Eng. J. 430 (2022) 132807.
[30]
B. He, P. Xiao, S. Wan, et al., Angew. Chem. Int. Ed. 62 (2023) e202313172.
[31]
H. Bian, T. Liu, D. Li, et al., Chem. Eng. J. 435 (2022) 135071.
[32]
X. Yue, L. Cheng, J. Fan, et al., Appl. Catal. B 304 (2022) 120979.
[33]
W. Yan, Y. Zhang, Y. Bi, Angew. Chem. Int. Ed. 63 (2024) e202316459.
[34]
Q. Ren, Y. He, H. Wang, et al., Research 6 (2023) 0244.
[35]
X. Yan, C. Duan, S. Yu, et al., J. CO2 Util. 79 (2024) 102648.
[36]
S. Cheng, Z. Sun, K.H. Lim, et al., Appl. Catal. B 343 (2024) 123583.
[37]
N.H. Kwon, J. Park, X. Jin, et al., ACS Nano 17 (2023) 23732–23745. doi: 10.1021/acsnano.3c07566
Figure 1
(a) Schematic of the ball-milling process to prepare CsPbBr3 using different solvents. (b) XRD patterns. (c-f) SEM images. (g) Br 3d XPS spectra. (h) Fitted results of the Br/Pb ratio. (i) EPR spectra and (j) Br vacancy density (represented by peak intensity of the EPR spectra) for different CsPbBr3 samples.
Figure 2
(a) Production rates of CH4 and CO. (b) Relationship between Br vacancy quasi-density and the surface area-normalized electron consumption rate. (c) The ratio of CH4/CO production rate. (d) Relationship between Br vacancy quasi-density and the surface area-normalized production rate of CH4 and CO. (e) 13CH4 and 13CO mass spectra for 13CO2 photocatalytic reduction on CsPbBr3—HX. (f) Stability test of CsPbBr3—HX at 150 ℃ under 3 sun irradiation.
Figure 3
(a) Surface photovoltage plots. (b) Transient absorption spectroscopy curves. In-situ DRIFT spectra of CsPbBr3 prepared with different solvents: Wavelength range of 1810–3600 cm-1 (c), and 1000–1550 cm-1 (d). Test process: Before test, the reaction cell was purged with Ar at a flow rate of 30 sccm and heated at 150 ℃ for 20 min. Then, the gas input was switched to CO2 and H2O vapor at a flow rate of 5 sccm. A background spectrum was collected after a 15 min equilibrium. The light was then turned on and the in-situ spectra after 20 min equilibrium were recorded.
Figure 4
(a) CO2-TPD and (b) the change of adsorption temperature at P2 desorption peaks for CO2-TPD. (c) CO-TPD and (d) the change of adsorption temperature at P2′ desorption peaks for CO-TPD. (e) CO2 and (f) CO adsorption energy of CsPbBr3 with different number of defects.

 DownLoad:

 下载:
下载:


 下载:
下载:
