Citation:
Runzi Cao, Heng Shao, Xinjie Wang, Jian Wang, Enxiang Shang, Yang Li. Photocatalytic production of high-value-added fuels from biodegradable PBAT by Nb2O5/GCN heterojunction catalyst: Performance and mechanism[J]. Chinese Chemical Letters,
2025, 36(7): 111029.
doi:
10.1016/j.cclet.2025.111029
Photocatalytic production of high-value-added fuels from biodegradable PBAT by Nb2O5/GCN heterojunction catalyst: Performance and mechanism
English
Photocatalytic production of high-value-added fuels from biodegradable PBAT by Nb2O5/GCN heterojunction catalyst: Performance and mechanism
Key Laboratory of Water and Sediment Sciences of Ministry of Education, State Key Laboratory of Water Environment Simulation, School of Environment, Beijing Normal University, Beijing 100875, China
b.
College of Science and Technology, Hebei Agricultural University, Huanghua 061100, China
* Corresponding authors. E-mail addresses: shangenx@163.com (E. Shang)
Received Date:
30 September 2024 Accepted Date:
02 March 2025 Revised Date:
27 December 2024 Available Online:
15 July 2025
Abstract:
Photocatalysis holds great promise for the conversion of plastic waste into valuable chemicals. However, the conversion efficiency is constrained by the poor carriers' separation efficiency over the single component photocatalyst. Herein, we synthesized a novel type Ⅱ Nb2O5/GCN heterojunction to investigate its efficiency in the photocatalytic upcycling of polybutylene adipate/terephthalate (PBAT) microplastics (MPs) into acids and alcohols under visible light irradiation (100 mW/cm2). The findings indicate that the charge transfer within the type Ⅱ Nb2O5/GCN occurs from the conduction band of GCN to the conduction band of Nb2O5, thereby enhancing the separation efficiency of carriers Notably, the rates of ethanol and acetic acid generation from 1.5 mg/mL PBAT MPs treated with the 60%Nb2O5/GCN photocatalyst were 21.8-fold and 1.8-fold higher, respectively, compared to those by Nb2O5 alone. Density functional theory calculations demonstrate that the hydroxyl radicals (•OH) produced by the Nb2O5/GCN heterojunction cleaves the ester bond (OC=O) of PBAT MP into the monomer. These monomers are subsequently converted into acids and alcohols through various reactions, including CC bond cleavage, hydrodeoxygenation, and CC bond coupling. This study highlights the effectiveness of heterojunction photocatalyst in converting PBAT MPs into valuable chemicals, thus significantly promoting advancements in bioplastics recycling.
The serious environmental pollution caused by traditional plastics has promoted the development of biodegradable plastics [1]. The European Biodegradable Plastics Association predicts that the annual production capacity of these biodegradable plastics will reach 3.556 million tons by 2027 [2]. Poly(butylene adipate-co-terephthalate) (PBAT), known for its excellent biodegradability, accounts for the largest proportion (19%) of all biodegradable plastics [3]. Notably, the production cost of PBAT tripled compared to traditional plastics like polyethylene (PE) and polypropylene (PP) from 2020 to 2022. Notably, these biodegradable plastics decompose into microplastics (MPs) or even nanoplastics (NPs) within relatively short periods (<180 days) [4-6]. These particles are capable of penetrating biological membranes, inducing oxidative stress effects, and causing toxicity to organisms [7-10]. Furthermore, these waste plastic particles may release adsorbed toxic substances, such as organic pollutants and heavy metals, within organisms, thereby exacerbating harm to ecosystems and human health [11, 12]. Consequently, it is highly desirable to explore simple and efficient method to dispose these biodegradable plastics wastes and further upgrade them into high-value-added fuels.
Most bioplastics recycling studies have focused on electrochemical and ionic liquid recycling methods [13, 14], which are energy-intensive and high cost. In contrast, the photocatalysis for plastic recycling is emerging as environmentally friendly and cost-effective technology that enables the production of high-value-added fuels [15, 16]. Under visible light illumination, photocatalyst generate reactive oxygen radicals (ROS), holes (h+), and electrons (e-). ROS and h+ primarily facilitate the oxidation of plastics into CO2 [17-19]. Furthermore, the photoinduced C—C coupling mechanism utilizes e- to convert the generated CO2 into carbon-based fuels [18]. Therefore, the selection of an appropriate photocatalyst plays a crucial role in the effective conversion of PBAT MPs into high-value-added fuels.
Niobium pentoxide (Nb2O5), known for its abundance on Earth and exceptional stability as a photocatalyst, has its valence band (VB) maximum and conduction band (CB) minimum at +2.5 V and −0.9 V vs. NHE at pH 7, respectively [18, 20]. These characteristics offer a promising avenue for the mineralization of waste plastics into CO2, followed by their reduction to carbon-based fuels. Jiao et al. have synthesized single-unit-cell thick Nb2O5 layers. They reported the highly selective conversion of various waste non-biodegradable plastics into C2 fuels under Xe lamp irradiation through a two-step process, where single-use bags, disposable food containers, food wrap films, primarily composed of PE, PP, and polyvinyl chloride (PVC), are transformed into CH3COOH via Nb2O5 layers [16]. The complete photodegradation involves photoinduced C—C bond cleavage (Eqs. 1 and 2) and C—C coupling pathways (Eqs. 3-5) [21]. Despite progress in the photocatalytic reformation of non-biodegradable plastic (PE/PP/PVC), the photocatalytic conversion of biodegradable plastics into high-value-added fuels is still nascent. The two-step method offers a promising photocatalytic approach for the upgrade recycling of biodegradable plastics. However, the single component catalyst is used for both oxidative degradation and plastics reduction, and its catalyst carrier separation rate is low, resulting in poor CO2 photoreduction activity and low CH3COOH generation yield (18.8–47.4 µg gcata-1 h-1). Therefore, rationally designing a two-component photocatalyst that promotes photoinduced carriers' separation is crucial.
Typically, constructing heterojunctions as a two-component photocatalyst is considered as one of the most effective strategies to enhance the spatial separation rate of carriers in catalysts [22, 23]. Graphitic carbon nitride (GCN) has an appropriate bandgap width of 2.7 eV, with its CB at −1.12 eV and VB at 1.58 eV, enabling it to absorb visible light [18, 24]. The appropriate differences in band structure between Nb2O5 and GCN provide the potential for forming a type Ⅱ heterojunction. Additionally, 2D/2D heterostructures offer a large reaction interface and abundant active sites, which are beneficial for promoting photoinduced electron-hole separation and transfer. Inspired by these advantages, we hypothesize that the 2D/2D type Ⅱ heterostructure established by Nb2O5 and GCN. It will not only improve the efficiency of carrier's separation and transfer but also enhance CO2 photoreduction, and ultimately improve the efficiency of plastic-to-fuel photoconversion.
In this work, we fabricated a unique Nb2O5/GCN type Ⅱ heterojunction to assess its efficiency in transforming PBAT MPs into high-value-added fuels. The physicochemical properties and electron transfer pathways of heterojunctions were investigated using transmission electron microscopy, X-ray photoelectron spectroscopy (XPS), X-ray diffraction (XRD) spectroscopy, and electrochemical testing. Fourier transform infrared spectroscopy and XPS are utilized to analyze alterations in the functional groups of PBAT MPs after photocatalysis. The influence of varying catalyst types and microplastic concentrations on the photocatalytic efficiency was also evaluated. Additionally, the ROS produced by the photocatalyst and the degradation intermediates were identified. Density functional theory calculations confirmed the charge transfer mechanism of Nb2O5/GCN and explored the potential ROS attack sites on PBAT MPs. Finally, the mechanisms and pathways for the photocatalytic transformation of plastics into acids and alcohols were elucidated. This work underscores the potential of heterojunction catalysts in the photocatalytic conversion of PBAT MPs into high-value-added fuels, significantly supporting the recycling of biodegradable plastics.
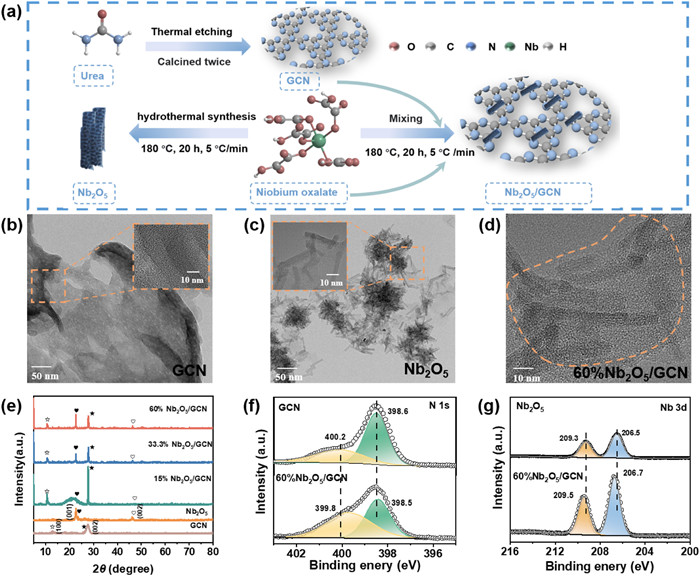
Urea is utilized in the thermal etching process to produce GCN, and niobium oxalate is employed for the synthesis of Nb2O5. Subsequently, GCN and Nb2O5 are combined and synthesized into Nb2O5/GCN through a hydrothermal process, as illustrated in Fig. 1a. The chemicals information and the detailed synthesis method are provided in Texts S1 and S2 (Supporting information), respectively. The morphological characteristics of exfoliated GCN, Nb2O5, and xNb2O5/GCN photocatalyst (x = 15%, 33.3% and 60%) are depicted in Figs. 1b-d and Fig. S1 (Supporting information). The exfoliated GCN appears a smooth surface with a two-dimensional sheet-like structure (Fig. 1b). In contrast, Nb2O5 is characterized by its nanotube (NTs) formation, which tends to agglomerate (Fig. 1c, Fig. S1a). The introduction of Nb2O5 NTs to GCN leads to a noticeable change in GCN's surface morphology (Fig. 1d, Figs. S1b and c). With a 15% loading of Nb2O5, the Nb2O5 agglomerates are sparsely distributed on the surface of GCN (Fig. S1b). As the loading of Nb2O5 NTs increases to 33.3% and 60%, the distribution of Nb2O5 on the GCN surface becomes more uniform, indicating a more effective embedding on the GCN surface (Fig. 1d, Figs. S1c-e). These observations imply that Nb2O5 NTs form integrated composite structures with the lamellar structure of GCN.
Figure 1
Figure 1.
(a) Catalyst synthesis strategy and (b-d) HRTEM images of GCN, Nb2O5, and 60%Nb2O5/GCN photocatalyst. (e) XRD patterns of GCN, Nb2O5, and xNb2O5/GCN (x = 15%, 33.3%, and 60%). High-resolution XPS spectra of (f) N 1s for GCN and 60%Nb2O5/GCN photocatalyst, (g) Nb 3d for Nb2O5 and 60%Nb2O5/GCN photocatalyst.
The XRD patterns of GCN, Nb2O5, and xNb2O5/GCN (x = 15%, 33.3% and 60%) catalysts are provided in Fig. 1e. Nb2O5 NTs displayed two prominent peaks at 22.8° and 46.2°, which correspond to the (001) and (002) crystal planes, respectively (JCPDS No. 30–0873) [25]. The characteristic peaks of GCN at 12.9° and 27.4° are attributed to its (100) and (002) crystal planes, respectively [26]. The Nb2O5/GCN composite catalysts exhibited combined characteristic peaks from the (100) and (002) crystal planes of GCN and the (001) and (002) crystal planes of Nb2O5. As the Nb2O5 loading increases from 15% to 60%, there is a noticeable decline in the (100) crystal planes of GCN because the doping of Nb2O5 changes the structure of original GCN. The peaks corresponding to Nb2O5 NTs become increased, indicating a significant coupling between GCN and Nb2O5.
The XPS survey spectra show that 60%Nb2O5/GCN contains the element characteristic of both GCN (C and N) and Nb2O5 (O and Nb) catalysts (Fig. S2 in Supporting information). The high-resolution C 1s spectrum of 60%Nb2O5/GCN exhibit two primary peaks at 284.8 eV and 288.2 eV, respectively (Fig. S3a in Supporting information). The peak at 284.8 eV, with relatively low intensity, is assigned to the sp2 C−C bonds, which is used as a standard to calibrate the XPS binding energies [26]. The peak at 288.2 eV is attributed to the coordination between carbon atom and three nitrogen atoms in the GCN lattice (N–C=N2) [27]. In the high-resolution N 1s spectrum of the GCN catalyst (Fig. 1f), the predominant peaks at 400.2 eV and 398.6 eV correspond to the tertiary nitrogen (N-(C)3) groups and the sp2-hybridized N (C=N−C), respectively [28, 29]. For the 60%Nb2O5/GCN, the main N 1s peaks are observed at 399.8 eV and 398.5 eV. These peaks exhibit a shift to lower binding energies compared to pure GCN. This shift indicates that GCN gains electron within the Nb2O5/GCN composites [30].
The high-resolution O 1s spectrum of 60%Nb2O5/GCN photocatalyst (Fig. S3b in Supporting information) exhibits two distinct peaks. These peaks are ascribed to the Nb−O bond at 529.8 eV and the oxygen vacancies at 531.6 eV [25]. In the Nb (3d) spectrum of Nb2O5 (Fig. 1g), two subpeaks are observed at 209.3 eV and 206.5 eV, corresponding to the Nb−O and Nb−O−C bonds, respectively. These two peaks undergo a shift to 209.5 eV and 206.7 eV in the 60%Nb2O5/GCN catalyst. This shift towards higher binding energies for the 60%Nb2O5/GCN, in comparison to pure Nb2O5, indicates a significant interaction between Nb2O5 and GCN, and Nb2O5 loss electron [30]. By analyzing the shifts in the N 1s and Nb 3d spectra and considering the structural variances between the two semiconductors, we can deduce that the electrons were transferred from Nb2O5 to GCN during the catalyst synthesis process. These results indicate intimate contact and strong chemical interaction formed between Nb2O5 and GCN in the 2D/2D heterostructure.
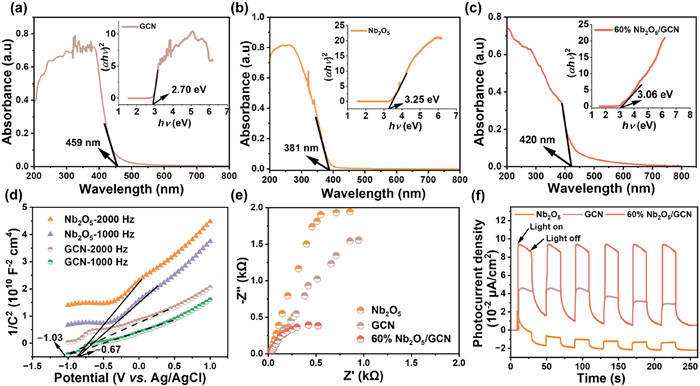
The optical properties of materials significantly influence their photocatalytic efficiency. The bandgaps of GCN, Nb2O5, 15%Nb2O5/GCN, 33.3%Nb2O5/GCN, and 60%Nb2O5/GCN catalysts were determined to be 2.70 eV, 3.25 eV, 2.76 eV, 3.10 eV, and 3.06 eV, respectively (Figs. 2a-c and Fig. S4 in Supporting information). Analysis of the M-S plots revealed that the flat band potentials of GCN and Nb2O5 were −1.03 V and −0.67 V (vs. Ag/AgCl), respectively (Fig. 2d). For n-type semiconductors, the conduction band potential (ECB) is typically 0.2 V below the flat band potential [31]. Hence, the ECB for GCN and Nb2O5 were deduced to be −1.23 V and −0.87 V (vs. Ag/AgCl), respectively. The ECB relative to standard hydrogen electrode (NHE) potentials are determined to be −1.03 V and −0.67 V for GCN and Nb2O5, respectively (E (NHE) = E (Ag/AgCl) + 0.197). Subsequently, the valence band potentials (EVB, EVB = Eg + ECB) of GCN and Nb2O5 were established at 1.67 V and 2.58 V (vs. NHE).
Figure 2
Figure 2.
Ultraviolet-visible diffuse reflectance spectra and Tauc plot (inset) for (a) GCN, (b) Nb2O5, (c) 60%Nb2O5/GCN, (d) Mott–Schottky plots for Nb2O5 and GCN at 1000 Hz and 2000 Hz (V vs. Ag/AgCl), (e) EIS analysis and (f) periodic photocurrent density (I-t) plot for Nb2O5, GCN, and 60%Nb2O5/GCN.
The quantitative results from electrochemical impedance spectroscopy (EIS) analysis are depicted in Fig. 2e, where the 60%Nb2O5/GCN catalyst exhibits the smallest Nyquist radius compared to the individual GCN and Nb2O5 catalysts. This indicates that the type Ⅱ heterojunction structure effectively enhances carrier separation by reducing recombination. Fig. 2f illustrates the photocurrent density of various photocatalyst under periodic ON/OFF light cycles. Specifically, the peak photocurrent densities are 0.09 µA/cm2 for GCN, −0.0014 µA/cm2 for Nb2O5, and 0.11 µA/cm2 for 60%Nb2O5/GCN at the specified voltage. Notably, the 60%Nb2O5/GCN shows superior photocurrent densities compared to those of GCN and Nb2O5 alone. indicating an improvement in photogenerated electron transfer [32]. In summary, the 60%Nb2O5/GCN heterojunction shows outstanding visible light absorption capacity and photogenerated carrier separation efficiency compared to the individual catalysts.
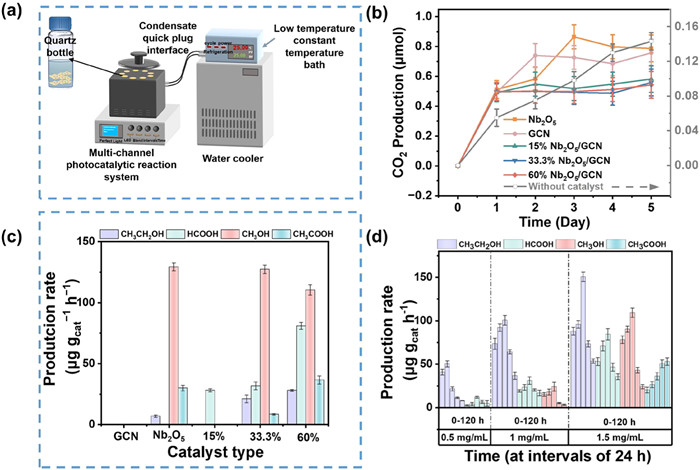
Fig. 3a illustrates the multi-channel photocatalytic reaction system, which includes a LED light source with adjustable light intensity, magnetic stirrer, and temperature control device. The spectrum of the LED lamp has been provided in our published paper [33]. As depicted in Fig. 3b, PBAT MPs produced only 0.143 µmol CO2 after 5-day visible light irradiation, indicating the degradation of PBAT MPs is weak under light irradiation. The treatment of PBAT MPs with GCN resulted in generation of 0.758 µmol CO2 under visible light exposure over a 5-day period, and the gas chromatogram of CO2 was shown in Fig. S5 (Supporting information). These findings are consistent with previous studies, which demonstrate that GCN catalyst can degrade PBAT MPs into CO2 by h+ and •OH under visible light irradiation in oxygen-rich environments [34-36]. The detection method of the liquid products is provided in Text S3 (Supporting information). Notably, no detectable quantities of liquid by-products, such as acids and alcohols, were detected by 1H-nuclear magnetic resonance (1H NMR) (Fig. S6 in Supporting information) during the photodegradation of PBAT MPs using GCN (Fig. 3c). Theoretically, GCN possesses the capability to reduce CO2 into acids and alcohols, as given by its lower ECB value (−1.03 V vs. NHE) compared to the redox potentials of acids (−0.61 ~ −0.6 V vs. NHE) and alcohols (−0.38 ~ −0.33 V vs. NHE) [18, 37]. This lack of detectable acids and alcohols is likely due to the rapid recombination of photogenerated carriers within GCN catalyst. In the Nb2O5 photocatalytic system, both CO2 gas and liquid products such as CH3COOH, CH3OH, and CH3CH2OH, were detected under visible light irradiation (Figs. 3b and c). The ECB value of Nb2O5 (−0.67 V vs. NHE) was negative than the redox potential for generating acids and alcohols, promoting the generation of carbon-based fuels.
Figure 3
Figure 3.
(a) Photocatalytic device, (b) CO2 production kinetics, (c) production rate of acids and alcohols during PBAT MPs photodegradation as a function of photocatalyst types (catalyst concentration is 0.5 mg/mL, MPs concentration is 1.5 mg/mL), and (d) initial concentrations of MPs by 0.5 mg/mL 60%Nb2O5/GCN photocatalyst after 5-day visible light irradiation at an intensity of 100 mW/cm2.
The Nb2O5/GCN heterojunction catalyst system generated less CO2 compared to the individual GCN and Nb2O5 catalysts, which was primarily due to the reduction of CO2 to other intermediates, including various acids and alcohols. In the 15%Nb2O5/GCN photocatalyst, only HCOOH was detected. Increasing the Nb2O5 loading from 15% to 60% led to a significant 1.9-fold increase in HCOOH generation concentration after a 5-day photodegradation of PBAT MPs. Notably, the ethanol and acetic acid generation rates from 1.5 mg/mL of PBAT MPs treated by 60%Nb2O5/GCN photocatalyst were 21.8-fold and 1.8-fold higher, respectively, compared to Nb2O5 alone. These enhancements are attributed to the enhanced visible light absorption, superior separation efficiency, and prolonged lifetime of photogenerated carriers of 60%Nb2O5/GCN catalyst, as evidenced by EIS and photocurrent density measurements. Given these encouraging results, the 60%Nb2O5/GCN heterojunction has been chosen for the subsequent photocatalytic studies.
As shown in Fig. 3d and Figs. S7-S9 (Supporting information), the formation rate of products is proportional to the MPs concentration. Additionally, an increase in the concentration of PBAT MPs leads to a greater diversity of acids and alcohols being generated by the 60%Nb2O5/GCN photocatalyst. The total production rate of the four liquid products at 1.5 mg/mL of PBAT MPs achieves 1491.28 µg gcat−1 h−1, which were 1.7-fold and 11.3-fold higher than those at 1.0 mg/mL (544.32 µg gcat−1 h−1) and 0.5 mg/mL (121.66 µg gcat−1 h−1), respectively, after 120 h of visible light exposure. Interestingly, at the PBAT MPs concentration of 1.5 mg/mL, the formation rate of CH3COOH increased over time during 120 h of illumination. The increased rate of CH3COOH was probably because HCOOH was converted into CH3COOH via C—C coupling reactions [38], and confirmed by the decreased HCOOH concentration after 72 h irradiation. Moreover, the production rate of CH3COOH was double that of previous studies utilizing Nb2O5 layer photocatalyst [18]. Therefore, 1.5 mg/mL is the optimal PBAT MPs concentration of photocatalytic reaction.
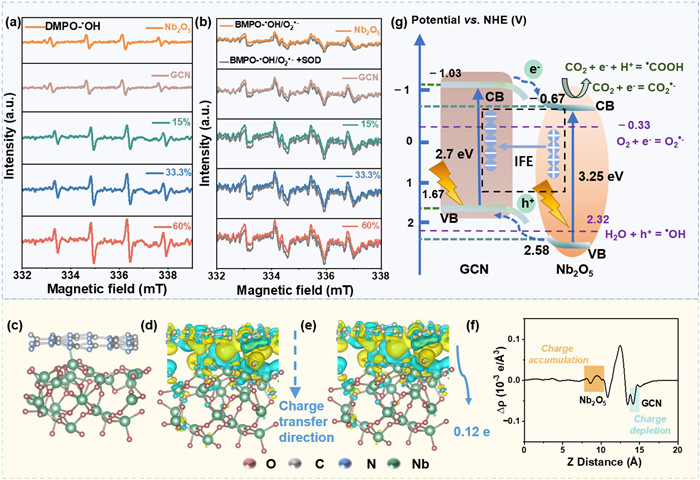
The detection method of ROS is provided in Text S4 (Supporting information). After LED lamp irradiation, a quartet signal with 1:2:2:1 splitting pattern of the DMPO-•OH spin adducts was observed in all photocatalyst, indicating the generation of •OH (Fig. 4a). After addition of SOD, the intensity of BMPO-•OH/O2•− decreased under LED lamp irradiation, indicating of O2•− production in all photocatalyst (Fig. 4b). Previous reports have shown that •OH is generated in GCN or Nb2O5 suspension under LED lamp irradiation [18, 39]. The redox potential for •OH generation is approximately 2.32 V with respect to NHE, which is lower than the Ev value of Nb2O5 (2.58 V) but higher than that of GCN (1.67 V). This indicates that Nb2O5's holes can oxidize H2O into •OH, whereas GCN cannot. Interestingly, •OH was experimentally detected in GCN (Fig. 4b), probably because the generated O2•− undergo a disproportionation reaction to produce H2O2, which then decomposes to •OH under illumination [24, 39]. The Ec values of Nb2O5 (−0.67 V vs. NHE) and GCN (−1.03 V vs. NHE) were lower than the redox potential for O2•− generation (O2/O2•−, −0.33 V vs. NHE), explaining the detection of O2•−in these catalysts.
Figure 4
Figure 4.
ESR spectra recorded at ambient temperature for the (a) DMPO-•OH, (b) BMPO-•OH/O2•−, BMPO-•OH/O2•−+SOD spin adduct within the GCN, 15%Nb2O5/GCN, 33.3%Nb2O5/GCN, 60%Nb2O5/GCN catalysts under LED lamp irradiation, (c) DFT-optimized structures, (d) three-dimensional charge density difference, (e) Bader electron transfer from Nb2O5 to GCN, (f) plane-averaged charge density difference ∆ρ(z) along the z-Axis for heterostructures composed with GCN and Nb2O5 and (g) electron transfer path of Nb2O5/GCN heterojunction catalyst.
No measurable amounts of DMPO-•OH and BMPO—O2•− spin adducts were detected, but a small quantity of TEMP-1O2 was detected without light irradiation (Figs. S10a-c in Supporting information). We noted that the peak intensity of TEMPO (1:1:1) under LED irradiation (Fig. S10d in Supporting information) was higher than that without light irradiation (Fig. S10c), indicating that the light irradiation promoted 1O2 generation. With the loading of Nb2O5 increased from 15% to 60%, the peak intensity of TEMPO observed in Nb2O5/GCN photocatalyst increased. Previous studies have shown that O2•− can be converted into •OH and 1O2 [40]. Among all the generated ROS, •OH has the highest oxidative capacity and plays a key role in contaminant mineralization and photocatalytic reaction [41-43].
To study the role of •OH in the photocatalytic reaction, an active substance quenching experiment has been carried out using isopropanol as a scavenger for •OH. In the presence of isopropanol, the production of CO2 decreased significantly (Fig. S11 in Supporting information), and no liquid products were detected. These results indicate that •OH is the most critical active radical in the photocatalytic reaction.
Density functional theory (DFT) calculations were employed to investigate the electron transfer dynamics between GCN and Nb2O5. Figs. 4c-f depicts the atomic model featuring DFT-optimized structures, charge density differences, and Bader charge analysis for the Nb2O5/GCN catalyst. The yellow and cyan regions represent the net electron accumulation and depletion sites, respectively. These findings indicate substantial charge transfer from Nb2O5 to GCN, as inferred by the plane-averaged charge density difference along the Z direction (Figs. 4d-f). Bader charge-transfer calculation reveals a net transfer of 0.12 e from GCN to Nb2O5 (Fig. 4e and Table S1 in Supporting information). The direction of electron transfer and Bader charge analysis confirm the Nb2O5/GCN is a type Ⅱ heterojunction. Moreover, Kelvin probe force microscopy (KPFM) experiments show that the surface potential in the GCN region of the Nb2O5/GCN heterostructure is higher than that in the Nb2O5 region (Fig. S12 in Supporting information). Consequently, electrons will transfer from GCN to Nb2O5, which is consistent with the DFT results presented in Figs. 4c-f.
According to the XPS N 1s and Nb 3d results, the spontaneous electron transfer from Nb2O5 to GCN would occur when they come into intimate contact, creating electron depletion layer and electron accumulation layer in Nb2O5 and GCN, respectively. Then Nb2O5 and GCN is positively and negatively charged at the interface, respectively, thereby an energy band bending and an internal electric field (IEF) with the direction from Nb2O5 to GCN can form in the space charge layer. As shown in Fig. 4g, the IEF would strongly promote the transfer of photoinduced electrons in the CB of GCN to the CB of Nb2O5, that is the type Ⅱ electron transfer. Moreover, the type Ⅱ heterojunction facilitated the electron migration. The photogenerated e- in Nb2O5's CB facilitate the reduction of CO2 and the photogenerated h+ transfer to VB of Nb2O5 from VB of GCN through the tight heterojunction interface. The residual h+ on VB of Nb2O5 could oxidize OH−/H2O to generate •OH [44]. These radical then oxidize MPs into CO2 directly.
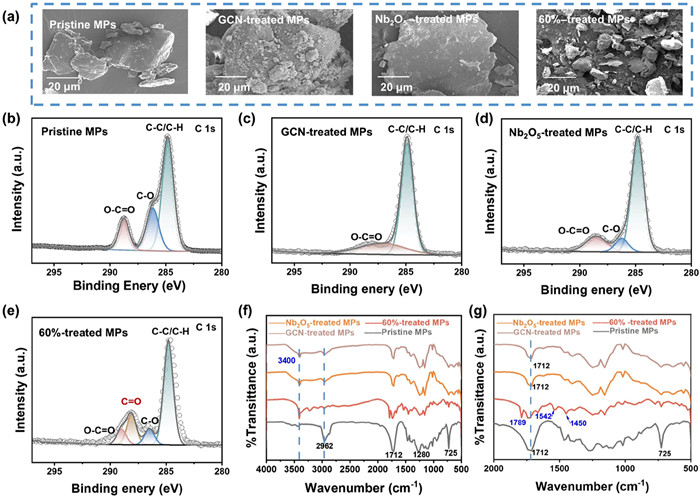
The scanning electron microscope (SEM) images shown in Fig. 5a and Fig. S13 (Supporting information) illustrate the surface morphology of PBAT MPs before and after photocatalytic degradation using various catalysts and only 5-day of light for controlled experiments. The pristine MPs exhibited a crack-free surface. After 120 h of photocatalytic degradation with GCN, minor breakages were observed, possibly due to ROS-mediated photoaging [45]. MPs treated with Nb2O5 showed rough surfaces with micro-cracks and broken edges, which was attributed to oxidative degradation by •OH generated from Nb2O5 [18]. When treated by 15%Nb2O5/GCN and 33.3%Nb2O5/GCN catalysts, MPs were fragmented into smaller MPs, displaying noticeable cracks and pits on the surface (Fig. S13). The 60%Nb2O5/GCN catalyst induced the most significant fragmentation due to its higher •OH generation concentration, causing intense oxidation and structural damage [17]. These observations underscore the photocatalytic degradation of PBAT MPs and hint at the potential MPs conversion into carbon-based fuels under illumination.
Figure 5
Figure 5.
(a) SEM images of PBAT microparticles before and after 120 h degradation with GCN, Nb2O5, and 60%Nb2O5/GCN heterojunction photocatalyst. High-resolution C 1s analysis of (b) pristine PBAT MPs and after photocatalytic degradation using (c) GCN, (d) Nb2O5, (e) 60%Nb2O5/GCN, and FTIR analysis of pristine PBAT MPs and photocatalyst-treated MPs at (f) 4000–500 cm−1 and (g) 2000–500 cm−1 for 120 h.
XPS analysis reveal distinct carbon and oxygen chemical binding states on PBAT MPs before and after photocatalytic reaction using GCN, Nb2O5, and 60%Nb2O5/GCN catalysts (Figs. 5b-e). The full-spectrum XPS analysis indicates that the pristine PBAT MPs shows only peaks for C 1s and O 1s (Fig. S14 in Supporting information), suggesting that the plastic contains no impurities. Fig. 5b illustrates the C 1s high-resolution spectrum of original PBAT MPs, which exhibits three subpeaks at 284.8 eV, 286.2 eV and 288.7 eV. These peaks correspond to the C−C/C−H, C−O, and ester bond (O−C=O) in PBAT MPs, respectively [46].
After 120 h of photocatalytic degradation by GCN, Nb2O5, and 60%Nb2O5/GCN catalysts, the C−C/C−H peaks of PBAT MPs changed slightly (Figs. 5c-e). In contrast, a notable reduction in the intensities of C−O and ester bond (O−C=O) peaks was observed. This reduction may be attributed to the structural disruption of PBAT MPs and the attack by •OH on the O−C=O bond. It is worth noting that when treated by the 60%Nb2O5/GCN catalyst, a new C=O peak appeared, indicating the degradation of polymer and the generation of new compounds. This observation is further supported by the detection of alcohols and acids via1H NMR (Figs. S7-S9), which confirms the cleavage of ester bonds as indicated by the XPS analysis.
To elucidate the photocatalytic degradation mechanism of PBAT MPs, FTIR analysis was utilized to track product changes, as shown in Figs. 5f and g. After degradation by GCN, Nb2O5, and 60%Nb2O5/GCN photocatalyst for 120 h, the characteristic band of PBAT becomes weaker. The absorption band at 2962 cm−1, corresponding to −CH2− groups [47], nearly vanishes. As shown in Fig. 5g, the absorption band at 1712 cm−1 decreases, which belongs to the carbonyl group (−C=O) in the ester bond [47, 48]. It is primarily because •OH attacks the ester bond, inducing its breakage. Moreover, the emergence of an O−H absorption band around 3400 cm−1 indicates alcohol formation during the PBAT's degradation. A new absorption band at 1789 cm−1 appears on the PBAT MPs treated with 60%Nb2O5/GCN catalyst for 120 h, which was mainly attributed to the C=O functional group in acids [49]. Furthermore, the bands at 1450 and 1542 cm−1 correspond to •COOH symmetric and asymmetric stretching [50]. The appearance of these bonds further proves the formation of acids. Thus, the new absorption bonds indicate that PBAT MPs undergo photocatalytic degradation by the 60%Nb2O5/GCN heterojunction, producing acids and alcohols, which is consistent with our 1H NMR experimental results (Figs. S7-S9). The XPS and FTIR analyses reveal no detectable changes after the 5-day light irradiation (Fig. S15 in Supporting information).
The stability of catalysts is crucial for the practical application of photocatalytic reactions. To further assess the stability of the catalyst, XRD and FTIR characterizations were performed before and after the photocatalytic reaction, as shown in Figs. S16 and S17 (Supporting information). In the XRD spectrum, the crystal structure of 60%Nb2O5/GCN remained largely unchanged after the reaction. The FTIR spectrum shows that no significant changes in the functional groups of 60%Nb2O5/GCN after the reaction. Overall, 60%Nb2O5/GCN demonstrates high stability and can be further explored for the treatment of real-world plastics in future studies.
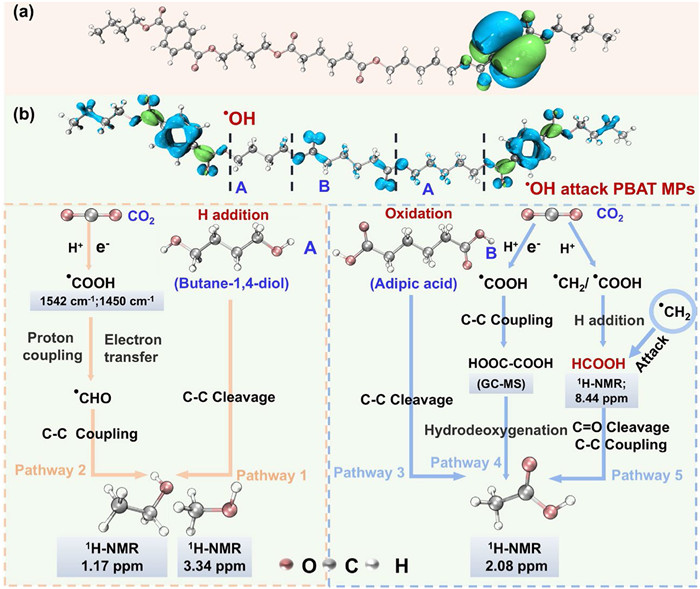
HOMO can reflect the sites on MPs where electron transfer is facile during the reaction [51, 52]. Fig. 6a shows that the benzene rings and adjacent ester bonds in PBAT MPs are actively involved in electron transfer. However, due to the inherent stability of the benzene ring, which does not readily accept or donate electrons [53], it can be inferred that the electron transfer primarily occurs through the ester bonds.
Figure 6
Figure 6.
(a) The HOMO for PBAT MPs, where the green and blue regions indicate the sites susceptible to •OH attack. White, grey, and red colors denote H, C, and O atoms, respectively. (b) Reaction pathways and mechanisms of photocatalytic generation of acids and alcohols from PBAT MPs.
Previous studies indicate that •OH is a nucleophilic radical that typically targets active sites on organic pollutants [54]. To investigate the effect of •OH on the cleavage of PBAT MPs molecular chain, we employed Multiwfn software for numerical analysis of PBAT fragments. We calculated the integral values of the Fukui function OW Δf for the Hirshfeld space orbit weights of each atom, with results detailed in Table S2 (Supporting information). DFT results show that the atoms C17, C34, C47, C63 and C75 in PBAT MPs exhibit relatively high Δf values, which are 0.01682, 0.00016, 0.00136, 0.01719 and 0.01676, respectively (Table S2), indicating an enhanced susceptibility to nucleophilic attacks [55-57]. Therefore, during the photocatalytic reaction, these carbon atoms in PBAT MPs are extremely vulnerable to the nucleophilic attack of •OH, leading to the cleavage of ester bonds in the molecular chain and resulting in the formation of three monomers of butane-1, 4-diol, adipic acid, and polyphthalic acid (Fig. 6b).
Upon visible light irradiation, PBAT MPs undergo mineralization, generating CO2 and carbon-based fuels like acids and alcohols (Figs. 3b-d). DFT calculations show that •OH attacks the ester bond of PBAT MPs, breaking them down into three small molecules: −CH2−COO−Ph−CO−, −O−(CH2)4−O− (A), and −OC−(CH2)4−CO− (B). Then −O−(CH2)4−O− and −OC−(CH2)4−CO− undergo hydrogenation and oxidative reactions under the action of H+ and •OH to form butane-1, 4-diol (HO−(CH2)4−OH) and adipic acid (HOOC−(CH2)4−COOH), respectively. Integrating FTIR, XPS, GC, and 1H NMR data, we propose the photocatalytic degradation pathways for PBAT MPs. Butane-1, 4-diol, for instance, forms alcohols when exposed to visible light through two main processes: (1) Visible light energy (306 kJ/mol) exceeds the C−C bond energy (284 kJ/mol) [58], breaking the C−C bond in butane-1, 4-diol to produce CH3OH and CH3CH2OH (Pathway 1); (2) PBAT MPs is oxidized into CO2 by •OH (Eq. 6). Then CO2 was reduced to •COOH by photogenerated electrons (Eq. 3). The FTIR bands at 1542 and 1450 cm−1 verify •COOH formation, which transforms into •CHO through proton coupling and electron transfer (Eq. 7) [59]. Finally, CH3OH and CH3CH2OH are generated through C − C coupling by •CHO (Eqs. 8 and 9, Pathway 2). The FTIR bands at 3400 cm−1 also confirms CH3OH and CH3CH2OH formation.
Similarly, the generation of CH3COOH from adipic acid can be divided into three routes: (1) The cleavage of C−C bond in adipic acid under visible light irradiation (Pathway 3); (2) CO2 undergoes hydrogenation to produce •COOH in the presence of e− and H+ (Eq. 3). Then •COOH couples to generate HCOO−COOH (Eq. 4), which is detectable by GC–MS, and subsequently undergoes multiple hydrodeoxygenation steps to generate CH3COOH (Eq. 5, Pathway 4) [18, 21]; (3) The last way involves the initial hydrogenation of CO2 to generate •CH2 and •HCOO. These intermediates first combine to generate formic acid through hydrogenation reactions. Subsequently, •CH2 interacts with the sp2 carbon of HCOOH, the C−O bond in the HCOOH was broken, forming C−C bond by carbene [38, 60], and finally CH3COOH was generated through C−C coupling reactions, as evidenced by 1H NMR (Pathway 5). The new absorption band at 1789 cm−1 confirms the formation of acids. In addition, we also detected propylene glycol, oxalic acid, and propanedioic acid by GC–MS (Fig. S18 in Supporting information).
In this study, we achieved efficient C—C bond-cleavage and bond-coupling for the conversion of bioplastics into carbon-based fuels by constructing a bifunctional Nb2O5/GCN type Ⅱ heterojunction. The experimental results and DFT calculations demonstrate that the photogenerated charge is transferred from the conduction band of GCN to the conduction band of Nb2O5, ensuring efficient charge separation while retaining the strong reducibility of electrons. The 60%Nb2O5/GCN catalyst notably outperformed Nb2O5 or GCN alone in producing acids and alcohols, showing its potential as a sustainable solution for plastic waste management. The study confirmed •OH-induced ester bond breakage of PBAT MPs by DFT calculation. In addition, PBAT MPs were converted into acids and alcohols (HCOOH, CH3COOH, CH3OH, CH3CH2OH) by hydrodeoxygenation and C—C bond cleavage/coupling. This transformative process not only reduces plastic waste but also prevents its accumulation in natural environments, thereby safeguarding ecosystems. The Nb2O5/GCN catalyst play a crucial role in advancing a circular economy by converting waste into valuable products, marking a significant step toward sustainable practices. This work offers novel insights into the design of heterojunctions as bifunctional catalysts for the efficient recycling of biodegradable plastics, thereby helping to harvest highly valuable carbon-based fuels in natural environments.
Declaration of competing interest
The authors declare that they have no known competing financial interests or personal relationships that could have appeared to influence the work reported in this paper.
P.K. Samantaray, C. Ellingford, S. Farris, et al., ACS Sustain. Chem. Eng. 10 (2022) 1267–1276. doi: 10.1021/acssuschemeng.1c07376
[50]
L. Giotta, D. Mastrogiacomo, F. Italiano, et al., Langmuir 27 (2011) 3762–3773. doi: 10.1021/la104868m
[51]
L. Chen, H. Ji, J. Qi, et al., Chem. Eng. J. 406 (2021) 126877.
[52]
X.H. Yi, H. Ji, C.C. Wang, et al., Appl. Catal. B: Environ. 293 (2021) 120229.
[53]
M.S. Numin, K. Jumbri, K.E. Kee, et al., Polymers (Basel) 15 (2023) 2155. doi: 10.3390/polym15092155
[54]
F. De Vleeschouwer, V. Van Speybroeck, M. Waroquier, P. Geerlings, F. De Proft, Org. Lett. 9 (2007) 2721–2724. doi: 10.1021/ol071038k
[55]
T. Li, X. Wang, Y. Chen, J. Liang, L. Zhou, Chem. Eng. J. 393 (2020) 124735.
[56]
R. Yin, W. Guo, H. Wang, et al., Chem. Eng. J. 334 (2018) 2539–2546.
[57]
C. Chen, T. Ma, Y. Shang, et al., Appl. Catal. B: Environ. 250 (2019) 382–395.
[58]
Y.K. Song, S.H. Hong, M. Jang, et al., Environ. Sci. Technol. 51 (2017) 4368–4376. doi: 10.1021/acs.est.6b06155
[59]
S. Nitopi, E. Bertheussen, S.B. Scott, et al., Chem. Rev. 119 (2019) 7610–7672. doi: 10.1021/acs.chemrev.8b00705
[60]
W. Kirmse, Carbene Chemistry, 2nd. ed., Academic Press, New York, 1971.
Figure 1
(a) Catalyst synthesis strategy and (b-d) HRTEM images of GCN, Nb2O5, and 60%Nb2O5/GCN photocatalyst. (e) XRD patterns of GCN, Nb2O5, and xNb2O5/GCN (x = 15%, 33.3%, and 60%). High-resolution XPS spectra of (f) N 1s for GCN and 60%Nb2O5/GCN photocatalyst, (g) Nb 3d for Nb2O5 and 60%Nb2O5/GCN photocatalyst.
Figure 2
Ultraviolet-visible diffuse reflectance spectra and Tauc plot (inset) for (a) GCN, (b) Nb2O5, (c) 60%Nb2O5/GCN, (d) Mott–Schottky plots for Nb2O5 and GCN at 1000 Hz and 2000 Hz (V vs. Ag/AgCl), (e) EIS analysis and (f) periodic photocurrent density (I-t) plot for Nb2O5, GCN, and 60%Nb2O5/GCN.
Figure 3
(a) Photocatalytic device, (b) CO2 production kinetics, (c) production rate of acids and alcohols during PBAT MPs photodegradation as a function of photocatalyst types (catalyst concentration is 0.5 mg/mL, MPs concentration is 1.5 mg/mL), and (d) initial concentrations of MPs by 0.5 mg/mL 60%Nb2O5/GCN photocatalyst after 5-day visible light irradiation at an intensity of 100 mW/cm2.
Figure 4
ESR spectra recorded at ambient temperature for the (a) DMPO-•OH, (b) BMPO-•OH/O2•−, BMPO-•OH/O2•−+SOD spin adduct within the GCN, 15%Nb2O5/GCN, 33.3%Nb2O5/GCN, 60%Nb2O5/GCN catalysts under LED lamp irradiation, (c) DFT-optimized structures, (d) three-dimensional charge density difference, (e) Bader electron transfer from Nb2O5 to GCN, (f) plane-averaged charge density difference ∆ρ(z) along the z-Axis for heterostructures composed with GCN and Nb2O5 and (g) electron transfer path of Nb2O5/GCN heterojunction catalyst.
Figure 5
(a) SEM images of PBAT microparticles before and after 120 h degradation with GCN, Nb2O5, and 60%Nb2O5/GCN heterojunction photocatalyst. High-resolution C 1s analysis of (b) pristine PBAT MPs and after photocatalytic degradation using (c) GCN, (d) Nb2O5, (e) 60%Nb2O5/GCN, and FTIR analysis of pristine PBAT MPs and photocatalyst-treated MPs at (f) 4000–500 cm−1 and (g) 2000–500 cm−1 for 120 h.
Figure 6
(a) The HOMO for PBAT MPs, where the green and blue regions indicate the sites susceptible to •OH attack. White, grey, and red colors denote H, C, and O atoms, respectively. (b) Reaction pathways and mechanisms of photocatalytic generation of acids and alcohols from PBAT MPs.

 DownLoad:

 下载:
下载:


 下载:
下载:
