Institute of Flexible Electronics (IFE) and Frontiers Science Center for Flexible Electronics, Northwestern Polytechnical University, Xi'an 710129, China
b.
School of Chemistry, Engineering Research Center of Energy Storage Materials and Devices of Ministry of Education, National Innovation Platform (Center) for Industry-Education Integration of Energy Storage Technology, Xi'an Jiaotong University, Xi'an 710049, China
c.
Chemistry and Chemical Engineering, Central South University, Changsha 410083, China
iamyhhan@nwpu.edu.cn (Y. Han). 1 These authors contributed equally to this work.
Received Date:
18 December 2024 Accepted Date:
27 February 2025 Revised Date:
19 February 2025 Available Online:
15 June 2026
Abstract:
Oxygen evolution reaction (OER) is a key reaction in proton exchange membrane water electrolyzers (PEMWEs). Therefore, developing cost-effective acid-stable electrocatalysts to drive efficient OER is crucial. Here, we constructed a RuO2 electrocatalyst (MoB-RuO2) co-doped Mo and B atoms, which exhibits excellent OER performance in acidic media. In 0.5 mol/L H2SO4, MoB-RuO2 exhibited a very low overpotential (166 mV) and could be operated stably for more than 550 h at 10 mA/cm2 current density without significant loss of activity. More than 240 h of stable operation at 200 mA/cm2 current density was achieved when using MoB-RuO2 as a PEMWE anode. Experimental and theoretical results demonstrated that the excellent OER activity and stability of MoB-RuO2 mainly originated from the incorporation of B atoms leading to the coordination unsaturation of the active centre Ru, and the simultaneous doping of Mo and B atoms modulated the electronic structure of Ru, which lowered the covalency of the Ru-O bond, thus making the catalyst exhibit excellent stability.
As one of the core technologies for energy conversion and storage such as proton exchange membrane water electrolyzers (PEMWEs) [1–3], the oxygen evolution reaction (OER) requires catalysts with extremely high catalytic activity due to the complex multiple proton/electron-coupled steps involved in the process, which results in very slow kinetics of OER [4,5]. In recent years, researchers have made significant progress in developing OER catalysts with high activity in acidic conditions [6,7]. However, due to the harsh operating environment of PEMWEs, catalyst stability is crucial [8,9], and the catalysts that can meet this requirement are almost all catalysts mainly composed of precious metal Ir, which leads to the cost problem that is becoming more and more prominent [10]. Therefore, the development of low-cost, highly active, and stable OER catalysts is imperative for advancing energy conversion and storage technologies. However, significant challenges remain, particularly with regard to OER catalysts that can be stabilised under the practical operating conditions of PEMWEs [11].
The Ru-based catalysts have superior OER activity compared to most reported OER catalysts, and due to the relatively high storage capacity of Ru, the cost is only one-tenth of that of the Ir-based acidic OER catalysts commercially available at present, making them cost-effective catalytic materials for the anode of energy conversion and storage devices, especially for operation under acidic environments [12–14]. Considering this, the development of Ru-based OER catalysts has been favoured by more and more researchers in recent years, especially RuO2-based acidic OER catalysts, whose activity even exceeds that of most of the Ir-based catalysts, and has been regarded as an ideal alternative to Ir-based catalysts [15]. However, durability is another key parameter for practical applications during the actual operation of energy conversion and storage devices, and its importance even exceeds the activity. Most of the Ru/RuO2-based OER catalysts reported at present are mostly stable only for tens or nearly hundreds of hours at low current densities, and the stability maintenance time is drastically shortened when the current density is increased [16,17]. However, with the urgent need for energy transition, the development of OER catalysts with excellent activity and stability under acidic conditions is particularly important for cost reduction and efficiency of energy conversion and storage devices [18,19].
Herein, we reported a RuO2 catalyst co-doped with metallic Mo atoms and non-metallic B atoms (MoB-RuO2) prepared by a simple mechanical milling method. The catalyst exhibited excellent OER performance in acidic media. The overpotential of MoB-RuO2 at a current density of 10 mA/cm2 was only 166 mV, which was much lower than that of commercial RuO2 catalysts (329 mV). More importantly, MoB-RuO2 exhibited excellent stability, operating at a current density of 10 mA/cm2 for at least 550 h with virtually no activity degradation. When used as a PEMWE anode catalyst, PEMWE could operate stably for at least 240 h at a current density of 200 mA/cm2 (80 ℃), exceeding most of the reported catalysts of the same type. Experimental and theoretical calculations showed that the introduction of B atoms resulted in the coordination unsaturation of the Ru active site, greatly optimizing the activity of the catalyst. Additionally, the co-doping of Mo and B atoms optimized the electronic structure of the Ru active site, preventing it from being over-oxidized and dissolved during acidic OER, thus maintaining the stability of the catalyst.
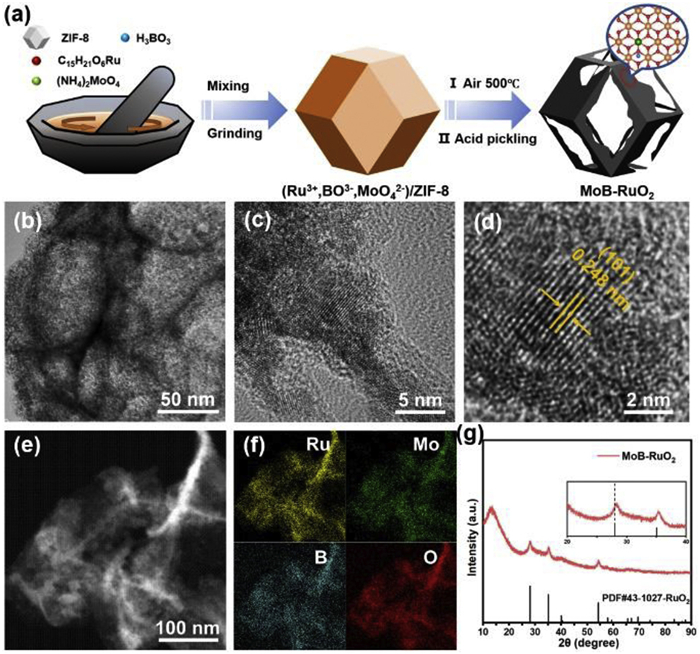
The method for synthesizing MoB-RuO2 is shown in Fig. 1a, with details of the experiment provided in the Supplementary materials. To begin with, the prepared ZIF-8 is evenly ground with ruthenium acetylacetonate, ammonium molybdate, and boric acid in a mortar. Then the mixture is oxidized and pyrolyzed at low temperature for a long time in the air atmosphere. Finally, zinc oxide is washed off with dilute HCl to obtain Mo and B co-doped RuO2 catalyst (MoB-RuO2). Transmission electron microscopy (TEM) images show that MoB-RuO2 inherited the overall morphology of the ZIF-8 precursor to a large extent, only slightly fragmented (Fig. S1 in Supporting information). As shown in Figs. 1b and c, high-resolution transmission electron microscopy (HR-TEM) images indicate that MoB-RuO2 is composed of uniform RuO2 nanoparticles that appear as dodecahedral prisms of ZIF-8. From Fig. 1d, we can observe the lattice spacing of MoB-RuO2 is 0.248 nm (101), which is reduced compared with that of 0.255 nm for the standard RuO2, implying that Mo atoms with smaller ion radii are successfully doped into the lattice of RuO2. The corresponding energy dispersive X-ray (EDX) elemental distributions (Figs. 1e and f) illustrate the homogeneous distribution of Ru, Mo, B, and O elements in the catalysts, further demonstrating the successful co-doping of Mo and B atoms. As shown in Fig. 1g, the X-ray diffraction (XRD) pattern of the prepared MoB-RuO2 is consistent with the characteristic diffraction peaks of the standard RuO2 (PDF #43–1025), but the diffraction peaks of MoB-RuO2 are slightly shifted to a higher angle (Fig. 1g), indicating a contraction of the lattice spacing and further demonstrated the successful introduction of Mo and B atoms [20,21]. The blue shift of characteristic peaks in the Raman spectra of MoB-RuO2 and RuO2 also indicate the successful introduction of Mo and B atoms (Fig. S2 in Supporting information) [22]. According to inductively coupled plasma mass spectrometry (ICP-MS, Table S1 in Supporting information), the contents of Ru, Mo, and B were 71.85%, 4.63%, and 0.065%, respectively. Additionally, we used the similar method to synthesize B-RuO2, Mo-RuO2, and RuO2 catalysts as control examples. The morphology characterizations, XRD, and EDX of these samples are shown in Figs. S3-S7 (Supporting information).
Figure 1
Figure 1.
Preparation and structure characterization of MoB-RuO2. (a) Schematic diagram of the synthesis MoB-RuO2. (b-d) HR-TEM images of MoB-RuO2, and the (101) crystal plane spacing of MoB-RuO2 marked with the orange line in (d) is 0.248 nm. (e, f) Dark-field HR-TEM image and the corresponding elemental mappings of MoB-RuO2. (g) XRD pattern of MoB-RuO2.
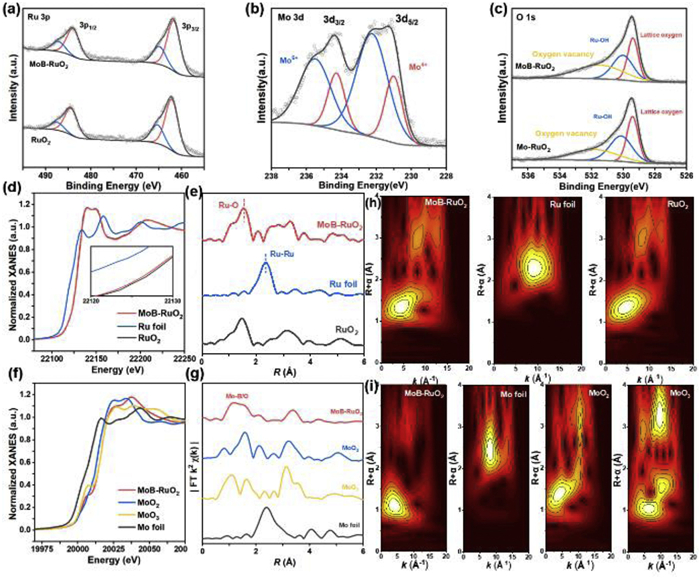
The surface chemical states of the samples are characterized by X-ray photoelectron spectroscopy (XPS). Fig. 2a displays the 3p spectra of Ru for MoB-RuO2 and pure RuO2 showing two peaks at 484.8 and 463.6 eV, attributed to Ru4+ 3p1/2 and Ru4+ 3p3/2, respectively [23]. The binding energy of MoB-RuO2 is shifted by 0.4 eV towards a lower binding energy compared to RuO2, and the same shift can be observed in the Ru 3d spectra (Figs. S8 and S9 in Supporting information), indicating that Ru received electrons and the valence state is lowered, thus helping to prevent over-oxidation of Ru species. According to the Mo 3d spectrum (Fig. 2b), we can observe that Mo exists mainly in the form of Mo6+ in MoB-RuO2 [24]. An oxidized B species can be seen in Fig. S10 (Supporting information), which exists in the form of B-O bond. The presence of high valence Mo and B in MoB-RuO2 suggested that they provided electrons to the Ru species and prevented them from being over-oxidized during OER process. As shown in Fig. 2c, the O 1s spectrum is convolved into three peaks at 529.4, 530.0, and 531.5 eV for lattice oxygen, Ru-OH, and oxygen vacancy (Ov), respectively [25]. Compared with Mo-RuO2, the Ov on the MoB-RuO2 surface increased dramatically after doping with B atoms, which implies an increase in the number of coordination unsaturation of the Ru active centre in MoB-RuO2 (Fig. S11 in Supporting information), and we speculate that it may be the main reason why MoB-RuO2 exhibits the most excellent OER catalytic activity. The electron paramagnetic resonance (EPR) further confirms the increase in oxygen vacancies in MoB-RuO2 (Fig. S12 in Supporting information).
Figure 2
Figure 2.
Structural characterization of MoB-RuO2. (a) Ru 3p XPS spectra of MoB-RuO2 and pure RuO2. (b) Mo 3d XPS spectra of MoB-RuO2. (c) O 1s XPS spectra of MoB-RuO2 and Mo-RuO2. (d) The Ru K-edge XANES spectra of MoB-RuO2, Ru foil, and RuO2. (f) The Mo K-edge XANES spectra of MoB-RuO2, MoO2, MoO3, and Mo foil. FT-EXAFS spectra at the (e) Ru K-edge and (g) Mo K-edge of MoB-RuO2. (h) Ru K-edge wavelet transform-EXAFS of MoB-RuO2, Ru foil, and RuO2. (i) Mo K-edge wavelet transform-EXAFS of MoB-RuO2, MoO2, MoO3, and Mo foil.
To further investigate the atomic level structural information of MoB-RuO2, X-ray absorption spectroscopy (XAS) technique was performed. The X-ray absorption near-edge structures (XANES) of MoB-RuO2 as well as the reference samples Ru foil and RuO2 were shown in Fig. 2d, where we found that the K-edge absorption of Ru in MoB-RuO2 is essentially the same as that of RuO2, and only the absorption edge of Ru in MoB-RuO2 is slightly lower than that of RuO2, however, indicating that the valence of Ru in MoB-RuO2 is slightly lower than that of +4. Fig. 2f compares the XANES spectra of MoB-RuO2 and reference samples (Mo foil, MoO2, and MoO3), we observe that the absorption on the Mo K-edge in MoB-RuO2 is between MoO2 and MoO3, and closer to that of MoO3. The result is consistent with the results of the XPS analysis. Fig. 2e shows the Fourier transform extended X-Ray absorption fine structure (FT-EXAFS) on the Ru K-edge of MoB-RuO2, in which the obvious prominent peak at 1.68 Å can be attributed to the Ru-O bond after comparing it with the RuO2 reference. It is noteworthy that the length of Ru-O bonds in MoB-RuO2 is longer than that in the RuO2 reference, which implies that the introduction of Mo and B atoms modulates the electronic structure of the Ru active centre and reduces the covalency of the Ru-O bonds, which contributes to the enhancement of the stability of the catalyst. As shown in Fig. 2g, for FT-EXAFS on the Mo K-edge of MoB-RuO2, there is a main peak at 1.74 Å, which is like the Mo-O scattering of the first shell in MoO3. It confirms that the Mo atoms in MoB-RuO2 is in the oxidation state with +6 valence, which is also consistent with the XPS analysis (Fig. 2b). The Ru K-edge EXAFS spectra were further wave-transformed (WT) to identify the surrounding coordination of the Ru atoms (Fig. 2h). The WT contours of MoB-RuO2 show a characteristic peak at 4.9 Å−1 for the Ru-O bond, which is like that of RuO2 but different from that of the Ru-Ru bond in Ru foils. In addition, the WT results for Mo are shown in Fig. 2i. Unlike the maximum intensity of Mo foil, the characteristic peak intensity position of Mo at 4.7 Å−1 is like that of MoO3, proving that its oxidation state is +6 valence. The fitting of FT-EXAFS further confirms the previous speculation that the average coordination number of the Ru-O bond is 3.76, slightly smaller than the 4-coordination of the Ru-O bond in standard RuO2. Additionally, the presence of Ru-O-B/Mo bridge bonds is found in the second-shell of Ru (Fig. S13 and Table S3 in Supporting information). These pieces of evidence indicate that doping with B can alter the coordination imbalance of the active center Ru and obtain more Ov.
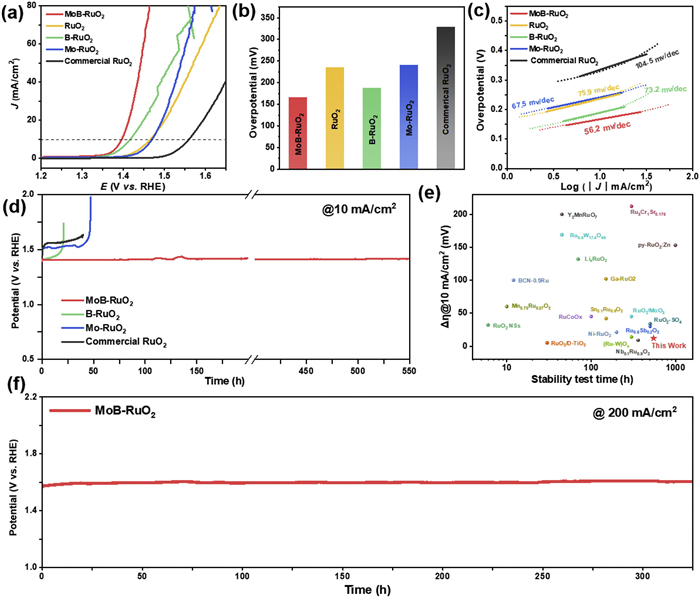
The OER performance of MoB-RuO2 was tested in N2-saturated 0.5 mol/L H2SO4. Fig. 3a shows the linear sweep voltammetry (LSV) curves of MoB-RuO2 and the control samples. Among them, MoB-RuO2 shows the best OER performance with an overpotential of 166 mV at 10 mA/cm2 current density, which is superior to most of the reported catalysts of the same type (Fig. 3b and Table S2 in Supporting information). We believe that the introduction of B atoms leads to the presence of abundant unsaturated coordination Ru sites in MoB-RuO2, which contributes to the improvement of the OER activity of MoB-RuO2. Additionally, we find that the kinetic activity of MoB-RuO2 is significantly increased by the addition of Mo atoms, but the OER activity is not obviously improved. It is evident from Fig. 3c that the Tafel slope of MoB-RuO2 is 56.2 mV/dec, which is much lower than that of 73.2 mV/dec for B-RuO2, 67.5 mV/dec for Mo-RuO2, 75.9 mV/dec for pure RuO2, and 104.5 mV/dec for commercial RuO2, suggesting that it has the best kinetic activity. Based on the electrochemical impedance spectra, we find that MoB-RuO2 has the lowest impedance, which means that the charge transfer resistance is the smallest. Thus, it can be reasonably deduced that the introduction of Mo atoms can effectively improve the impedance of the catalysts and optimize the kinetic activity of MoB-RuO2 (Fig. S14 in Supporting information).
Figure 3
Figure 3.
Electrocatalytic OER performance in acidic media. (a-c) LSV curves, overpotentials at the current density of 10 mA/cm2, and Tafel plots for MoB-RuO2, B-RuO2, Mo-RuO2, RuO2, and commercial RuO2. (d) Chronopotentiometry test at 10 mA/cm2 current density. (e) Comparison of stability between MoB-RuO2 and recently reported Ru-based OER electrocatalysts. (f) The chronopotentiometry test of MoB-RuO2 at the current density of 200 mA/cm2.
The stability of the catalyst is very important to evaluate whether it can be used in practical applications. Given that, we first performed accelerated durability test (ADT) to assess the stability of MoB-RuO2. As shown in Fig. S15 (Supporting information), the LSV curve of MoB-RuO2 does not shift significantly after 2000 cycles of cyclic voltammetry (CV) test at a scanning speed of 100 mV/s, indicating the excellent OER stability of MoB-RuO2. In addition, the stability of MoB-RuO2 is also measured by chronoamperometry to get a more comprehensive understanding of the catalyst stability, and MoB-RuO2 can be operated stably for at least 550 h at 10 mA/cm2 current density with almost no degradation of activity (Fig. 3d). However, for B-RuO2, Mo-RuO2 and commercial RuO2, their stability only remains stable for 20, 40 and 40 h, respectively, under similar conditions. Moreover, we also tested the stability at different current densities (at 10, 50, and 100 mA/cm2 current densities, respectively) (Fig. S16 in Supporting information), it is worth noting that MoB-RuO2 can work continuously for 300 h at 200 mA/cm2 without a significant decrease in activity (Fig. 3f). We characterized MoB-RuO2 after the stability test, and according to the TEM and XPS results, the morphology and elemental valence states of MoB-RuO2 hardly changed before and after the reaction, which proved that our prepared MoB-RuO2 has an excellent stability (Figs. S17 and S18 in Supporting information). Most importantly, the OER activity and stability of MoB-RuO2 also ranked top in comparison with recently reported catalysts of the same type (Fig. 3e, Fig. S19 and Table S2 in Supporting information) [4,13–15,17,23,25–37].
In order to further explain the catalytic mechanism of MoB-RuO2 under acidic condition, the intermediates during the acidic OER process were investigated using in situ attenuated total reflectance Fourier-transform infrared spectroscopy (ATR-FTIR), as shown in Fig. S20 (Supporting information), which displayed the spectra of MoB-RuO2 during the potential scanning at 1.1−1.9 V. A clear absorption peak of *OOH intermediates at 1051 cm−1 was observed when the potential reached only a low voltage of 1.3 V [38]. The intensity of the absorption peaks increased with increasing voltage, and a *OH-related absorption peak (Fig. S21 in Supporting information) was present at 3160–3500 cm−1 [39]. This process was consistent with the adsorption evolution mechanism (AEM), which had been widely accepted for acidic OER reactions of RuO2-based catalysts [40,41]. This was believed to be the reason for its excellent stability in acidic OER.
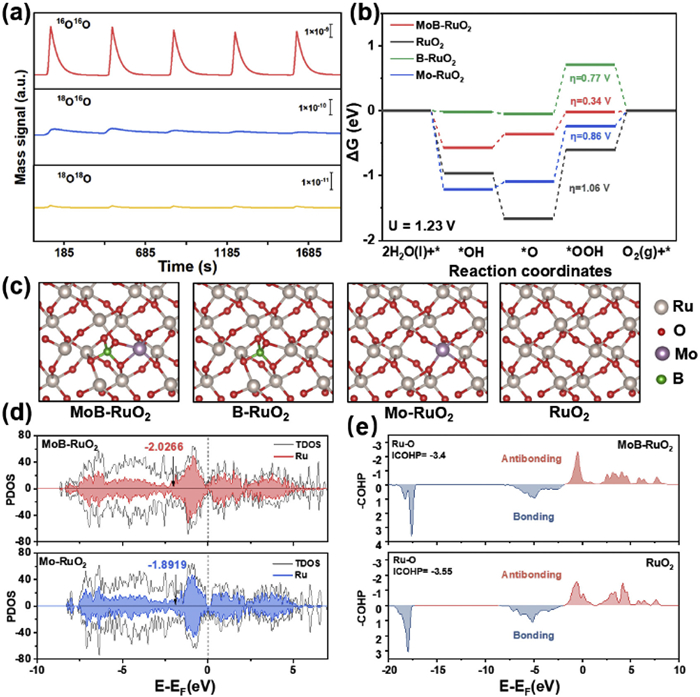
To verify the catalytic mechanism of MoB-RuO2 under acidic conditions, we prepare 0.5 mol/L H2SO4 using H218O and H216O as solvents for two-step in-situ differential electrochemical mass spectrometry (DEMS) measurements (see more details in Supporting information). As shown in Fig. S22 (Supporting information), CV cycling testing is conducted in an 18O labeled environment, detecting three products with m/z = 32, 34, and 36. Among them, 36O2 is the main product, with a small amount of 32O2 and 34O2 present. After 5 rounds of CV marking, rinse with H216O to remove unadsorbed H218O. Finally, 5 cycles of LSV testing are conducted in 0.5 mol/L H2SO4 using H216O as the solvent, and the results are shown in Fig. 4a. As the reaction proceeds, the main product is 32O2, accompanied by a small amount of 36O2 and 34O2. According to the calculation of the ratio of 36O2 to 34O2, the result in Fig. S24 (Supporting information) shows that the value of 36O2/34O2 fluctuates around 0.1%, which is considered to be the natural abundance of 18O. However, the release of 34O2 is due to the binding of an 18O species adsorbed on the surface during the first step of H218O labeling with 16O in H216O, and the production of 36O2/34O2 in the first cycle is much higher than the natural abundance of 18O. Nevertheless, the yield ratio of MoB-RuO2 to 34O was significantly lower compared to the control group of RuO2 (Fig. S23 in Supporting information) indicating that the doping of Mo and B greatly suppressed the occurrence of lattice oxygen oxidation mechanism (LOM). This suggests that the excellent stability of MoB-RuO2 comes from the catalytic mechanism dominated by AEM. Additionally, the intensity of 34O2 decreases as the reaction progresses and the surface 18O is continuously consumed. Therefore, we believe that MoB-RuO2 follows the AEM mechanism in acidic electrolytes.
Figure 4
Figure 4.
Mechanism and theoretical analysis. (a) In-situ DEMS signals of the generated 32O2, 34O2, and 36O2versus time when performing LSV tests in H216O electrolyte for 18O-surface labeled MoB-RuO2. (b) Calculated free-energy diagrams for OER on MoB-RuO2 surfaces. (c) DFT-optimized structures of MoB-RuO2, B-RuO2, Mo-RuO2 and RuO2. (d) PDOS of d-bands of active Ru for MoB-RuO2 and Mo-RuO2; corresponding d-band centres are denoted by arrows. (e) COHP of active Ru for MoB-RuO2 and RuO2.
Density functional theory (DFT) calculations were conducted to gain a deeper understanding of the catalytic mechanism. To investigate the effect of Mo and B doping on the catalytic activity, Mo and B co-doped RuO2 (MoB-RuO2), Mo-doped RuO2 (Mo-RuO2), and B-doped RuO2 (B-RuO2) models were established based on the standard RuO2 (101). The optimized structures of the different dopants are shown in Fig. 4c. Due to B entering the RuO2 lattice and coordinating with O atoms, the original lattice undergoes distortion, and Ov was generated near the Ru site. The Ru site as shown in Fig. S25 (Supporting information) was selected as the active centre, and the reason why the introduction of Ov improved the catalytic activity was theoretically verified.
In-situ DEMS analysis indicated that the acidic OER mechanism was calculated using the AEM pathway, which involved three oxygen-containing intermediates in sequence: *OH, *O, and *OOH. The corresponding adsorption intermediate structure is shown in Figs. S25-S28 (Supporting information). The free-energy diagrams of RuO2 catalysts for OER at U = 0 V and U = 1.23 V (vs. RHE) were calculated (Fig. S29 in Supporting information and Fig. 4b). As shown in Fig. 4b, the formation of *OOH were all rate-determining steps for each catalyst, and the magnitude of the difference in Gibbs free energy (ΔG*OOH-ΔG*O) could reflect the activity of catalysts. The calculated Gibbs free energy barrier of RuO2 was 1.06 eV, which was considerably higher than that of the other three doped modified RuO2 materials. The energy barriers of MoB-RuO2 and B-RuO2 were lower than those of Mo-RuO2, which was consistent with the results of electrochemical testing. This suggested that the doping of B could markedly enhance the activity of RuO2 in acidic OER reactions, moreover, MoB-RuO2 had a minimum rate-determining step energy barrier of 0.34 eV, indicating a synergistic effect between Mo and B (Fig. S30 in Supporting information).
To further explain the effect of doping on the electronic structure of Ru sites, the projected density of states (PDOS) and crystal orbital Hamilton population (COHP) calculations were conducted. In Fig. 4d, the PDOS values of Ru sites in MoB-RuO2 and Mo-RuO2 were calculated, and their positions were labeled. Compared with Mo-RuO2 (-1.89), the d-band centre of Ru sites in MoB-RuO2 (-2.03) showed a negative shift, which was due to the Ov introduced by B doping causing the d-band centre to be far away from the Fermi level. The d-band centre of the active site in the OER reaction was far away from the Fermi level, which weakened the chemical bond between it and the adsorbed oxygen-containing intermediate. These all corresponded to a reduction in the free energy barrier, which was beneficial for improving the OER reaction kinetics. This was also confirmed in the calculation of the COHP of Ru-O bonds (Fig. 4e), with the integrated COHP (ICOHP) value of -3.4 for MoB-RuO2 and -3.55 for RuO2. This indicated that the bonding ability between surface Ru atoms and O atoms in MoB-RuO2 was weaker, that is, the adsorption capacity for *O was weaker, resulting in a lower energy barrier for acidic OER reactions. Overall, calculations showed that the excellent OER activity of MoB-RuO2 mainly came from the introduction of B atoms, which led to the unsaturated coordination of the active center Ru. The doping of Mo and B atoms jointly regulated the electronic structure of the active center Ru, resulting in excellent stability of the catalyst.
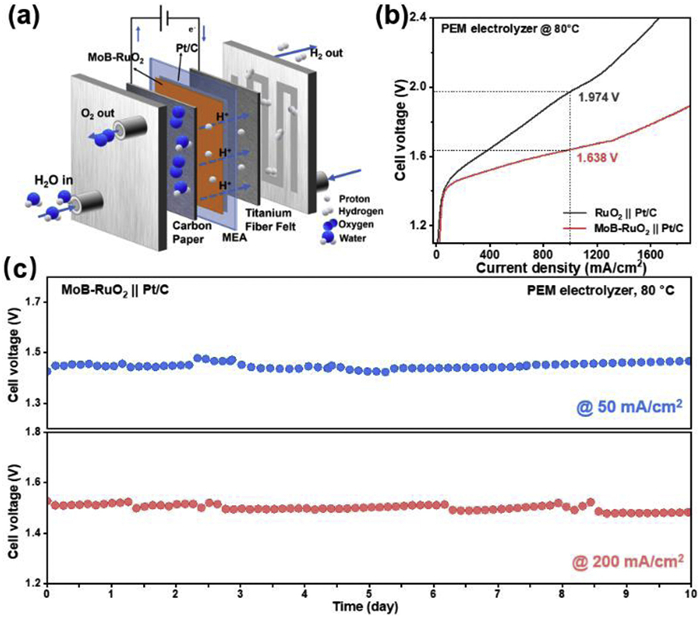
To examine the potential of MoB-RuO2 for practical operation, we assembled PEMWE device with MoB-RuO2 and commercial Pt/C as anode and cathode, respectively, and evaluated the performance of the device (Fig. 5a). A PEMWE with commercial RuO2 as anode was also assembled as a control and tested under the same operating conditions. Based on the steady-state polarization curves (Fig. 5b), it is shown that the PEMWE device with MoB-RuO2 as anode was able to achieve current density of 1000 mA/cm2 at potential of 1.638 V, which are far superior to that of the PEMWE device with a commercial RuO2 anode. However, compared to commercial PEMWE devices, the maturity of the preparation of lab-scale devices is far lower mature than that of commercial ones, making the overpotential still slightly insufficient. Excitingly, the MoB-RuO2 anode-based PEMWE device showed excellent long-term stability (Fig. 5c), which can be operated stably for at least 240 h at 50 and 200 mA/cm2 current density and operating temperature with almost negligible degradation of the performance. Compared to other Ru based catalysts reported in the past two years, the stability of MoB-RuO2 in PEMWE is at the front rank (Table S4 in Supporting information). In sum, the doping of Mo and B atoms effectively optimizes the activity and stability of RuO2, making it a potential candidate for commercialization.
Figure 5
Figure 5.
Performance of PEMWE device. (a) Schematic illustration of the PEM electrolyzer. (b) Polarization curves of the PEM electrolyzers using MoB-RuO2 or RuO2 as anode catalyst and commercial Pt/C as a cathodic catalyst at 80 ℃. (c) Chronoamperometry of the PEM electrolyzer with MoB-RuO2 as anode at current density of 50 and 200 mA/cm2.
In summary, we synthesized a RuO2 catalyst doped with Mo and B, which exhibited excellent acidic OER catalytic activity and stability. According to the experimental and DFT calculation results, the introduction of Mo and B can regulate the electrical structure of the Ru catalytic center. By doping with B, oxygen vacancies are introduced into RuO2, causing the d-band center of nearby Ru sites to move away from the Fermi level, thereby reducing the adsorption of oxygen-containing intermediates by the catalyst and enhancing the catalytic activity of OER reaction. Through the doping of Mo, the electron transfer between Ru and Mo can further reduce the valence state of Ru sites, which can effectively avoid the dissolution of RuO2 under acidic conditions, thus obtaining extremely excellent stability. PEMWEs assembled with MoB-RuO2 showing superb performance and excellent durability in acidic media for water splitting. This finding offers a novel strategy for the rational design and synthesis of high-performance electrocatalysts for the OER in acidic environments.
Declaration of competing interests
The authors declare that they have no known competing financial interests or personal relationships that could have appeared to influence the work reported in this paper.
CRediT authorship contribution statement
Ziang Shang: Writing – original draft, Project administration, Methodology, Investigation, Data curation, Conceptualization. Heyu Sui: Writing – original draft, Methodology, Investigation, Data curation. Zeyi Huang: Writing – original draft, Methodology, Data curation, Conceptualization. Xueting Feng: Methodology, Data curation. Guanzhen Chen: Writing – original draft, Methodology. Jiena Weng: Validation, Resources, Methodology. Yu Xiong: Resources, Methodology. Yaqiong Su: Writing – review & editing, Resources, Methodology. Yunhu Han: Writing – review & editing, Supervision, Investigation, Funding acquisition, Data curation, Conceptualization.
Acknowledgments
This work is supported by the National Natural Science Foundation of China (No. 22102132), the Funds for Basic Scientific Research in Central Universities, Sponsored by Innovation Foundation for Doctor Dissertation of Northwestern Polytechnical University (No. CX2024101) and Sponsored by the Practice and Innovation Funds for Graduate Students of Northwestern Polytechnical University (No. PF2024029). Y. Su acknowledges the "Young Talent Support Plan" of Xi'an Jiaotong University. Supercomputing facilities were provided by Hefei Advanced Computing Center and Computing Center in Xi'an.
Supplementary materials
Supplementary material associated with this article can be found, in the online version, at doi:10.1016/j.cclet.2025.111016.
Figure 1
Preparation and structure characterization of MoB-RuO2. (a) Schematic diagram of the synthesis MoB-RuO2. (b-d) HR-TEM images of MoB-RuO2, and the (101) crystal plane spacing of MoB-RuO2 marked with the orange line in (d) is 0.248 nm. (e, f) Dark-field HR-TEM image and the corresponding elemental mappings of MoB-RuO2. (g) XRD pattern of MoB-RuO2.
Figure 2
Structural characterization of MoB-RuO2. (a) Ru 3p XPS spectra of MoB-RuO2 and pure RuO2. (b) Mo 3d XPS spectra of MoB-RuO2. (c) O 1s XPS spectra of MoB-RuO2 and Mo-RuO2. (d) The Ru K-edge XANES spectra of MoB-RuO2, Ru foil, and RuO2. (f) The Mo K-edge XANES spectra of MoB-RuO2, MoO2, MoO3, and Mo foil. FT-EXAFS spectra at the (e) Ru K-edge and (g) Mo K-edge of MoB-RuO2. (h) Ru K-edge wavelet transform-EXAFS of MoB-RuO2, Ru foil, and RuO2. (i) Mo K-edge wavelet transform-EXAFS of MoB-RuO2, MoO2, MoO3, and Mo foil.
Figure 3
Electrocatalytic OER performance in acidic media. (a-c) LSV curves, overpotentials at the current density of 10 mA/cm2, and Tafel plots for MoB-RuO2, B-RuO2, Mo-RuO2, RuO2, and commercial RuO2. (d) Chronopotentiometry test at 10 mA/cm2 current density. (e) Comparison of stability between MoB-RuO2 and recently reported Ru-based OER electrocatalysts. (f) The chronopotentiometry test of MoB-RuO2 at the current density of 200 mA/cm2.
Figure 4
Mechanism and theoretical analysis. (a) In-situ DEMS signals of the generated 32O2, 34O2, and 36O2versus time when performing LSV tests in H216O electrolyte for 18O-surface labeled MoB-RuO2. (b) Calculated free-energy diagrams for OER on MoB-RuO2 surfaces. (c) DFT-optimized structures of MoB-RuO2, B-RuO2, Mo-RuO2 and RuO2. (d) PDOS of d-bands of active Ru for MoB-RuO2 and Mo-RuO2; corresponding d-band centres are denoted by arrows. (e) COHP of active Ru for MoB-RuO2 and RuO2.
Figure 5
Performance of PEMWE device. (a) Schematic illustration of the PEM electrolyzer. (b) Polarization curves of the PEM electrolyzers using MoB-RuO2 or RuO2 as anode catalyst and commercial Pt/C as a cathodic catalyst at 80 ℃. (c) Chronoamperometry of the PEM electrolyzer with MoB-RuO2 as anode at current density of 50 and 200 mA/cm2.

 DownLoad:

 下载:
下载:


 下载:
下载:
