Received Date:
12 December 2024 Accepted Date:
24 February 2025 Revised Date:
18 February 2025 Available Online:
15 June 2026
Abstract:
Exploring multiphase interfaces to modulate the electronic structure of catalysts is critical for energy conversion catalysis processes. Herein, we demonstrated the carbon-constrained heterogeneous NiTe-MoTe2 microsphere catalysts with high performance induced by heterostructure charge redistribution for energy-saving hydrogen generation from urea electrolysis. The hybrid NiTe-MoTe2 generated the optimized Gibbs adsorption-free energy for reducing the reaction energy barrier and enhancing catalytic kinetics. The high-valence Mo created a favorable chemical environment for positively charged Ni species formation by modulating the electronic structure. The NiTe-MoTe2 composites exhibit superior electrocatalytic activity compared to the pure-phase NiTe or MoTe2 catalysts, achieving a current density of 10 mA/cm2 at 1.40 V for urea oxidation, along with rapid catalytic kinetics and robust stability. The NiTe-MoTe2Pt/C electrolyzer achieves a current density of 10 mA/cm2 at a cell potential of 1.49 V and maintains excellent long-term durability over 120 h at 1.60 V for urea electrolysis. The promoted spontaneous dehydrogenation and CO2 desorption ability catalyzed by NiTe-MoTe2 largely improved the reaction kinetics and performance. The current work showed new insights for the development of advanced energy conversion catalytic mate.
Green hydrogen is regarded as a pathway to realize a sustainable energy future [1,2]. The urea oxidation reaction (UOR) has gained significant attention as a promising alternative to the oxygen evolution reaction (OER) for efficient hydrogen production via water electrolysis [3,4]. Unlike OER, which requires a higher thermodynamic potential of 1.23 V, UOR operates at a much lower thermodynamic potential of 0.37 V, resulting in reduced energy consumption [5,6]. Additionally, UOR decomposes into non-toxic nitrogen and carbon dioxide, offering the dual benefit of purifying urea-rich wastewater and generating clean energy [7]. Intensive attention is thus received for the UOR study considering its economic values for energy production and dealing with environmental pollution [8]. However, UOR involves a complex six-electron transfer process with multiple intermediate steps for adsorption and desorption, which can hinder urea conversion efficiency and elevate reaction potentials [9,10]. Therefore, developing efficient and cost-effective UOR electrocatalysts to enhance reaction efficiency at lower potentials is crucial.
Nickel-based catalysts have shown substantial promise in industrial applications due to their low cost, tunable structure, good compatibility, inherent catalytic activity, and ease of forming active phases [11–14]. Compared to other chalcogenides, telluride usually shows a small band gap, which is beneficial for improving the conductivity of the catalyst [15]. Among them, nickel-based telluride catalysts have attracted considerable interest due to their low electronegativity, high conductivity, and efficient mass transfer properties [16–18]. Nickel tellurides possess intrinsic metallic properties, enhancing their performance as electrocatalysts [19]. Nevertheless, the activity and stability of telluride catalysts during redox processes require further improvement. Enhancing catalytic performance can be achieved by modifying the electronic structure and rearranging valence electrons, such as through element doping, defect introduction, strain engineering, or interface engineering [20–23]. Particularly, interface engineering has proven to be a promising strategy for improving UOR catalyst activity. It regulates electron transfer and redistribution at heterogeneous interfaces through interface interactions and synergistic effects, promoting the formation of highly active species, accelerating urea molecule adsorption and desorption, and enhancing electrocatalytic performance [24,25]. For instance, spontaneous charge transfer on the surface of CoS1.097/Ni3S2 heterojunctions induces the formation of local electrophilic/nucleophilic regions, and the construction of a built-in electric field helps control the adsorption and directional distribution of urea molecules, thereby enhancing water and urea oxidation performance [26]. Similarly, the high-efficiency synergistic effect of the NiSe2−MoSe2 heterogeneous catalyst promotes the high-activity UOR process due to simple active phase formation and high charge transfer ability induced by asymmetric charge redistribution at the interface [27]. The electronegativity difference between Mo and Ni elements induces self-driven charge transfer and interface coupling effects [28,29]. Therefore, the formation of heterojunction of NiTe and MoTe2 would be a viable strategy, potentially yielding highly active Ni catalysts. The charge redistribution by partial electron transfer with modulated d-band states will, as a result, improve the adsorption property of the intermediates and promote the catalytic kinetics.
To address the stability issue of catalysts, encapsulating transition metals in carbon layers is considered a promising approach [30–32]. Compared with Ni-WO2, carbon-coated Ni-WO2 exhibits more favorable UOR catalytic activity and stability [33]. In summary, heterojunction catalysts encapsulated in carbon shells are expected to provide enhanced UOR catalytic behavior. To our knowledge, NiMo-based tellurides encapsulated in carbon layers have not been synthesized for electrocatalytic UOR. In this study, we prepared a carbon-constrained NiTe-MoTe2 nanosphere composite material using a high-temperature tellurization process, resulting in uniformly dispersed NiTe and MoTe2 particles forming a solid sphere. Compared with pure NiTe and MoTe2, this composite demonstrates significant UOR catalytic activity and rapid kinetics, achieving a current density of 10 mA/cm2 at 1.40 V and a Tafel slope of 27.5 mV/dec. Additionally, the NiTe-MoTe2 catalyst exhibits excellent long-term durability, sustaining urea electrolysis for 120 h at a potential of 1.60 V. The exceptional UOR performance suggests that NiTe-MoTe2 increases the electrochemically active surface area, enhances the interaction between NiTe and MoTe2, leads to electron density redistribution, optimizes intermediate adsorption behavior, and boosts UOR activity. This work provides valuable design insights for the preparation of telluride heterogeneous catalysts for UOR through a simple, efficient, and cost-effective synthesis route.
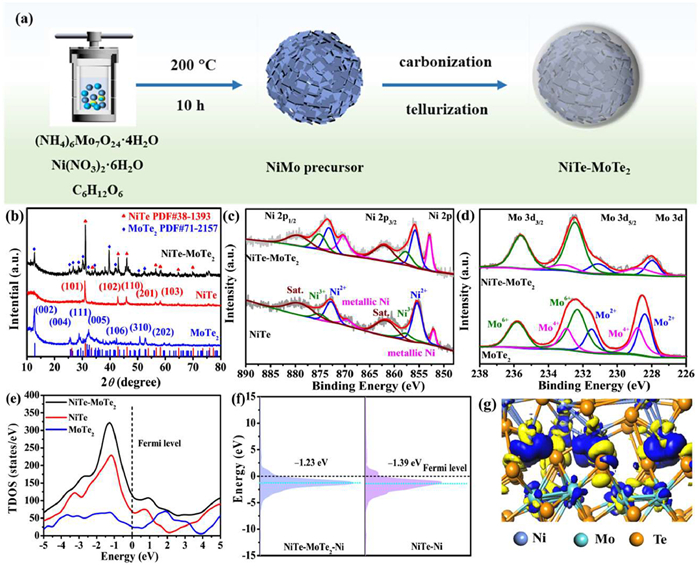
The fabrication schematism of NiTe-MoTe2 shown in Fig. 1a employed a simple one-step hydrothermal approach to get the NiMo precursors and a further high-temperature tellurization process to get the final product. Specifically, the NiMo precursor was first prepared employing Ni(NO3)2·6H2O, (NH4)6Mo7O24·4H2O, and glucose mixed with ethylene glycol and ultrapure water subjected to hydrothermal treatment. The precursor was then calcined with Te powder at 800 ℃ for 2 h under an H2/Ar2 atmosphere. During this high-temperature tellurization process, glucose acted as a carbon source, forming a carbon protective layer on the surface of the material, resulting in carbon-confined NiTe-MoTe2 nanosphere composites. For comparison, pure NiTe and MoTe2 were also synthesized to probe the structural and performance benefits of the composites. The crystal structure of the sample was identified using X-ray diffraction (XRD). In the XRD patterns (Fig. 1b), The hexagonal structure of NiTe was confirmed by the typical diffraction peaks (PDF #38–1393) as indicated by the corresponding planes [34], and the diffraction peaks corresponding to the (002), (004), (201), and (005) planes of monoclinic structured MoTe2 (PDF #71–2157) were also indicated, respectively [35]. The diffraction peaks observed in NiTe-MoTe2 are attributed to NiTe and MoTe2, confirming the formation of a mixed crystal phase. To determine the surface chemical state and electronic structure of the samples, X-ray photoelectron spectroscopy (XPS) was performed on NiTe, MoTe2, and NiTe-MoTe2 materials (Fig. S1a in Supporting information). High-resolution XPS spectra of all relevant elements were analyzed after calibration to the C 1s spectrum at C–C bonds (284.8 eV) (Fig. S1b in Supporting information). The high-resolution XPS spectrum of Ni 2p exhibits two spin-orbit doublets corresponding to the 2p1/2 and 2p3/2 components [36], with each component fitted according to different chemical states (Fig. 1c and Table S1 in Supporting information). For NiTe, the Ni 2p spectrum shows peaks at 852.1, 855.4, and 857.7 eV, corresponding to metallic Ni, Ni2+, and Ni3+, respectively [5]. In the NiTe-MoTe2 composite catalyst, the peak at 852.9 eV is attributed to metallic Ni, while the remaining peaks correspond to the chemical states of Ni2+ and Ni3+ [37]. The binding energy of NiTe-MoTe2 was found to shift towards high binding energy, indicating electron transfer within the surface heterojunction, resulting in Ni being in a high-valence, electron-deficient state. Specifically, the Ni3+ content in the NiTe-MoTe2 catalyst was 26.8%, significantly higher than that in pure NiTe. The Ni in the NiTe-MoTe2 heterojunction catalyst exhibits a clear electron-deficient state, which is associated with its catalytic activity [36]. This electron deficiency can promote electron transport and the formation of reaction-active intermediates, with the high Ni3+ content playing a crucial catalytic role in the oxidation reaction, thereby enhancing catalytic activity.
Figure 1
Figure 1.
(a) Schematic synthetic process of NiTe-MoTe2. (b) XRD patterns of NiTe-MoTe2, NiTe, and MoTe2. XPS spectra of (c) Ni 2p, and (d) Mo 3d. (e) DOS, and (f) PDOS of NiTe-MoTe2, NiTe, and MoTe2 catalysts. (g) Electron density difference for NiTe-MoTe2.
Simultaneously, significant changes were observed in the Mo 3d spectrum profiles of NiTe-MoTe2 compared to MoTe2 (Fig. 1d). The high-resolution spectrum of Mo 3d can be deconvoluted into several peaks corresponding to different chemical states, based on spin-orbit splitting and phase state (Table S2 in Supporting information) [38,39]. For pure MoTe2, the Mo 3d spectrum can be deconvoluted into Mo2+, Mo4+, and Mo6+. Three characteristic peaks observed at binding energies of 228.8, 231.3, and 232.3 eV correspond to Mo2+, Mo4+, and high-valence Mo6+ for Mo 3d5/2 component, respectively. The presence of multiple valence states is likely due to disproportionation reactions and surface oxidation of the material post-synthesis [40]. In contrast, the interaction between NiTe and MoTe2 during the synthesis of the composite material leads to a more significant change in the valence states of molybdenum, primarily manifesting as a substantial increase in the high-valence Mo6+ content. Specifically, the NiTe-MoTe2 composite exhibits a 68% high-valence Mo6+ content, compared to only 44.5% in MoTe2. This indicates that the construction of the composite material is favorable for modulating the electronic structure. The presence of high-valence Mo can create a favorable chemical environment for positively charged Ni species, further enhancing catalytic reactions [41]. For the Te 3d spectrum, the two peaks attributed to Te 3d5/2 are located at 573.1 eV and 576.4 eV, corresponding to the Te–Ni/Mo bond within the system and the Te–O bond formed from surface oxidation, respectively (Fig. S1c and Table S3 in Supporting information). These observations highlight the unique characteristics of the NiTe-MoTe2 catalyst in terms of heterogeneous interfaces and interactions, providing important insights for further understanding and optimizing the performance of transition metal telluride catalysts in related reactions.
The structure-property analysis was performed to elucidate the electronic structure of the NiTe-MoTe2 heterointerface using density functional theory (DFT) calculations. An optimized model comprising four layers of NiTe (102) surfaces and four layers of MoTe2 (001) surfaces was established to investigate the electronic structure of the catalyst (Fig. S2 in Supporting information). To examine the synergistic effect between NiTe and MoTe2, the density of states (DOS) for NiTe-MoTe2, NiTe, and MoTe2 were calculated (Fig. 1e). Compared to pure NiTe and MoTe2, the DOS of NiTe-MoTe2 at the Fermi level is higher, indicating that the heterointerface effect can enhance electron conductivity. Additionally, a higher Fermi level state corresponds to more efficient charge transfer, and the enhanced DOS is conducive to charge transfer for UOR [42]. Furthermore, the d-band center value (εd) of the partial density of states (PDOS) was calculated to describe the reaction kinetics [43]. According to PDOS analysis, the εd of NiTe-MoTe2 is closer to the Fermi level than that of pure NiTe (Fig. 1f), suggesting that the reaction kinetics of the NiTe-MoTe2 catalyst can be further optimized to improve catalytic performance [44,45]. By analyzing the electron density differences at the catalyst heterointerface, we can gain a deeper understanding of electron transfer within the NiTe-MoTe2 heterointerface [46]. As shown in Fig. 1g, the NiTe-MoTe2 heterointerface exhibits significant charge accumulation and depletion (yellow: electron depletion and blue: electron accumulation). This demonstrates that MoTe2 can facilitate charge accumulation and depletion by adjusting the electronic structure, which is crucial for the catalytic reaction [47]. Therefore, the synergistic interaction of NiTe and MoTe2 greatly promoted the UOR performance compared to their individual components (vide infra).
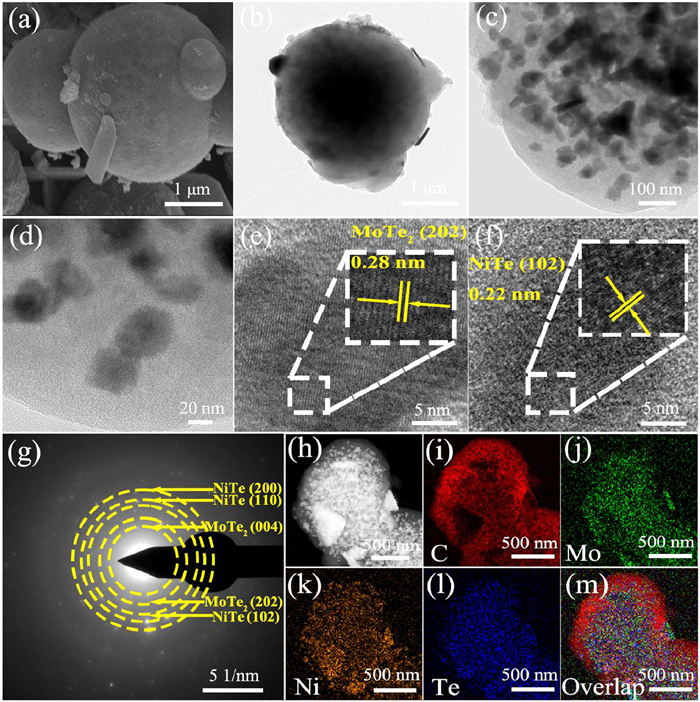
To analyze the morphology and microstructure of the catalyst, the NiTe-MoTe2 sample was examined using scanning electron microscopy (SEM) and transmission electron microscopy (TEM). As shown in Fig. 2a, the SEM image of the NiTe-MoTe2 sample shows that it is a solid sphere. After high-temperature annealing and telluride treatment, the nano-particles were uniformly dispersed in the sphere, and the organic matter was carbonized on the surface to form a carbon layer coating, forming a solid sphere. The precise morphology and crystal microstructure of the sample were further observed through TEM and high-resolution TEM (HRTEM). As shown in Fig. 2b, the NiTe-MoTe2 catalyst features a solid sphere with dark nanoparticles distributed both on the surface and inside, covered by a light carbon layer. More additional TEM images were shown in Fig. S3 (Supporting information), where most of the particles were found confined in the carbon sphere. The particle size of nanoparticles is mainly distributed between 30 nm and 50 nm, with an average size of approximately 40 nm (Figs. 2c and d). The HRTEM clearly shows that a 0.28 nm lattice can be assigned to the (202) crystal face of MoTe2, and a 0.22 nm lattice corresponding to the (102) crystal face of NiTe, with the edge region showing the carbon layer (Figs. 2e and f). The selected area electron diffraction (SAED) pattern (Fig. 2g) shows that the NiTe-MoTe2 material has a mixed polycrystalline structure, which is consistent with the XRD results through the observation of diffraction bright spots. According to the elemental analysis in the energy dispersive X-ray spectrum (EDS), the Ni, Mo, and Te elements were found in the NiTe-MoTe2 sphere (Fig. S4 in Supporting information). The measured contents of Ni, Mo, and Te were 0.85 wt%, 0.39 wt%, and 2.33 wt%, respectively, which was close to the addition of raw materials (Ni: Mo = 1:1) (Table S4 in Supporting information). The element mapping images can further confirm that the relevant C, Ni, Te, and Mo elements are found to be uniformly distributed on the material surface (Figs. 2h-m).
Figure 2
Figure 2.
(a) SEM image, (b-d) TEM images, (e, f) HRTEM images, (g) SAED pattern, (h-m) scanning transmission electron microscopy and elemental mapping images of NiTe-MoTe2.
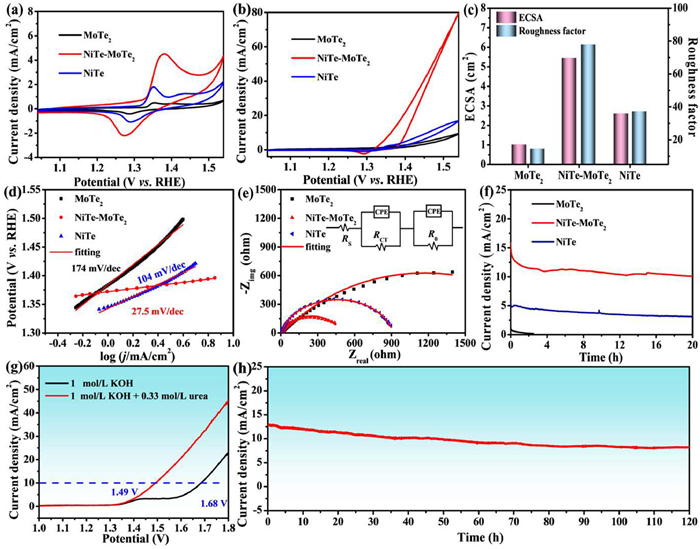
The urea oxidation performance was evaluated in a 1 mol/L KOH solution containing 0.33 mol/L urea. To explore the influence of KOH electrolyte background, the cyclic voltammograms in KOH solution below 1.54 V were compared in the same range of urea oxidation to eliminate the interference of water oxidation (Fig. 3a). The MoTe2, NiTe-MoTe2, and NiTe electrodes have a pair of redox peaks, and the redox peaks at about 1.38 V and 1.27 V correspond to the transition of Ni2+/Ni3+. The peak intensity of NiTe-MoTe2 is significantly greater than that of MoTe2 and NiTe electrodes, indicating that the NiTe-MoTe2 catalyst has more active sites for the formation of high-valence Ni3+ species. As expected, the NiTe-MoTe2 electrode showed the highest catalytic performance for UOR (Fig. 3b). The corresponding potentials are 1.40, 1.49, and 1.54 V for driving 10 mA/cm2 current density, and the current densities of NiTe-MoTe2, NiTe, and MoTe2 at 1.54 V are 80.4, 16.9, and 9.45 mA/cm2 respectively. This high current density is primarily due to urea oxidation rather than water oxidation. The nickel oxidation peak overlaps with the urea oxidation peak, indicating that the newly formed high-valence Ni species is the active phase for urea oxidation, consistent with the electrochemical-chemical (E-C) mechanism reported in the literature [48].
Figure 3
Figure 3.
Cyclic voltammetry curves of MoTe2, NiTe-MoTe2, NiTe in 1 mol/L KOH solution without (a) and with (b) 0.33 mol/L urea at 10 mV/s. (c) ECSA and roughness factor. (d) Tafel slope of catalysts. (e) Nyquist plots and fitting curves at 1.40 V. (f) CA curves at 1.44 V for 20 h. (g) LSV curve of the water and urea electrolysis of NiTe-MoTe2||Pt/C. (h) CA curve of urea electrolysis at 1.60 V for 120 h.
Considering the main role of the Ni active center in the catalytic reaction, the electrochemical surface area (ECSA) and roughness factor (Rf) based on the nickel reduction peak were calculated and compared (Fig. S5a in Supporting information). The ECSA values are 5.46 cm2 for NiTe-MoTe2, NiTe is 2.61 cm2, and MoTe2 is 1.02 cm2 (Fig. 3c), with corresponding Rf of 78, 37.3, and 14.6 respectively. The obtained high ECSA and Rf reflect the improvement of the contact area between the catalyst and the electrolyte, which is an important favorable factor in improving the activity of NiTe-MoTe2 for the urea oxidation reaction. Comparing the specific activity of the current normalized by ECSA, it was found that the catalytic efficiency of NiTe-MoTe2 was still improved (Fig. S5b in Supporting information). Specifically, the catalytic efficiency of NiTe-MoTe2 is about 0.96 mA/cm2 at 1.54 mV, approximately 1.5 times that of the NiTe catalyst (0.64 mA/cm2) and 2.1 times that of the MoTe2 catalyst (0.45 mA/cm2). The increase of ECSA and Rf means that more active centers are available for catalytic reactions, and the specific activity evaluation shows that NiTe-MoTe2 has higher catalytic efficiency due to the synergistic effect of Ni and Mo.
By increasing the scan rate, the current density corresponding to UOR on the NiTe-MoTe2, NiTe, and MoTe2 electrodes also increases accordingly (Fig. S6 in Supporting information). A linear fit shows the diffusion-controlled process of UOR on these electrodes, as shown by the square root relationship between peak current density and scan rate. The larger linear fitting slope of the NiTe-MoTe2 electrode (18.5) compared to NiTe (2.86) and MoTe2 (2.67) indicates faster catalytic kinetics. This suggests that the heterojunction system enhances surface structure changes due to electron transfer and electronic effects. The Tafel slopes of these catalysts were also calculated and compared (Fig. 3d). The Tafel slope value of NiTe-MoTe2 is 27.5 mV/dec, which is smaller than that of NiTe catalyst (104 mV/dec) and MoTe2 catalyst (174 mV/dec). Such a small value of NiTe-MoTe2 indicates favorable electron transfer of high-valence Ni3+ species prior to the rate-determining step of chemical oxidation of urea. Further analysis of the catalyst impedance was conducted using an equivalent circuit model of the electrochemical impedance spectrum (EIS). Compared with NiTe and MoTe2, the NiTe-MoTe2 electrode has the smallest charge transfer resistance (Fig. 3e). Specifically, the charge transfer resistance of NiTe-MoTe2 is fitted to 468 Ω, which is smaller than NiTe (1082 Ω) and MoTe2 (2239 Ω) (inset of Fig. 3e, Table S5 in Supporting information). The reaction kinetics of UOR were further revealed by EIS measurements at different potentials (Fig. S7 in Supporting information). As the voltage increases from 1.34 V to 1.42 V, the impedance of MoTe2 changes very little. The impedance of the NiTe sample decreased significantly at 1.40 V potential, and NiTe-MoTe2 showed an obvious impedance change at 1.38 V, indicating the beginning of UOR. These results support the idea that the heterostructure promotes electron transfer and improves catalytic kinetics. A chronoamperometry (CA) test was carried out for 20 h to observe the current attenuation trend of the sample. The NiTe-MoTe2 electrode did not show significant performance degradation after reaching a steady state, indicating strong catalytic ability and stability for UOR (Fig. 3f). In view of the excellent catalytic activity and stability of NiTe-MoTe2 for UOR, a two-electrode system using NiTe-MoTe2 as the anode and Pt/C as the cathode in a 1 mol/L KOH solution containing 0.33 mol/L urea. As shown in Fig. 3g, a current density of 10 mA/cm2 is driven at a cell voltage of 1.49 V, compared to 1.68 V in 1 mol/L KOH solution without urea. The addition of 0.33 mol/L urea significantly reduces the required potential, demonstrating that NiTe-MoTe2 can serve as an efficient electrode with NiOOH active phase for UOR electrocatalysis. The urea electrolysis performance comparisons based on some recently reported catalysts were shown in Table S6, the NiTe-MoTe2||Pt/C catalyst driven 10 mA/cm2 current density at a cell voltage of 1.49 V was smaller than most of the reported values, confirming its prospect for urea-assisted water electrolysis. The durability of NiTe-MoTe2 was tested for 120 h (Fig. 3h), showing excellent long-term stability and structural integrity. For comparison, NiTe and MoTe2 catalysts were also tested in the two-electrode system (Fig. S8 in Supporting information). To drive a current density of 10 mA/cm2, the NiTe requires a battery voltage of 1.59 V and MoTe2 requires 1.63 V, which are 100 mV and 140 mV higher, respectively, than that of the NiTe-MoTe2 catalyst. This demonstrates that the NiTe-MoTe2 catalyst has superior catalytic activity and stability for UOR. The degradation rate of urea and Faraday efficiency were further analyzed. As shown in Fig. S9 (Supporting information), the degradation rate of urea reached 14.7% after 120 h degradation at 1.60 V. The Faraday efficiency during the process was calculated based on the gas chromatography technique by analyzing the fully oxidized product of N2, and it was 91.9%, where the UOR dominated the process (Fig. S10 in Supporting information). The Faraday efficiency of water oxidation was 6.2%, and the liquid products as NO2-, NO3-, and NCO- were very low for the evaluated conditions (1.9%).
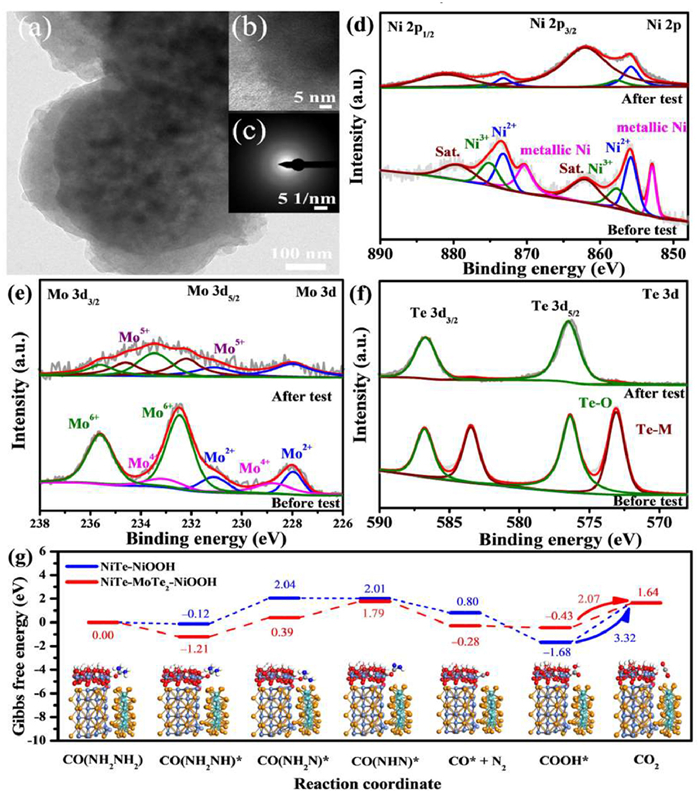
To explore changes in surface morphology and chemical state after the long-term stability test, the NiTe-MoTe2 composite catalyst after the UOR stability test was further characterized by TEM and XPS. As shown in Fig. 4a, the carbon spheres remain observable, but the surface is oxidized due to the high potential in an alkaline electrolyte. New amorphous layers formed on the surface, as indicated by the absence of lattice stripes at the edges in high-resolution TEM images (Fig. 4b). The SAED pattern did not show obvious diffraction spots (Fig. 4c), confirming the formation of amorphous oxide species due to surface oxidation and etching during long-term UOR. As shown in Fig. S11 (Supporting information), Ni and Te elements are still observable in the EDS spectrum, while the decrease in Mo content may be due to leaching in the strong alkaline electrolyte.
Figure 4
Figure 4.
(a) TEM and (b) HRTEM of NiTe-MoTe2 after stability test. (c) SAED pattern. The XPS spectra comparison for NiTe-MoTe2 catalyst before and after stability test, (d) Ni 2p, (e) Mo 3d, (f) Te 3d. (g) Free energy diagram of NiTe (102) and NiTe (102)-MoTe2 (004) for UOR.
The surface chemical structure of the NiTe-MoTe2 catalyst before and after long-term CA stability measurement was compared using XPS (Fig. S12 in Supporting information). Notably, the Ni 2p profile showed significant changes, with Ni2+ and satellite peaks dominating due to surface oxidation at high potential (Fig. 4d and Table S7 in Supporting information). The disappearance of the metallic Ni species peak further confirmed surface oxidation. Specifically, the content of Ni2+ increased from 41.4% to 73.1%, while the content of Ni3+ did not increase significantly due to its cycle process in urea oxidation. In the E-C oxidation mechanism of urea, the Ni catalyst is oxidized to form Ni2+ in solution. As the oxidation potential increases, Ni(OH)2 on the surface is electrochemically oxidized to high-valence NiOOH. The NiOOH then chemically oxidizes urea to N2 and CO2, subsequently reducing back to Ni(OH)2, thus recycling the urea oxidation reaction [49]. Therefore, after the reaction, more Ni2+ was kept to ensure the urea oxidation cycle in the next oxidation of the catalyst. Since Mo-species were not the active species for UOR, the high oxidation potentials will cause Mo-species oxidation. After the stability test, the Mo 3d distribution changed significantly with the disappearance of Mo4+ and the appearance of Mo5+ with higher binding energy (Fig. 4e). Additionally, the binding energy of high-valence Mo6+ shifts to a higher value due to surface oxidation (Table S8 in Supporting information). Though the high valent Mo species were not in the active phase, they would drive the charge redistribution in the NiTe-MoTe2 system, and thus, promoted the active phase of high valent Ni species formation. These changes in the chemical states of Ni and Mo suggest that the transition from low to high valence states in the NiTe-MoTe2 hybrid microspheres may enhance electron transport and synergistically improve UOR properties. The Te 3d spectrum further confirmed surface oxidation driven by the electrochemical reaction (Fig. 4f), with a decrease in the Te–Ni/Mo bond peak and a significant increase in the Te–O bond intensity (Table S9 in Supporting information). Specifically, the chemical state of Te was changed from Te2- to Te4+. Consistently, the increased M–O/OH bond in the O 1s spectrum was observed indicating the surface oxidation of Ni, Mo, and Te in the system (Fig. S12 in Supporting information).
Based on the UOR catalytic mechanism, the oxidation activity of urea is derived from high-valence Ni3+ oxide species. Therefore, a layer of NiOOH on the surface of NiTe-MoTe2 was constructed to serve as an active species for adsorbing urea to obtain the thermodynamic information of the catalytic UOR mechanism. By constructing the model of each reaction intermediate, the Gibbs free energy of UOR reaction path was calculated on the optimized model (Fig. 4g). The UOR pathway was determined according to the recently reported oxidation mechanism of urea, divided into 6 stages: *CO(NH2)2 → *CO(NH2NH) → *CO(NH2 N) →*CO(NHN) → *CO(N2) → *CO(OH) → *CO2 [50]. The four initial steps of the UOR process involve the deprotonation of four hydrogen atoms from the urea molecule, followed by the release of N2 and CO2 [51]. After the urea molecule is adsorbed on the catalyst surface, it first loses an H atom to form CONH2NH*. This step requires that the free energy on NiTe-MoTe2 is −1.21 eV, which is lower than that on NiTe (−0.12 eV). This negative free energy indicates the spontaneous dehydrogenation of urea on NiTe-MoTe2. Moreover, a larger change in Gibbs free energy corresponds to a higher energy barrier, which is a key step in the reaction, often referred to as the rate-determining step (RDS). As shown in Fig. 4g, NiTe and NiTe-MoTe2 share the same RDS for CO2 desorption. The lowest RDS energy barrier for NiTe-MoTe2 is 2.07 eV, indicating superior UOR catalytic kinetics. In contrast, the highest RDS energy barrier for NiTe is 3.32 eV, which hinders the continuous progress of urea oxidation and affects the reaction activity. These findings align with electrochemical experimental results, demonstrating that constructing the NiTe-MoTe2 composite can reduce the reaction energy barrier, improve reaction kinetics, and enhance the catalytic reaction.
In summary, carbon-confined NiTe-MoTe2 nanosphere composites were found effective in energy-saving hydrogen generation from UOR induced by heterostructure charge redistribution. The high-valence Mo created a favorable chemical environment for high-valent Ni active species formation by modulating the electronic structure, which optimized the Gibbs adsorption-free energy for reducing the reaction energy barrier. The NiTe-MoTe2 composites exhibit superior electrocatalytic activity compared to the pure-phase NiTe or MoTe2 catalysts, achieving a current density of 10 mA/cm2 at 1.40 V for UOR, along with rapid catalytic kinetics and robust stability over 120 h at a potential of 1.60 V. This hybrid catalyst showed the increased electrochemically active surface area and electronic interaction between NiTe and MoTe2, which decreases the binding strength of the intermediates and enhances charge transfer ability in reaction kinetics. Thus, the NiTe-MoTe2 catalyst showed the promoted spontaneous dehydrogenation and CO2 desorption ability in boosting UOR. The work offers a novel catalyst platform of carbon sphere conveyed heterogeneous catalysts for energy conversion catalysis reactions.
Declaration of competing interest
The authors declare that they have no known competing financial interests or personal relationships that could have appeared to influence the work reported in this paper.
The work was supported by the National Natural Science Foundation of China (No. 22272148). Chun Yin thanks the support of Postgraduate Research&Practice Innovation Program of Jiangsu Province (Yangzhou University) (No. KYCX24_3720).
Supplementary materials
Supplementary material associated with this article can be found, in the online version, at doi:10.1016/j.cclet.2025.110999.
[1]
Z. Miao, G. Wu, Q. Wang, et al., Mater. Rep.: Energy 3 (2023) 100235.
[2]
X.Q. Qiao, W. Chen, C. Li, et al., Mater. Rep.: Energy 3 (2023) 100234.
[3]
C. Liu, L. Feng, Chin. J. Struct. Chem. 42 (2023) 100136.
[4]
S. Xu, Q. Wu, B.A. Lu, et al., Acta Phys. Chim. Sin. 39 (2023) 2209001.
F. Yang, P. Han, N. Yao, et al., Chem. Sci. 11 (2020) 12118–12123. doi: 10.1039/d0sc03917a
[47]
F. Nie, Z. Li, X. Dai, et al., Chem. Eng. J. 431 (2022) 134080.
[48]
L. Wang, M. Li, Z. Huang, et al., J. Power Sources 264 (2014) 282–289.
[49]
X. Zhang, G. Ma, L. Shui, G. Zhou, X. Wang, J. Energy Chem. 72 (2022) 88–96. doi: 10.1117/12.2657525
[50]
L. Zhang, L. Wang, H. Lin, et al., Angew. Chem. Int. Ed. 58 (2019) 16820–16825. doi: 10.1002/anie.201909832
[51]
H. Li, Y. Liu, X. Wang, et al., Chin. Chem. Lett. 36 (2025) 110042.
Figure 1
(a) Schematic synthetic process of NiTe-MoTe2. (b) XRD patterns of NiTe-MoTe2, NiTe, and MoTe2. XPS spectra of (c) Ni 2p, and (d) Mo 3d. (e) DOS, and (f) PDOS of NiTe-MoTe2, NiTe, and MoTe2 catalysts. (g) Electron density difference for NiTe-MoTe2.
Figure 3
Cyclic voltammetry curves of MoTe2, NiTe-MoTe2, NiTe in 1 mol/L KOH solution without (a) and with (b) 0.33 mol/L urea at 10 mV/s. (c) ECSA and roughness factor. (d) Tafel slope of catalysts. (e) Nyquist plots and fitting curves at 1.40 V. (f) CA curves at 1.44 V for 20 h. (g) LSV curve of the water and urea electrolysis of NiTe-MoTe2||Pt/C. (h) CA curve of urea electrolysis at 1.60 V for 120 h.
Figure 4
(a) TEM and (b) HRTEM of NiTe-MoTe2 after stability test. (c) SAED pattern. The XPS spectra comparison for NiTe-MoTe2 catalyst before and after stability test, (d) Ni 2p, (e) Mo 3d, (f) Te 3d. (g) Free energy diagram of NiTe (102) and NiTe (102)-MoTe2 (004) for UOR.

 DownLoad:

 下载:
下载:


 下载:
下载:
