Citation:
Bo-Bo Zou, Hong-Jie Peng. Phase diagram as a lens for unveiling thermodynamics trends in lithium–sulfur batteries[J]. Chinese Chemical Letters,
2025, 36(7): 110986.
doi:
10.1016/j.cclet.2025.110986
Phase diagram as a lens for unveiling thermodynamics trends in lithium–sulfur batteries
English
Phase diagram as a lens for unveiling thermodynamics trends in lithium–sulfur batteries
Lithium–sulfur battery (LSB) has attracted worldwide attention owing to its overwhelmingly high theoretical energy density of 2600 Wh/kg due to the unique 16-electron electrochemical conversion reaction of elemental sulfur (S8) [1]. However, the electrochemical conversion reaction of S8 is an exceedingly complex process that involves the generation of multiple intermediates (e.g., lithium polysulfides (LiPSs)) and multiphase transitions [1, 2]. Currently, the mechanistic investigations of the electrochemical conversion reaction of S8 upon discharging a LSB cell heavily rely on electrochemical titration and spectroscopic techniques [3]. Nevertheless, the considerable complexity and intrinsic instability of the LSB system present substantial obstacles to obtaining accurate information for all sulfur-containing species, which significantly obstructs in-depth elucidation of the fundamental discharge mechanism of LSB [3, 4].
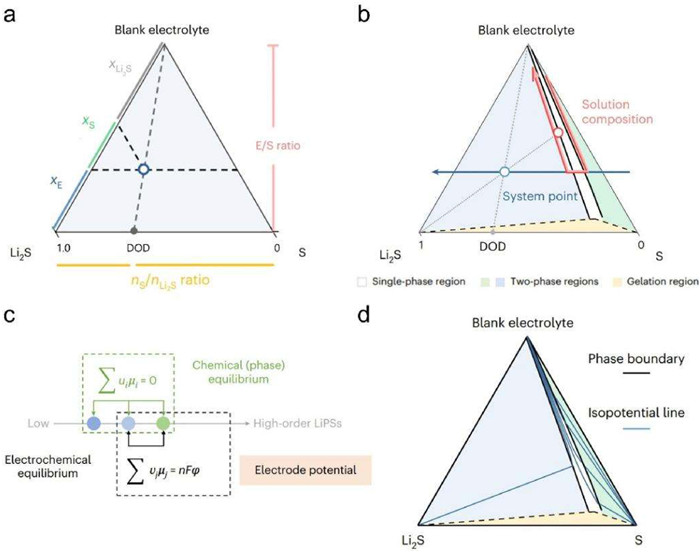
Recently, as published in Nature Chemical Engineering, a team led by Qiang Zhang and Bo-Quan Li described an innovative method leveraging phase diagrams for thermodynamics equilibrium analysis of LSB, establishing a solid foundation for the mechanistic understandings of discharge mechanisms in LSB utilizing liquid electrolytes [5]. They first elucidated the degrees of freedom within the LSB following the Gibbs phase rule and thereafter developed a ternary phase diagram representing the three representative components: S8, lithium sulfide (Li2S), and electrolyte, of which the respective molar fraction is denoted as xS, xLi and xE (Fig. 1a). Specifically, xE (on the same horizontal line) corresponds to an identical electrolyte-to-sulfur (E/S) ratio, and the line through the blank electrolyte vertex corresponds to the same ratio of xS to xLi, namely the same depth of discharge (DOD) or the same nominal formula of LiPS solutions. Furthermore, the authors developed a delicate experimental methodology to accurately correlate each system point in the ternary phase diagram to a specific solution composition. Suspensions with the different ration of Li2S, S8, and electrolyte were aged for months to reach equilibrium state, and the supernatants were then subjected to elemental analysis to determine the solution-phase composition, which was used to plot the phase region boundaries via the lever rule. Initially established with a conventional mixed-ether-based electrolyte (1.0 mol/L lithium bis(trifluoromethane)sulfonamide dissolved in 1, 2-dimethoxyethane/1, 3-dioxolane with a volume ratio of 3:1), the phase diagram can be divided into one single-phase region (i.e., LiPS solutions with fully variable concentration and nominal LiPS formula), two-phase regions (i.e., saturated LiPS solutions with excessive solids of either Li2S or S8), and a gelation region where LiPS and Li salts are highly crosslinked due to the decrease in free solvent molecules (Fig. 1b). Note that for the system point in each two-phase region, the solution composition strictly corresponds to each boundary with the single-phase region. Therefore, for the discharge process of a LSB cell at a given E/S ratio, the system point shifts along a horizontal line (the blue line in Fig. 1b) from the right to the left side as the DOD increases. Meanwhile, according to the lever rule, the solution point firstly shifts downward along the boundary between S8-saturated two-phase region and the single-phase region, then along the horizontal line across the single-phase region, and finally along the boundary between Li2S-saturated two-phase region and the single-phase region. The three-stage moves (the red lines in Fig. 1b) of the solution point quantitatively align with the solid–liquid–solid phase transition in a LSB and the three-stage discharge voltage curve as well. Consequently, the ternary phase diagram reveals that the capacity ratio between the first two stages and the last stage is 1:4.5 rather than the previous consensus of 1:3 [4]. With such an update in the fundamental understanding, the authors pointed out that insufficient liquid−solid deposition should be the main reason of capacity loss during discharge process. Furthermore, for the first time, the identification of a gel phase within the LSB can help to elucidate the origin of extreme cell polarization and poor electrode kinetics at practically demanded low E/S ratio. And thus simply reducing the E/S ratio does not necessarily result in an increase in energy density of a practical LSB cell. The methodology can be further leveraged to analyze phase equilibrium in LSBs utilizing various liquid electrolytes, rationalizing the unique discharge behaviors in both encapsulated polysulfide electrolyte and localized high-concentration electrolyte.
Figure 1
Figure 1.
Schematic illustrations of (a) a ternary S8–Li2S–electrolyte phase diagram and the way of reading the system composition, (b) an experimentally measured ternary phase diagram using a conventional mixed-ether-based blank electrolyte, showing four regions and the paths along which the system and solution points shift upon discharge, (c) the method to correlate chemical equilibrium and electrochemical equilibrium in the LSB using an imaginary inert electrode, and (d) the map of isopotential lines in a LSB phase diagram. Reproduced and adapted with permission [5], Copyright 2024, Springer Nature.
Aiming to translating the experimental observations with ternary S8–Li2S–electrolyte phase diagram into understandings of a working electrochemical LSB system, the authors further correlated phase equilibrium and electrochemical equilibrium by the use of an imaginary inert electrode (Fig. 1c). Key assumptions include the constancy of chemical potential of dissolved S8 at the S8-saturated boundary and the neglect of change in activity coefficient of the blank electrolyte. As a result, any point in the phase diagram is associated with an electrochemical potential and thus the phase diagram can be replotted as an ensemble of isopotential lines (Fig. 1d). The density of these isopotential lines in different regions decreases from the single-phase region, to the S8-saturated two-phase region, and sharply to the Li2S-saturated two-phase region, quantitatively reflecting the voltage decline rate during each discharge stage. This theory establishes a relationship between phase equilibrium and electrochemical equilibrium in LSB, offering a novel paradigm for investigating analogous electrochemical processes involving multiphase transition reactions. Further improvement of such theory is forecasted by incorporating the more complex effects of S8/Li2S/electrolyte mixing and interactions (e.g., solvation, ionic coordination), as well as the variations in activity coefficient. The above improvement may contribute to better understandings of the gel region in the phase diagram, or the behaviors of unconventional electrolytes such those with a high salt concentration.
In summary, the work by Zhang, Li, and their colleagues has innovatively employed phase equilibrium analysis to reveal the thermodynamic principles of LSB. Having established the ternary phase diagram, they have renewed the understandings of the capacity ratio between the two discharge plateaus. The renewed ratio from 1:3 to 1:4.5 rather more points out that insufficient liquid−solid deposition is the main limitation of the discharge of LSB. Furthermore, the established relationship between the phase boundary and equilibrium electrode potential at each point in the phase diagram enables the prediction of LSB thermodynamics at any given state. This study refreshes the fundamental knowledge in LSB discharge thermodynamics and offers a more streamlined paradigm to optimize the performance of contemporary LSB systems and to effectively investigate analogous electrochemical processes involving multiphase transition reactions. In addition, open questions such as the phase equilibrium behaviors during the charging of a LSB cell have remained unresolved, which may motivate future studies applying the new paradigm in battery research.
Declaration of competing interest
The authors declare that they have no known competing financial interests or personal relationships that could have appeared to influence the work reported in this paper.
Y. Yan, X.Y. Liu, Chin. Chem. Lett. 34 (2023) 108032.
[3]
Q. He, A.T.S. Freiberg, M.U.M. Patel, et al., J. Electrochem. Soc. 167 (2020) 080508. doi: 10.1149/1945-7111/ab8645
[4]
Q. Wang, J.M. Zheng, E. Walter, et al., J. Electrochem. Soc. 162 (2015) A474–A478. doi: 10.1149/2.0851503jes
[5]
Y. -W. Song, L. Shen, X. -Y. Li, et al., Nat. Chem. Eng. 1 (2024) 588–596. doi: 10.1038/s44286-024-00115-4
Figure 1
Schematic illustrations of (a) a ternary S8–Li2S–electrolyte phase diagram and the way of reading the system composition, (b) an experimentally measured ternary phase diagram using a conventional mixed-ether-based blank electrolyte, showing four regions and the paths along which the system and solution points shift upon discharge, (c) the method to correlate chemical equilibrium and electrochemical equilibrium in the LSB using an imaginary inert electrode, and (d) the map of isopotential lines in a LSB phase diagram. Reproduced and adapted with permission [5], Copyright 2024, Springer Nature.

 DownLoad:

 下载:
下载:


 下载:
下载:
