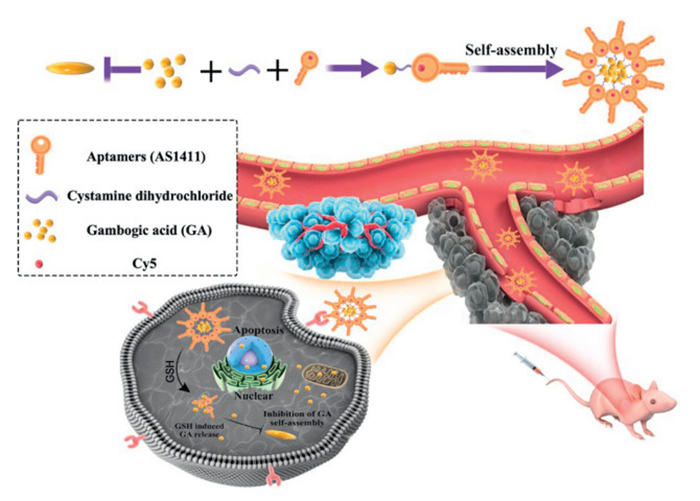
Scheme 1.
Schematic overview of the preparation and in vitro and in vivo applications of the nanodrugs, designated as GA-S-S-AS-NPs.
Multifunctional carrier-free nanodrugs for enhanced delivery and efficacy of hydrophobic antitumor drugs
Zerong Pei , Suyun Hu , Huimin Wei , Liqin Ding , Jingbo Liu , Fengyun Li , Hongyu Chen

Malignant neoplasms represent a considerable threat to human health, accounting for a substantial proportion of global morbidity and mortality each year [1,2]. The primary modalities for tumor treatment encompass surgical, radiation, and chemotherapeutic approaches [3]. Pharmacotherapy is gaining recognition as a more effective strategy for managing postoperative, advanced, recurrent, and metastatic tumors, compared to localized interventions such as surgery and radiation therapy [4]. However, the therapeutic efficacy of potent antitumor agents is often compromised by the considerable heterogeneity of tumor microenvironment [5–8].
The utilization of traditional Chinese medicine (TCM) has facilitated the advancement and utilization of TCM constituents and bioactive compounds [9]. Gambogic acid (GA), a bioactive compound derived from the traditional Chinese medicine Garcinia, has demonstrated efficacy as a natural broad-spectrum antitumor agent and an inhibitor of heat shock protein 90 (HSP90), a protein closely associated with the regulation of tumor cell proliferation and apoptosis [10,11]. Research has indicated that GA exhibits a lower effective therapeutic concentration compared to other antitumor drugs and is relatively safe, with minimal adverse effects on cardiovascular and respiratory systems [12]. Its antitumor mechanism involves various processes including apoptosis induction, autophagy, anti-proliferation, accumulation of reactive oxygen species (ROS), inhibition of enzymes (such as telomerase) and growth factors (such as vascular endothelial growth factor (VEGF)), modulation of the nuclear transcription factor κ-activated B cell light chain enhancer (NF-κB) signaling pathway [13–15], and other related pathways. The National Medical Products Administration (NMPA) has granted approval for GA as an antitumor medication for solid tumors in phase 3 clinical trials [16]; however, its effectiveness remains suboptimal due to limited drug solubility and inadequate off-target toxicity [17]. Therefore, in order to obtain the intended anticancer effects, greater doses and repeated administrations are required; nevertheless, using this strategy runs the risk of aggravating systemic toxicity, chemotherapy resistance, and tumor metastasis.
The application of nanotechnology in the delivery of GA is considered a promising and effective approach [18–24]. Researchers both domestically and internationally have explored various methods, including the incorporation of gambogic acid into liposomes, micelles, vesicles, and magnetic nanoparticles (NPs) [25–27]. However, many nano-delivery systems rely on encapsulating drugs within carrier materials through intermolecular interactions, such as hydrophobic interactions. This can lead to a lack of affinity between the drug and carrier materials, resulting in premature drug leakage [28–30]. Furthermore, the excessive use of carrier materials can hinder drug loading efficiency and potentially introduce toxicity associated with the carriers. Despite advancements in some new nano-delivery systems, challenges such as complex preparation processes, high production costs, and the use of organic solvents hinder their clinical transformation [31,32]. Consequently, the rational design of advanced nano-delivery systems remains a challenge. In recent years, the utilization of the hydrophobic properties of drugs has garnered considerable attention for the self-assembly of pure drugs, owing to its notable therapeutic efficacy, straightforward preparation process, and high administration efficiency [33,34]. The self-assembled pure drug system is a new generation of drug delivery nanoplatforms that completely consists of active drug components, hence resolving concerns regarding the toxicity caused by non-therapeutic carriers [35–38]. Nevertheless, limited research has been conducted on the potential decrease in drug efficacy following the self-assembly of pure drugs into nanodrugs, and solutions to this problem are even rarer [39–42].
Herein, we introduce a novel finding that hydrophobic GA can undergo self-assembly into NPs with specific structures through one-step nanoprecipitation in an aqueous medium. Unlike the improved therapeutic outcomes seen with the self-assembly of other monomeric drugs, the therapeutic effectiveness of GA post self-assembly is determined to be suboptimal in comparison to the equivalent free drug. According to the aforementioned results, a multifunctional carrier-free nanodrug was formulated in the current study, offering benefits such as straightforward preparation, high drug loading capacity, active targeting of tumor, as well as tumor microenvironment responsiveness. Specifically, the anticancer drug GA was utilized to establish a connection with the aptamer (AS) via a disulfide bond, resulting in the formation of nanodrugs GA-S-S-AS NPs through self-assembly. This approach maintains nano-size delivery, inhibits the self-assembly of pure drugs, and enhances the antitumor efficacy (Scheme 1). The aptamers incorporated in the nanodrugs provide both stability and specificity by targeting nucleolin receptors overexpressed on liver cancer cells [43–45]. The introduction of disulfide bonds disrupted the self-assembly properties of GA, enabling GA-S-S-AS NPs to react to elevated levels of glutathione in the tumor site, leading to the liberation of free GA. The negative charge of GA-S-S-AS NPs, attributed to the external aptamer, significantly enhances the circulation duration of the drug delivery system and the accumulation of the nanodrug within the tumor. Furthermore, the incorporation of Cy5 into the aptamer facilitates convenient visualization of the nanodrugs both in vitro and in vivo. Collectively, the findings demonstrate that the GA-S-S-AS NPs exhibit targeted tumor localization, effective internalization, robust fluorescence imaging capabilities, and notable antitumor efficacy. In summary, this research effectively addresses the issue of diminished efficacy resulting from the self-assembly of hydrophobic drugs in aqueous environments, enhances the antitumor potency of such drugs, and establishes a basis for further exploration of novel formulations for hydrophobic antitumor drugs.
Firstly, the GA NPs were formed via self-assembly of unmodified GA without the use of surfactants through a one-step nanoprecipitation process. Subsequently, the multifunctional nanodrug GA-S-S-AS NPs were synthesized through a simple acylation reaction and subsequent self-assembly process (Fig. 1A). In order to enhance the responsiveness of the nanodrug to the reducing conditions found at the tumor site and promote the release of active drugs, a disulfide bond was integrated between GA and the aptamer. Initially, the disulfide bond was introduced onto GA via an acylation reaction to produce GA-S-S-NH2, with validation of successful synthesis confirmed through mass spectrometry and nuclear magnetic resonance analysis (Figs. S1 and S2A in Supporting information). Subsequently, the reaction between GA-S-S-NH2 and the carboxylated aptamer AS1411 resulted in the formation of GA-S-S-AS through acylation. The larger molecular weight of GA-S-S-AS led to a slower migration rate in electrophoresis compared to the free aptamer, indicating successful preparation as evidenced by the shift in band position in gel electrophoresis (Fig. S2B in Supporting information). Finally, since aptamer is highly hydrophilic and GA is hydrophobic, the amphiphilic GA-S-S-AS conjugates spontaneously assemble into GA-S-S-AS NPs in aqueous solution. Meanwhile, the control nanodrug GA-AS NPs without disulfide bond were also prepared through acylation reaction and self-assembly.
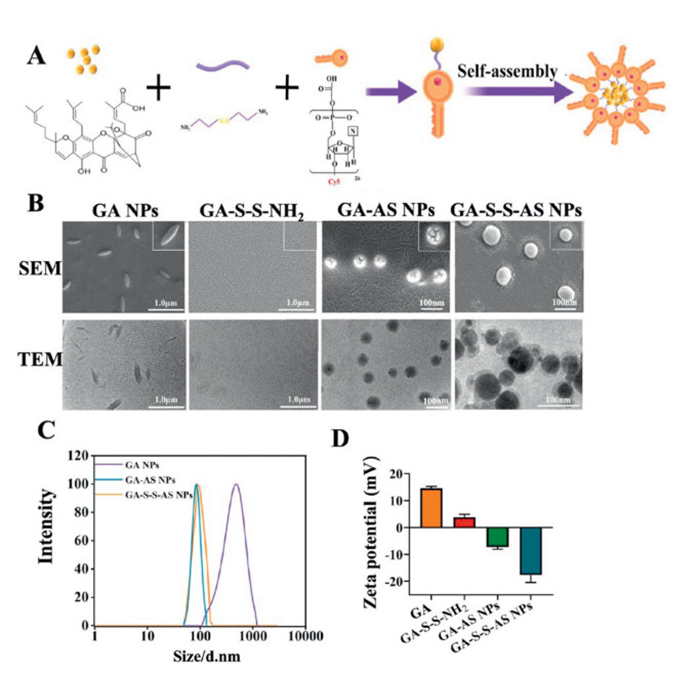
To ascertain and delineate the formation of nanodrugs, the Tyndall effect of each group was initially examined (Fig. S2C in Supporting information). The GA-NPs, GA-AS NPs, and GA-S-S-AS NPs groups all exhibited notable Tyndall effect, indicating the successful formation of stable nanostructures. Conversely, under identical conditions, the GA-S-S-NH2 group did not display the Tyndall effect, suggesting a lack of nanostructure formation, potentially attributed to the disruption of self-assembly conditions following GA modification of the disulfide bond. Next, the morphological features of each group were illustrated through the use of scanning electron microscopy (SEM) and transmission electron microscopy (TEM) (Fig. 1B). The AS NPs displayed a consistent spindle-shaped structure with a diameter exceeding 200 nm, which was found to be unfavorable for the enhanced permeability and retention (EPR) effect within the tumor microenvironment. Conversely, the GA-S-S-NH2 did not display any discernible nanostructure, providing additional evidence that the modification of GA impeded its self-assembly, resulting in the drug remaining in a free state. Both GA-AS NPs and GA-S-S-AS NPs exhibited spherical nanostructures measuring <100 nm in size, facilitating drug accumulation at the tumor site via the EPR effect. The GA-S-S-AS NPs group, in particular, presented a dual-layer configuration, possibly attributed to the localization of the aptamer on the outermost layer as a hydrophilic moiety, thus enhancing the efficacy of targeted cell delivery. At the same time, in order to observe the water dispersibility and colloidal properties of each group of nanodrug, the particle size, dispersibility and potential of each group in the water phase were tested (Figs. 1C and D). The particle sizes of GA NPs, GA-AS NPs and GA-S-S-AS NPs were 528, 90, and 97 nm, respectively, and the polydispersity index (PDI) were 0.12, 0.078, and 0.084. The slightly larger particle size of GA-S-S-AS NPs compared to GA-AS NPs may be attributed to the presence of disulfide bonds. The zeta potential analysis revealed that GA NPs exhibited a positive charge, whereas GA-AS NPs and GA-S-S-AS NPs displayed a negative charge due to the presence of the negatively charged phosphate group in the aptamer. This characteristic is expected to enhance the circulation time of nanodrugs in the bloodstream. The reason for the positive charge of GA NPs may be that it contains a carboxyl group (-COOH) and a hydroxyl group (-OH) in the molecular structure, and when GA is in aqueous solution, the COOH will dissociate and release a hydrogen ion (H+), thus making the molecule positively charged. Additionally, the release of positively charged free drugs at the tumor site is anticipated to facilitate tumor cell endocytosis. These findings collectively support the successful conjugation of GA to the aptamer, enabling the development of nanodrug formulations with high GA loading capacities.
The physiological stability of GA-S-S-AS NPs is a crucial consideration for their efficacy as a novel drug delivery system. Results from a 9-day storage study indicated that the size and PDI of GA-S-S-AS NPs remained relatively unchanged. Notably, in phosphate buffered saline (PBS) with 10% fetal bovine serum (FBS), the particle size of GA-S-S-AS NPs exhibited a slight increase from 100 nm to ~120 nm compared to distilled water or PBS, while the PDI remained stable (Figs. S3A and B in Supporting information). Furthermore, to ensure real-time monitoring of nanodrugs post-administration, the fluorescence stability of Cy5 within the nanodrugs was assessed at various intervals. Over time, the fluorescence intensity of the nanodrugs consistently exceeded 3000, demonstrating the sustained fluorescence stability of GA-S-S-AS NPs over an extended period (Fig. S3C in Supporting information). The presence of a highly reducing environment at the tumor site is a widely recognized phenomenon. Consequently, our investigation delved deeper into the release of GA from GA-S-S-AS NPs in varying levels of glutathione (GSH) environments (Fig. S3D in Supporting information). Specifically, we simulated the physiological conditions of blood and normal tissue using PBS supplemented with 5 µmol/L GSH, and the reducing tumor environment with PBS containing 5 mmol/L GSH. Under GSH-free normal conditions, the cumulative release rate of GA-S-S-AS NPs over a 24-h period was found to be 15%. Conversely, in the presence of 5 µmol/L GSH, the cumulative release rate over the same time period increased to 45%. This observed increase in drug release may be attributed to the low concentration of GSH causing the disruption of disulfide bonds within small part of the nanodrugs, thereby facilitating drug release. Significantly, the highest release rate of GA was observed in the 5 mmol/L GSH environment, reaching 84% within a 24-h period. Concurrently, the majority of disulfide bonds within the nanodrugs were found to have been cleaved. These findings suggest that GA-S-S-AS NPs exhibit the capability to retain stability in normal environments, facilitate drug release in highly reducing tumor environments, and display a heightened sensitivity to reducing conditions. In addition to this, the results of molecular simulation calculations indicate the presence of π-π stacking interactions and intramolecular hydrogen bonds between GA and aptamer AS1411, with a binding force of −12.85 kcal/mol (Fig. S4 in Supporting information). The molecular docking model further confirms the stable formation of the nanodrugs.
The AS1411 aptamer incorporated into GA-S-S-AS NPs demonstrates a pronounced binding affinity for nucleolins that are overexpressed on the surface of HepG2 cells, thus facilitating the internalization of nanodrugs by tumor cells through a ligand-receptor interaction mechanism. To assess the enhanced cellular uptake mediated by GA-S-S-AS NPs, we employed the intense fluorescence of Cy5 within the nanodrugs for both cell imaging and flow cytometry analysis. The uptake kinetics of GA-S-S-AS NPs by HepG2 and L-O2 cells at various time points were evaluated using an automated cell imaging system. As depicted in Fig. S5 (Supporting information), the fluorescence intensity of Cy5 exhibited a gradual increase over time in both HepG2 and L-O2 cells, with a notably higher intensity observed in HepG2 cells compared to L-O2 cells (Fig. S5A). Remarkably, significant red fluorescence was detected in HepG2 cells after 2 h. Quantitative analysis further confirmed the enhanced uptake capacity of GA-S-S-AS NPs in HepG2 cells relative to L-O2 cells (Fig. S5B). Additionally, flow cytometry was utilized to quantify the fluorescence signal of GA-S-S-AS NPs in HepG2 cells, yielding results consistent with those obtained through cell imaging (Fig. S5C). Finally, the intracellular localization of GA-S-S-AS NPs within HepG2 cells was examined using confocal laser scanning microscopy (CLSM). Following a 4-h incubation period, the red fluorescence emitted by Cy5 within the GA-S-S-AS NPs was observed to have escaped the lysosomal compartment, predominantly localizing within the cytoplasm (Fig. S5D). These findings substantiate the efficient internalization of GA-S-S-AS NPs by HepG2 cells, attributable to the specific binding of aptamers to receptors on tumor cells, thereby enhancing the intracellular delivery of the therapeutic agent. Concurrently, the fluorescence imaging capability of GA-S-S-AS NPs offers a valuable tool for real-time monitoring of the drug delivery process.
In order to assess the in vitro anti-tumor efficacy of various treatment groups, the cytotoxicity of GA, GA NPs, GA-S-S-NH2, GA-AS NPs, and GA-S-S-AS NPs on both HepG2 and L-O2 cells was initially determined through MTT assay. The results depicted in Fig. 2A, following a 24-h incubation period, each treatment group exhibited a dose-dependent cytotoxic effect on HepG2 cells, wherein cell viability decreased with escalating drug concentrations. Meanwhile, some interesting findings were also obtained. Specifically, the GA-S-S-NH2 and GA-S-S-AS NPs groups exhibited enhanced cell cytotoxicity, whereas the GA NPs groups displayed diminished cytotoxicity compared to the GA group. This discrepancy may be attributed to two factors: the excessive size of GA NPs post self-assembly, hindering cellular uptake, and the potential concealment of the pharmacophore following GA self-assembly, thereby impacting the drug's anti-tumor efficacy. The cytotoxicity of the GA-AS NPs group exhibited a slight superiority over that of the GA NPs group, potentially attributed to the small size of the GA-AS NPs enabling specific binding to the overexpressed nucleolin on HepG2 cell surfaces, thereby facilitating cellular internalization. The reduced toxicity of the GA-AS NPs group compared to the GA-S-S-NH2 and GA-S-S-AS NPs groups may be attributed to the stable polymerization state of GA on the GA-AS NPs, preventing the release of free GA. It is noteworthy that the GA-S-S-AS NPs group demonstrates the most pronounced cytotoxicity, attributed to its dual mechanism of actively targeting tumor cells and facilitating environment-responsive drug release. These findings suggest that the free form of GA exhibits greater efficacy in inducing tumor cell death compared to polymerized GA. In L-O2 cells, each treatment group also exhibited dose-dependent cytotoxicity (Fig. 2B). The cytotoxic effects of GA and GA-S-S-NH2 were found to be more pronounced compared to GA NPs, GA-AS NPs, and GA-S-S-AS NPs. This difference in cytotoxicity can be attributed to the small molecular size of GA and GA-S-S-NH2, facilitating their penetration into cells to exert pharmacological effects without discrimination between tumor cells and normal cells. Finally, the GA-AS NPs and GA-S-S-AS NPs exhibit reduced toxicity towards L-O2 cells even at elevated concentrations. This can be attributed to the absence of nucleolin overexpression and high concentration of GSH in normal hepatocytes, which hinders the cellular uptake and release of free drugs by the nanodrugs. These findings suggest that the self-assembled GA NPs diminish the efficacy of the drug, whereas the GA-S-S-AS NPs demonstrate a synergistic and mitigated effect. The aforementioned findings suggest that the self-assembly of GA NPs as a pure drug may diminish its cytotoxicity, whereas the GA-S-S-AS NPs exhibit an augmented therapeutic effect with decreased toxicity towards normal cells.
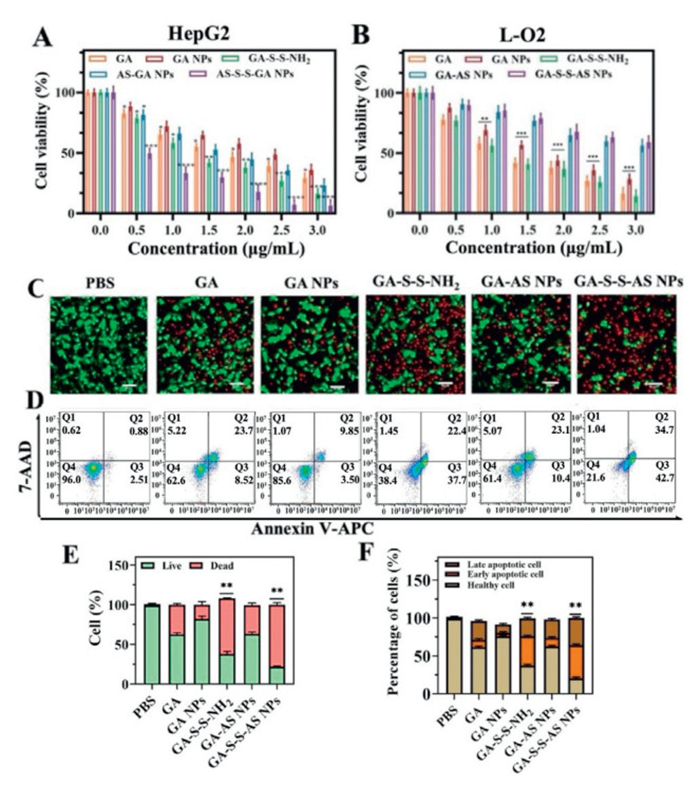
Subsequently, the in vitro antitumor effectiveness of each treatment group against HepG2 cells was assessed through live/dead cell staining and apoptosis assays. Initially, the viability of cells treated with various groups was observed using calcein AM and propidium iodide (PI) staining to distinguish between living (green) and dead (red) cells, allowing for a visual assessment of the anti-tumor efficacy. Figs. 2C and E demonstrate that GA-S-S-AS NPs resulted in the highest rate of cell death among the tumor cells, surpassing the effectiveness of free GA and other nanodrugs. Concurrently, Annexin V-allophycocyanin (APC)/7-aminoactinomycin D (7-AAD) staining and flow cytometry were employed to quantify the rates of apoptotic HepG2 cells. The results depicted in Figs. 2D and F revealed a reduction in apoptotic cells following treatment with GA NPs in comparison to the GA group, suggesting that GA NPs formed through GA self-assembly led to diminished drug efficacy and a weaker inhibition of tumor growth. Significantly, the GA-S-S-AS NPs exhibited the highest capacity for inducing apoptosis, indicating that the targeted GA-S-S-AS NPs possess enhanced cytotoxicity and superior inhibition of tumor growth. The findings were in line with the results of the cytotoxicity assay conducted in each experimental group. Overall, the study underscores the potential of GA-S-S-AS NPs to enhance the anti-tumor efficacy of GA, thereby improving its utility in cancer treatment.
HSP90, a class of highly conserved proteins, is intimately associated with the biological behavior of tumors and has emerged as a novel target for anticancer therapeutics. GA is recognized as a natural inhibitor of HSP90, capable of inducing apoptosis in tumor cells via the HSP90-regulated pathway, thereby exerting an anti-tumor effect [46]. To further explore the potential role of GA-S-S-AS NPs in augmenting the anti-tumor efficacy of drugs, a Western blot analysis was conducted to assess the expression levels of HSP90 in HepG2 cells subjected to various treatments (Figs. S6 and S7 in Supporting information). The findings initially indicated a 45% reduction in HSP90 expression in GA-treated cells compared to the control group, thereby confirming the inhibitory effect of GA on HSP90. Concurrently, the GA-S-S-AS NPs demonstrated the most pronounced inhibitory effect on HSP90 protein expression. The sequence of effects observed across all treatment groups on the inhibition of HSP90 was as follows: GA-S-S-AS NPs > GA-S-S-NH2 > GA-AS NPs > GA > GA NPs. This sequence aligns closely with the apoptosis results presented in Fig. 2, suggesting that each treatment group may exert anti-tumor effects through the apoptotic pathway mediated by HSP90. Notably, GA NPs exhibited minimal inhibitory impact on HSP90, further indicating that the self-assembly of hydrophobic GA is not favorable for the drug's efficacy.
We assessed the pharmacokinetics of GA-S-S-AS NPs after intravenous injection to show that the negatively charged NPs have better circulatory capabilities. The drug-time curve was drawn and the main drug dynamic parameters were calculated. The average blood concentration was taken as the Y axis and the blood collection time as the X axis. The concentrations of injected GA and GA-S-S-AS NPs in the plasma as a function of time is displayed in Fig. S8 (Supporting information). In the blood circulation, GA-S-S-AS NPs had an extended terminal elimination half-life in comparison to GA, as was predicted. Compared with GA group, the MRT was prolonged, AUC0-t was significantly increased, and bioavailability was higher in GA-S-S-AS NPs group. Also note that the blood clearance (CL) of the GA was much faster than that of GA-S-S-AS NPs. Consequently, compared to GA with a short half-life, the GA-S-S-AS NPs showed a prolonged circulation in the blood circulation, indicating a less frequent dosage schedule.
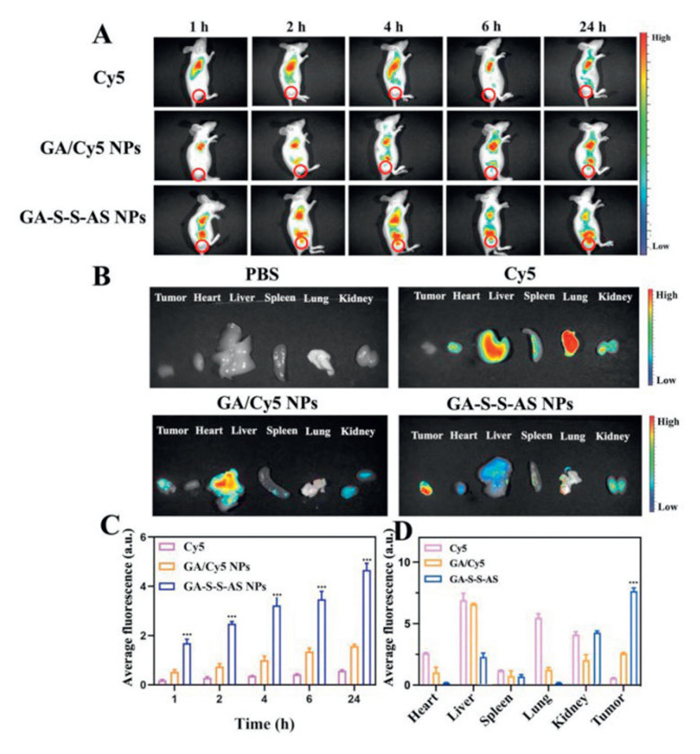
To investigate the distribution of nanodrugs, imaging studies were conducted using a HepG2 tumor-bearing BALB/c nude mouse model. The Institutional Animal Care and Use Committee of Tianjin University of Traditional Chinese Medicine approved all animal studies. The fluorescence imaging properties of Cy5 were harnessed for visualization in vivo, leading to the preparation of GA/Cy5 NPs physically loaded with Cy5 dye for comparative imaging analysis across various treatment groups. The in vivo fluorescence images of Cy5, GA/Cy5 NPs, and GA-S-S-AS NPs were captured within 24 h post-injection, as depicted in Figs. 3A and C. Over time, the fluorescence intensity at the tumor site exhibited a gradual increase in the GA/Cy5 NPs and GA-S-S-AS NPs groups, whereas the fluorescence in the Cy5 group remained relatively stable. Notably, the fluorescence intensity of GA-S-S-AS NPs at the tumor site surpassed that of Cy5 and GA/Cy5 NPs at 2 h post-injection and persisted up to 24 h. Subsequently, BALB/c nude mice were euthanized, and samples of tumor tissues as well as major organs including the heart, liver, spleen, lung, and kidney were harvested for analysis (Figs. 3B and D). The distribution of GA-S-S-AS NPs was predominantly observed in the isolated liver and tumor tissues, with a minor presence in the kidney. Conversely, GA/Cy5 NPs exhibited a primary distribution in the isolated liver and kidney, with lower levels detected in tumor tissues. The fluorescence marker Cy5 demonstrated widespread distribution throughout various organ regions, suggesting non-specific targeting. These distribution patterns are consistent with in vivo imaging results. Overall, GA-S-S-AS NPs demonstrated the highest tumor aggregation, potentially attributed to the combined effects of passive EPR targeting and active ligand-receptor recognition. These findings suggest that GA-S-S-NPs can enhance the accumulation of GA at the tumor site, leading to improved efficacy.
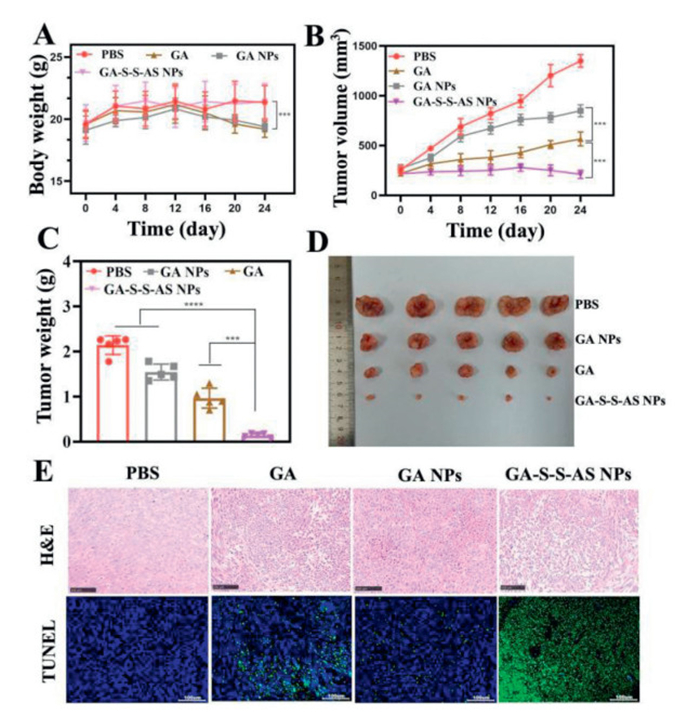
Because of the notable cytotoxicity demonstrated by GA-S-S-AS NPs in vitro, we proceeded to investigate their anti-tumor efficacy in vivo. Upon reaching a tumor volume of approximately 250 mm3, mice bearing tumors were randomly divided into four treatment groups and administered PBS (control), GA, GA NPs, and GA-S-S-AS NPs every 3 days for a duration of 24 days. Fig. 4A illustrates the weight change trajectory of mice across four distinct treatment groups spanning a 24-day duration. The findings indicate that the body weight of mice in the GA and GA NPs groups remained relatively constant initially, but exhibited a notable decrease after 12 days, suggesting potential systemic toxicity of the drugs. Conversely, mice in the GA-S-S-AS NPs group did not experience any weight fluctuation, potentially attributed to the heightened targeting efficacy of the aptamer and the activating response of the disulfide bond, thereby mitigating the systemic toxicity of the drug. The tumor growth rate was found to be significantly lower in all treatment groups compared to the control group treated with normal PBS (Fig. 4B). Specifically, the tumor growth rate in the GA-S-S-AS NPs group was significantly reduced compared to the GA group, while the GA NPs group showed a significant increase in tumor growth rate. These findings provide additional evidence supporting the reduced therapeutic efficacy of GA self-assembled GA NPs, with the GA-S-S-AS NPs group demonstrating superior antitumor properties and a potential for tumor elimination. Figs. 4C and D similarly demonstrated that the GA-S-S-AS NPs group exhibited the smallest tumors. Hematoxylin and eosin (H&E) and TdT-mediated dUTP nick-end Labeling (TUNEL) staining of the excised tumors were employed to further corroborate their antitumor efficacy. The results are depicted in Fig. 4E, wherein H&E staining revealed dense tumor cells in the PBS group with no discernible damage, whereas tumor cells in each treatment group exhibited varying degrees of reduction, indicative of nuclear and cytoplasmic degradation. It is noteworthy that the tumor tissue structure in the GA-S-S-AS NPs group exhibited abnormalities when compared to other groups, characterized by fusiform tumor cells with oval nuclei and prominent nucleoli. Additionally, a majority of tumor cells showed signs of degeneration and necrosis, along with inflammatory cell infiltration in the tissue. Furthermore, the GA-S-S-AS NPs group displayed the highest percentage of apoptotic TUNEL-positive cells. In summary, the findings align with the aforementioned tumor volume and weight data, demonstrating the superior antitumor efficacy of GA-S-S-AS NPs. This pronounced therapeutic effect may be attributed to the targeted delivery of GA-S-S-AS NPs to the tumor site and the subsequent release of free drugs within the tumor microenvironment. These results underscore the importance of strategic nanodrug design in enhancing antitumor efficacy, suggesting that not all pure drug self-assemblies will yield optimal therapeutic outcomes.
The primary challenge in implementing drug therapy in vivo is the presence of toxic side effects, underscoring the importance of monitoring the systemic toxicity of drugs [31]. To assess the biosafety of different treatment groups, the effects of PBS, GA, GA NPs, and GA-S-S-AS NPs on H&E staining and serum biochemical analysis of the heart, liver, spleen, lung, and kidney of HepG2 tumor-bearing mice were investigated. H&E staining revealed no pathological alterations in the organs of the GA-S-S-AS NPs group, suggesting the absence of significant toxicity associated with GA-S-S-AS NPs (Fig. S9 in Supporting information). The hepatic tissue structure of mice in the GA and GA NPs groups exhibited abnormalities, characterized by hepatocytes arranged radially around the central vein, hepatocytes displaying balloon-like changes, central vein congestion, and inflammatory cell infiltration (indicated by the black arrow). Additionally, elevated levels of serum enzymes (aspartate aminotransferase (AST), aminotransferase (ALT)) in the liver and (blood urea nitrogen (BUN), creatinine (CRE)) in the kidney in the GA and GA NPs groups indicated an increase in AST and ALT, suggesting hepatotoxicity (Fig. S10 in Supporting information). On the contrary, GA-S-S-AS NPs exhibited no aberrant alterations in the aforementioned serum biochemical parameters, attributed to the active targeting capability of aptamers that facilitated enhanced accumulation within the tumor site and mitigated systemic toxicity of the drug. Consequently, this mechanism contributed to the potentiation of therapeutic efficacy and reduction of toxicity. Collectively, the capacity of GA-S-S-AS NPs to alleviate GA-induced toxicity underscores the significance of nanomedicine in targeted cancer treatment.
In conclusion, we have developed a simple approach to create carrier-free nanodrugs with multiple functions, including active targeting, responsiveness to environmental stimuli, and fluorescence imaging capabilities. These nanodrugs, designated as GA-S-S-AS NPs, are designed to address the diminished efficacy of hydrophobic GA in aqueous environments. Notably, the nanodrugs display exceptional stability in physiological conditions. The EPR effect combined with ligand-receptor active recognition, facilitate the accumulation and internalization of nanodrugs at the tumor site. Upon internalization by tumor cells, elevated intracellular glutathione levels induce the degradation of nanodrugs, leading to the rapid release of free drugs for cell destruction. Consequently, treatment with GA-S-S-AS NPs demonstrated enhanced therapeutic efficacy both in vitro and in vivo, resulting in significant inhibition of tumor growth. Simultaneously, the utilization of Cy5 fluorescence enables the nanodrugs to exhibit effective imaging capabilities both in vivo and in vitro. Moreover, in vivo distribution tracking has demonstrated a notable enhancement in drug accumulation at the tumor site facilitated by the nanodrugs. As anticipated, the nanodrugs exhibit superior biosafety compared to free GA, effectively mitigating GA-induced hepatotoxicity. Besides, initial mechanistic investigations indicated that the nanodrugs exhibited a greater propensity for inhibiting the expression of the HSP90 protein. Collectively, these findings underscore the considerable potential and advantages of the carrier-free nanodrugs, positioning them as a promising delivery system for GA in cancer therapy. This straightforward carrier-free nanodrug approach offers novel dosage formulations to improve the therapeutic efficacy of hydrophobic antitumor drugs, thereby broadening the scope of their utilization.
The authors declare that they have no known competing financial interests or personal relationships that could have appeared to influence the work reported in this paper.
Zerong Pei: Writing – original draft, Visualization, Methodology, Investigation, Data curation, Conceptualization. Suyun Hu: Data curation. Huimin Wei: Data curation. Liqin Ding: Conceptualization. Jingbo Liu: Data curation. Fengyun Li: Writing – review & editing, Supervision, Project administration, Funding acquisition, Data curation. Hongyu Chen: Funding acquisition.
The financial support for this research was provided by the National Natural Science Foundation of China (Nos. 21907076 and 31901908) and the Natural Science Foundation of Tianjin (No. 22JCQNJC01570).
Supplementary material associated with this article can be found, in the online version, at doi:
R.L. Siegel, K.D. Miller, N.S. Wagle, et al., CA Cancer J. Clin. 73 (2023) 17–48. doi: 10.3322/caac.21763
C. Holohan, S. Van Schaeybroeck, D.B. Longley, et al., Nat. Rev. Cancer 13 (2013) 714–726. doi: 10.1038/nrc3599
S. Liang, X. Deng, P. Ma, et al., Adv. Mater. 32 (2020) 2003214.
K. Yamana, J. Inoue, R. Yoshida, et al., Extracell 10 (2021) e12169.
L. Huang, S. Zhao, F. Fang, et al., Biomaterials 268 (2021) 120557.
M.J. Mitchell, M.M. Billingsley, R.M. Haley, et al., Nat. Rev. Drug Discov. 20 (2021) 101–124. doi: 10.1038/s41573-020-0090-8
M. Mohkam, M. Sadraeian, A. Lauto, et al., Microsyst. Nanoeng. 9 (2023) 145.
D. Wang, X. Wu, Y. Sun, Signal Transduct. Target. Ther. 7 (2022) 331.
W. Wang, H. Zhou, Y. Wang, et al., Pharmacol. Res. 163 (2020) 105187.
E. Hatami, M. Jaggi, S.C. Chauhan, et al., BBA Rev. Cancer 1874 (2020) 188381.
B. Li, S. Liu, B. Zhao, et al., Phytomed. Plus 3 (2023) 100456.
M.J. Seo, D.M. Lee, I.Y. Kim, et al., Cell Death Dis. 10 (2019) 187.
H. Zhao, L. Wu, G. Yan, et al., Signal Transduct. Target. Ther. 6 (2021) 263.
K. Banik, C. Harsha, D. Bordoloi, et al., Cancer Lett. 416 (2018) 75–86.
S. Lyu, X. Zhang, Z. Tu, et al., Pharmacol. Res. 182 (2022) 106279.
Y. Liu, Y. Chen, L. Lin, et al., Int. J. Nanomed. 15 (2020) 10385–10399. doi: 10.2147/ijn.s277645
S. Feng, R. Yan, C. Tang, et al., Chem. Eng. J. 496 (2024) 153655.
R.R. Sahu, A.S. Ramasamy, S. Bhonsle, et al., Nat. Nanotechnol. 19 (2024) 766–774. doi: 10.1038/s41565-024-01625-1
R. Liu, C. Luo, Z. Pang, et al., Chin. Chem. Lett. 34 (2023) 107518.
Z. Pei, S. Chen, L. Ding, et al., J. Control. Release 352 (2022) 211–241.
Y. Wang, C. Zhang, S. Han, et al., Chin. Chem. Lett. 35 (2024) 109578.
T. Tong, L. Chen, S. Wu, et al., Chin. Chem. Lett. 35 (2024) 109689.
S. Yu, R. Zhang, Z. Xie, et al., ACS Biomater. Sci. 10 (2024) 4336–4346. doi: 10.1021/acsbiomaterials.4c00345
W. Zhang, X. Deng, L. Wang, et al., Chin. Chem. Lett. 35 (2024) 109422.
Y. Wang, C. Yue, M. Zhang, et al., Chem. Eng. J. 452 (2023) 139108.
R. Liu, L. He, M. Liu, et al., Chin. Chem. Lett. 34 (2023) 107575.
F. Li, Z. Pei, S. Chen, et al., Chin. Chem. Lett. 35 (2023) 108752.
Y. Zhao, F. Fay, S.L.B. Hak, et al., Nat. Commun. 7 (2016) 11221.
S.S. Cai, T. Li, T. Akinade, et al., Adv. Drug Deliv. Rev. 176 (2021) 113884.
S. Senapati, A.K. Mahanta, S. Kumar, et al., Signal Transduct. Target. Ther. 3 (2018) 7.
A. Sultana, M. Zare, V. Thomas, et al., Med. Drug Discov. 15 (2022) 100134.
L. Chen, W. Hong, W. Ren, et al., Signal Transduct. Target. Ther. 6 (2021) 225.
J. Liu, X. You, L. Wang, et al., Small 20 (2024) 2401438.
Q. Qian, D. Wang, L. Shi, et al., Biomaterials 265 (2021) 120403.
S. Fu, G. Li, W. Zang, et al., Acta Pharm. Sin. B 12 (2021) 92–106.
S. Zhu, H. Gao, W. Li, et al., Adv. Healthc. Mater. 14 (2024) 2401020.
M.Y. Yang, R.R. Zhao, Y.F. Fang, et al., Int. J. Pharm. 570 (2019) 118663.
S. Karaosmanoglu, M. Zhou, B. Shi, et al., J. Control. Release 329 (2021) 805–832.
L. Zhu, J. Yuhan, H. Yu, et al., J. Nanobiotechnol. 21 (2023) 182. doi: 10.56434/j.arch.esp.urol.20237603.21
X. Zhang, C. Wang, J. Wu, et al., J. Control. Release 262 (2017) 305–316. doi: 10.1007/978-3-319-28320-3_32
Y. Zhao, Y. Zhao, Q. Ma, et al., Int. J. Nanomed. 14 (2019) 8665–8683. doi: 10.2147/ijn.s224704
M.R. Nelson, T. Johnson, L. Warren, et al., Nat. Rev. Genet. 17 (2016) 197–206. doi: 10.1038/nrg.2016.12
L. Kelly, K.E. Maier, A. Yan, et al., Nat. Commun. 12 (2021) 6275.
X. Xiao, H. Li, L. Zhao, et al., Biomed. Pharmacother. 143 (2021) 112232.
K.S. Park, H. Cha, J. Niu, et al., Nucl. Acids Res. 25 (2024) 532. doi: 10.3390/jpm14050532
J. Davenport, J.R. Manjarrez, L. Peterson, et al., J. Nat. Prod. 74 (2011) 1085–1092. doi: 10.1021/np200029q

Scheme 1 Schematic overview of the preparation and in vitro and in vivo applications of the nanodrugs, designated as GA-S-S-AS-NPs.

Figure 1 (A) Preparation process of GA-S-S-AS NPs. (B) SEM and TEM images of GA NPs, GA-S-S-NH2, GA-AS NPs, and GA-S-S-AS NPs. (C) Particle sizes of GA NPs, GA-AS NPs and GA-S-S-AS NPs. (D) Zeta potentials of GA NPs, GA-S-S-NH2, GA-AS NPs and GA-S-S-AS NPs. Data are presented as mean ± standard deviation (SD) (n = 3).

Figure 2 Cytotoxicity of HepG2 cells (A) and L-O2 cells (B) exposed to different concentrations of treatment groups (GA dose was 0, 0.5, 1, 1.5, 2, 3 µg/mL) for 24 h. (C) Staining analysis images of live/dead cells in different treatment groups (scale bar: 100 µm). (D) Apoptosis of HepG2 cells induced by different treatment groups analyzed by flow cytometer. (E) Quantitative staining results of live/dead cells in different treatment groups. (F) Percentage of apoptotic cells including early and late-stage apoptotic cells in different groups. Values represented were means ± SD (n = 5). P < 0.05, **P < 0.01, ***P < 0.001.

Figure 3 (A) Fluorescence pictures of HepG2 tumor-bearing mice taken at various intervals following intravenous injections of GA/Cy5 NPs, GA-S-S-AS NPs, and Cy5. (B) Fluorescence pictures captured in vitro 24 h after injection of main organs and tumors that were removed. (C) Quantitative evaluation of the average Cy5 fluorescence intensity in tumors at various in vivo time intervals. (D) Twenty-four hours after injection, the average fluorescence intensity of the tumors and organs visible in ex vivo imaging. Values represented were means ± SD (n = 4). ***P < 0.001.

Figure 4 (A) Changes in body weight of mice in different treatment groups. (B) Tumor growth curves of mice treated with different groups (4 mg/kg GA). The therapeutic terminal's tumor weight (C) and photo of the tumors removed from the mice (D). (E) TUNEL and H&E staining of the tumor tissues that were extracted from various groups. Scale bar: 100 µm. The data is shown as mean ± SD (n = 6). ***P < 0.001, ****P < 0.0001.

 扫一扫看文章

扫一扫关注我们
 DownLoad:
 下载:
下载:
 下载:
下载: