Scheme 1.
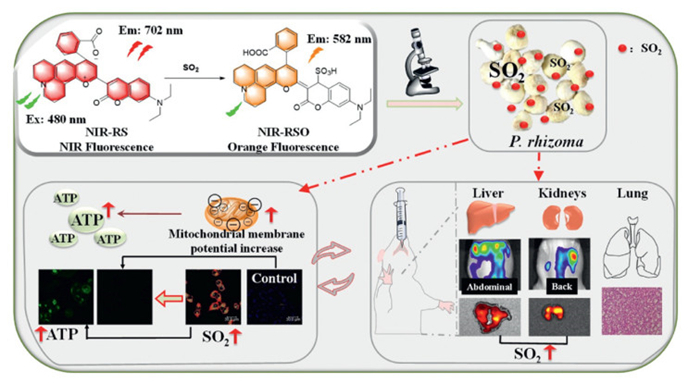
The sensing mechanism of the probe NIR-RS to detect SO2 and the simple diagram of NIR-RS imaging SO2 in cell and in vivo.
A NIR and ratiometric fluorescent probe for quantitative detection of SO2 derivatives in Chinese medicinal materials and bioimaging in vivo
Meitong Wu , Ke Wu , Shumin Feng , Li Xu , Mi Lei , Jianmei Chen , Shuang Li , Mian Qin , Dahui Liu , Guoqiang Feng

Sulfur dioxide (SO2) is both a main atmospheric pollutant and a valuable commercial reagent, it is often produced through the combustion of sulfur-containing raw materials and fuels [1]. It can dissolve in water and form a pH-dependent equilibrium between sulfite (SO32−) and bisulfite (HSO3−) with a 1:3 molar ratio [2,3]. In the industry, sulfur processing (including sulfur fumigation, pyrosulfite soaking, etc.) is widely used to protect food, beverages, and Chinese medicinal materials from spoilage due to its antioxidant and enzyme inhibition properties [4–6]. For instance, Pinelliae rhizoma (P. rhizoma) is usually processed with fumigation or sodium pyrosulfite to ensure long-term storage and maintain good color [7,8]. However, a large amount of SO2 usually remains in P. rhizoma after treatment, which will reduce the medicinal ingredients of P. rhizoma [9], and the toxicological studies unveil that SO2 is associated with lung cancer, cardiovascular diseases [10], and neurological diseases [11] may involve the formation of sulfur-and oxygen-centered free radicals that disturb the molecular mechanism of mitochondrial and affect cell physiological activity [12]. Hence, the residual of SO2 in Chinese medicinal materials is strictly controlled, and the amount of SO2 should be <150 mg/kg according to Pharmacopoeia of People's Republic of China [13]. Hence, developing a fast and efficient way for monitoring SO2 residue in real Chinese herbal medicine is imperative.
Several methods for detecting SO2 have been reported, including acid-base titration [14], gas chromatography [15], ion chromatography [16], and fluorescence analysis [17]. Among these methods, fluorescence analysis stands out for its simple operation, and high sensitivity [18], especially the ratiometric and near-infrared (NIR) fluorescence, which has a lot of advantages: high accuracy, low autofluorescence interference, deep tissue penetration [19,20], rendering it ideal for quantitative detecting SO2 residues in Chinese herbal medicine, and tracking effect of the SO2 residues in vivo [21].
Herein, a mitochondrial-targeted fluorescent probe (NIR-RS in Scheme 1), that can be used for colorimetric and ratiometric detecting SO2 in P. rhizoma and in vivo was developed. The coumarin-semirhodamine hybrid structure of probe NIR-RS, features near-infrared fluorescence, excellent water solubility, and high quantum yield [22,23]. Upon addition of SO2, probe NIR-RS displays a distinct colorimetric and ratiometric fluorescence change in the far-red and NIR region (λem = 582 and 702 nm), and exhibited high sensitivity (Limit of detection (LOD) = 50 nmol/L), excellent selectivity. Importantly, probe NIR-RS can accurately detect SO2 content in P. rhizoma samples, the recovery rates from 98.46% to 102.40%, with relative standard deviations (RSDs) < 5.0%. Moreover, NIR-RS was successfully used to image both endogenous and exogenous SO2 in mitochondria. Using NIR-RS and Rho-ATP (a probe for detecting adenosine triphosphate (ATP)) [24] for optical imaging, we found that high SO2 residue in P. rhizoma increased ATP levels in mitochondria. This is the first fluorescent probe to evaluate the link between the high SO2 residue of P. rhizoma and ATP expression in cells. Additionally, when mice were orally administered P. rhizoma with high SO2 residue, SO2 mainly accumulates in the liver, and can also cause pulmonary fibrosis and gastric mucosal damage. In summary, we developed a standardized tool for measuring SO2 residue in P. rhizoma and provided a new method for studying the metabolic effects of high SO2 residue in vivo.
First, compounds 1 and 2 were prepared by a literature method [25,26], and the synthesis of probe NIR-RS is outlined in Scheme S2 (Supporting information). Compounds 1 and 2 in methylsulfonic acid at 120 ℃ to afford NIR-RS in 23% yield. The structure of NIR-RS was confirmed by nuclear magnetic resonance (NMR) and mass spectroscopy (Figs. S1–S4 in Supporting information).
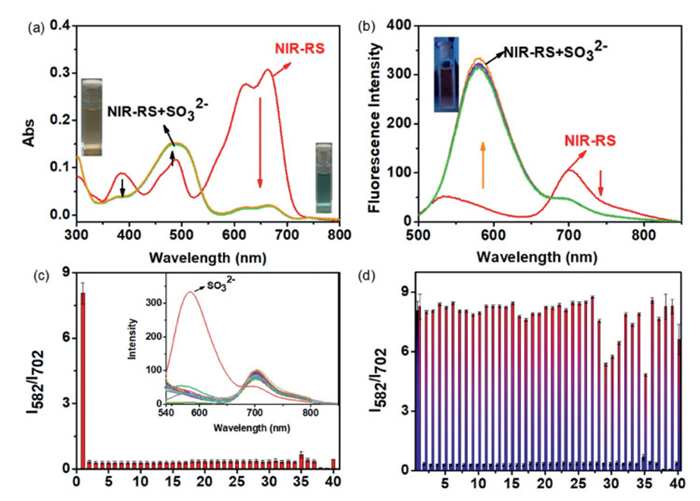
Next, the performance of NIR-RS for detecting SO2 was studied in phosphate buffered solution (PBS) (10 mmol/L, pH 7.4, 30% dimethylformamide (DMF), v/v) by measuring the absorption and fluorescence changes. As expected, NIR-RS has large conjugated structures and shows an absorption maxima at 660 nm and a fluorescence peak at 702 nm in the test solution (Fig. 1). However, the maximum absorption peak of NIR-RS at 660 nm was decreased abruptly when 200 µmol/L HSO3− was added, and the absorption peak at 480 nm emerged, together with an obvious color change from green to pale pink (Fig. 1a). This indicates that NIR-RS can be used as a colorimetric probe for HSO3−. Meanwhile, after HSO3− was added, the fluorescence of NIR-RS decreased significantly at 702 nm and concurrently increased at 582 nm (Fig. 1b), the results indicate that NIR-RS is a good ratiometric fluorescent probe for SO32−. We also monitored the fluorescence intensity changes of NIR-RS (10 µmol/L) at 582 and 702 nm after adding HSO3−, HS−, glutathione (GSH), homocysteine (Hcy), and cysteine (Cys), respectively, and kinetics results showed a fast reaction rate (<1 min, Fig. S6 in Supporting information) upon add SO32−, and negligible changes were observed upon the addition of biothiol (HS−, GSH, Hcy and Cys). Then, we investigated the response of NIR-RS to various biologically relevant analytes, including Cl−, I−, HCO3−, OCN−, AcO−, C2O42−, S2O72−, HSO4−, F−, Br−, SCN−, NO2−, S2O32−, Ser, Glu, Lys, Arg, Gly, Phe, His, Ala, Met, Ile, Gln, Thr, Ca2+, Zn2+, Al3+, Fe3+, Cu2+, Mg2+), S8, Na2S2, CH3SSSCH3. It was found only HSO3− can cause a significant fluorescence change, this indicates that NIR-RS is high selectivity for HSO3− over other analytes (Fig. 1c). Meanwhile, the competition experiments showed that all these biologically relevant analytes displayed almost no interference with HSO3− detection (Fig. 1d). What is more, NIR-RS exhibited excellent photostability under 365 nm light exposure for 120 min (Fig. S7 in Supporting information). These illustrated that NIR-RS displayed remarkable selectivity to HSO3− detection. Then, we sought to investigate the pH effect on the fluorescence behavior of NIR-RS in the detection of HSO3−, As shown in Fig. S8 (Supporting information), the ratio of fluorescence intensities of NIR-RS did not show significant changes, representing that this probe was stable in a wide range of pH. Notably, once HSO3− was added to the NIR-RS solution, the ratio of fluorescence intensities (I582/I702) was increased in the solution of NIR-RS with SO32− in the pH range of 6–11. This pH range for NIR-RS in the detection of HSO3− implied its potential application in environmental and biological studies.
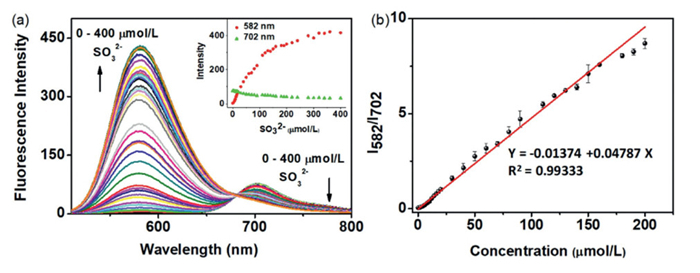
After confirming the high selectivity of NIR-RS for HSO3−, then the sensitivity of NIR-RS to SO32− was investigated. As shown in Fig. 2a, with increased concentrations of HSO3−, the fluorescence of NIR-RS decreased gradually at 702 nm while increasing obviously at 582 nm. The fluorescence intensities at 582 nm continued to rise and saturated after the addition of about 300 µmol/L of SO2 derivative. A linear relationship (R2 = 0.99333) was observed between the fluorescence intensity ratio (I582/I702) and HSO3− concentration over the range of 0–200 µmol/L (Fig. 2b). The detection limit was calculated to be 50 nmol/L, based on signal to noise ratio (S/N) = 3, indicating that NIR-RS can be effectively employed for quantitative detection of HSO3− over a broad linear range. These results suggest that NIR-RS has a high sensitivity to HSO3- and is suitable for detecting SO2 derivatives in Chinese herbal medicine samples.
To investigate the application properties of NIR-RS, we evaluated its effectiveness in determining SO2 content in P. rhizoma samples. First, P. rhizoma samples treated with different concentrations of sodium pyrosulfite were measured by NIR-RS. As shown in Table S1 (Supporting information), the probe successfully detected SO2 content in the samples, with a relative standard deviation RSD of <5%. Furthermore, the results obtained from this method closely aligned with those from the national standard titration method (Table S2 in Supporting information) [14]. T-test analysis revealed no statistically significant difference between the two methods (P > 0.05), and the recovery rates of NIR-RS detecting SO2 in P. rhizoma samples ranged from 98.46% to 102.40% (Table S3 in Supporting information). These results demonstrate that NIR-RS is suitable for accurately and precisely detecting SO₂ content in P. rhizoma samples. To our knowledge, few fluorescent probes are capable of detecting SO2 in Chinese herbal medicine samples, which is likely attributable to the ratiometric property of NIR-RS that enhances detection precision.
To understand the sensing mechanism of NIR-RS for HSO3−, considering the optical sign at 582 nm of NIR-RS for detecting HSO3− was increased, suggesting that NIR-RSO showed the fluorescence of semi-rhodamine while NIR-RS was taken addition with HSO3− at the site 4 of coumarin, and the conjugated skeleton of NIR-RS was interrupted and generated compound NIR-RSO. To prove this, HPLC-MS analysis was carried out, and a mass peak at m/z 561.2391 corresponded to the addition adduct of NIR-RS, in addition, the peak that appeared at m/z 641.1967 was attributed to compound NIR-RSO (Fig. S9 in Supporting information). Thus, based on the reports of several recently reported semirhodamine-based HSO3− probes [27–29], the sensing mechanism of probe NIR-RS for HSO3− was proposed as a process as shown in Scheme S2.
Before imaging, the MTT assays were used to evaluate the cytotoxicity of NIR-RS, as shown in Fig. S10 (Supporting information), NIR-RS exhibits no significant cytotoxicity. Mitochondria play essential roles in energy metabolism, and the SO2 derivate was linked with mitochondrial disturbances [30,31]. The cationic probe NIR-RS can easily bind to the mitochondrial membrane with a negative potential (−250 mV) [32], which may accumulate in mitochondria. Then, the colocalization imaging experiment was performed to evaluate the distribution of NIR-RS (Fig. S11 in Supporting information). When the NIR-RS and a commercialized Mito-Tracker Green (MTG) were co-incubated in cells the cytoplasm merged image showed the fluorescence distribution in green and red channels overlapped well, and the intensity profiles of the linear regions of interest (ROI) across the cells also displayed an excellent correlation. To further understand the distribution of the probe NIR-RS in the cells, other commercial dyes, including Hoechst 33342 (nucleus), LysoTracker Green (lysosomes), GolgiTracker Green (Golgi), ER-Tracker Green (endoplasmic reticulum) was also incubated with probe NIR-RS, as shown in Fig. S12 (Supporting information), we found that Pearson's co-localization was higher in mitochondria then other subcellular organelles. Additionally, the Pearson's co-localization and overlap coefficients in mitochondria were calculated to be 0.87 and 0.90, respectively. The above results indicated that NIR-RS possesses a mitochondria-targeting capability with low cytotoxicity, and has the potential ability to track and image SO2 in mitochondria.
Cell imaging experiments were carried out to study the imaging performance of the probe NIR-RS for detecting SO2. First, HeLa cells were incubated with NIR-RS for 30 min, and strong red fluorescence and weak green fluorescence were observed, indicating that NIR-RS has great cell membrane permeability (Fig. S13 in Supporting information). However, when the cells were incubated with different concentrations of exogenous SO2 (HSO3−), a remarkable increase in the green channel and a reduction in red fluorescence was observed (Figs. S13b and c). These results manifested that NIR-RS could effectively detect exogenous SO2. In addition, when cells were preincubated with Cys to produce endogenous SO2 [33], the fluorescence ratio of Igreen/Ired increased (Fig. S14 in Supporting information), and decreased in the presence of tetrahydrofolate (an endogenous formaldehyde (FA) reagent), this suggests that NIR-RS has the potential to detect endogenous SO2. Overall, these experiments show that NIR-RS is suitable for imaging both exogenously and endogenously SO2 in cells.
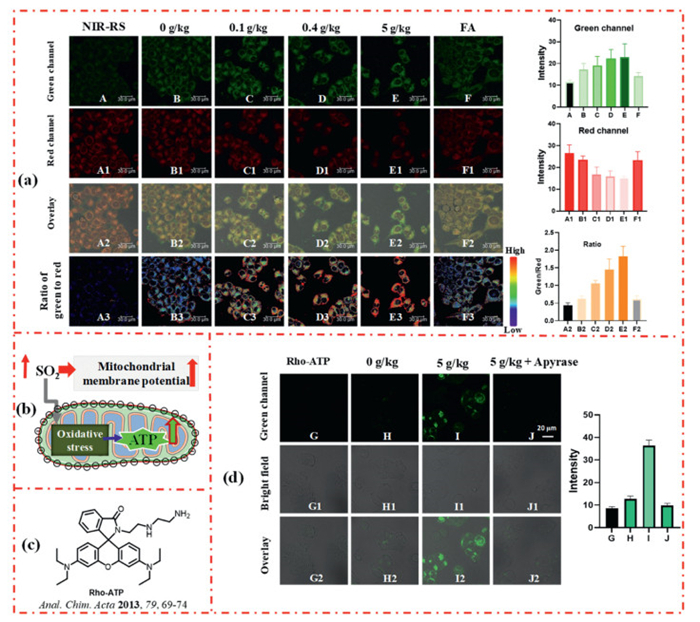
We further investigated the property of NIR-RS to image SO2 residual in P. rhizoma sample within cells. As shown in Fig. 3, when cells were incubated with P. rhizoma sample containing different concentrations of SO2, a dramatical increase in the green-to-red fluorescence ratio was observed, with a pronounced enhancement in the green channel and a decline in red channel fluorescence as SO2 levels increased (Fig. 3a). However, when FA was co-incubated with 5 g/kg P. rhizoma sample, the red fluorescence was restored, and the green/red fluorescence ratio was depressed. These results indicated that P. rhizoma fumigated with high sodium pyrosulfite content leads to elevated SO2 expression in cells. Elevated SO2 levels were found to increase the inner mitochondrial membrane potential (Fig. 3b), which is reported to reflect an energized mitochondrion with enhanced ATP production capacity [34]. Using Rho-ATP (Fig. 3c), we measured mitochondrial function by assessing ATP production (Fig. 3d). Cells incubated with 5 mg/kg P. rhizoma displayed an increase in green fluorescence, while cells treated with apyrase (a hydrolytic enzyme that can convert ATP into adenosine monophosphate (AMP) and inorganic phosphate) [35–37] showed weak green fluorescence. This indicates that SO2-induced mitochondrial ATP production surged, potentially disturbing intracellular energy metabolism and impairing normal cellular function. Then, HeLa cells were pre-incubated with different concentrations of SO2 residual from P. rhizoma samples. Cells incubated with P. rhizoma (1, 3, 5 g/kg) displayed an increase in green fluorescence compared to the blank group. The fluorescence intensity generally increased with higher SO2 concentrations and reached a peak at 3 g/kg (Fig. S15 in Supporting information). These findings reveal that P. rhizoma with excessive SO2 can affect the organism's growth mechanisms through alterations in ATP pathways. This provides a new direction for researchers to explore the physiological effects of P. rhizoma with excessive SO2 residues in vivo.
Encouraged by the outcomes of the cellular experiments, we scrutinized the potential of NIR-RS to image SO2 in vivo. Kunming mice were purchased from the Hubei Provincial Center for Disease Control and Prevention (Wuhan, China). All the animal experiment procedures were approved by the Animal Experiment Center of Hubei University of Chinese Medicine and followed the Guidelines for the Care and Use of Research Animals. As shown in Fig. S16 (Supporting information), when the mouse was intravenously injected with NIR-RS, a strong fluorescence signal at 710 nm was observed. Upon orthotopic injection of SO32−, the 710 nm signal rapidly diminished, accompanied by a significant fluorescence increase at 570 nm within 1 min, indicating that NIR-RS can rapidly track SO32− in vivo. Then, we further investigated the property of NIR-RS to image SO2 residual from P. rhizoma sample in vivo. As shown in Fig. S17 (Supporting information), the 0 g/kg P. rhizoma group showed a stronger sign in the red channel. As the sodium pyrosulfite content in P. rhizoma increased, the fluorescence in the red channel decreased, while the green channel signal intensified. The results indicated that the NIR-RS could effectively detect SO2 residues in P. rhizoma samples in vivo.
To investigate the actual effects of excessive sulfur dioxide in the P. rhizoma sample on organisms, Kunming mice were orally gavaged with 0.5 mL P. rhizoma sample (0, 0.4, 5 g/kg) for 8 consecutive days. Histological analysis indicated the mice treated with P. rhizoma sample (5 g/kg) exhibited signs of pulmonary fibrosis and gastric mucosal damage (Fig. S18 in Supporting information), while other tissues were minimally affected. In addition, tissue damage assessment experiments showed that the probe NIR-RS was relatively safe at (100 µmol/L, in 100 µL PBS buffer solution) doses (Fig. S19 in Supporting information). Notably, as shown in Figs. 4a–d, SO2 residues were detected in vivo. In the 0 and 0.4 g/kg groups, distinct fluorescent signals were observed in the liver and kidneys at the 710 nm channel. Compared to the other two groups, the 0.4 g/kg group displayed significantly stronger fluorescence intensity (Fig. 4f). This suggests that mice administered 0.4 g/kg P. rhizoma sample may have reduced liver metabolic efficiency, leading to the accumulation of NIR-RS in the liver. The ratiometric properties of the NIR-RS probe indicated that SO2 residue concentrations increased, and the SO2 levels in the liver and kidneys also rose (Figs. 4e and f), indicating that SO2 tends to accumulate in these organs. Additionally, the imaging confirmed the presence of excessive SO2 residues in liver and kidney tissues (Fig. S20 in Supporting information), providing insights into the metabolic pathways for P. rhizoma samples containing SO2 residues.

In summary, we designed a fluorescent probe NIR-RS for detecting SO2 residues in P. rhizoma samples and living systems. Probe NIR-RS exhibits high sensitivity (LOD = 50 nmol/L), selectivity, and a rapid response for SO2 detection. It was successfully used for quantitative analysis of SO2 residues, with recovery rates ranging from 98.46% to 102.40% and RSDs < 5.0%. In addition, NIR-RS has low cytotoxicity and good mitochondrial-targeting ability to image both mitochondrial exogenous and endogenous SO2. Importantly, we found that P. rhizoma with high SO2 residues increases ATP levels in mitochondria, Probe NIR-RS imaging in vivo demonstrated its excellent ability to monitor SO2 residue metabolism, and excessive intake of P. rhizoma containing high SO2 residue can cause pulmonary fibrosis and gastric mucosal damage. Overall, this study provides a powerful tool for regulating SO2 residue levels in P. rhizoma and offers new methods for tracking SO2 metabolism in vivo. It also opens new avenues for researching the pathological and physiological toxicity of SO2 residues in P. rhizoma.
The authors declare that they have no known competing financial interests or personal relationships that could have appeared to influence the work reported in this paper.
Meitong Wu: Writing – original draft, Methodology, Investigation, Data curation, Conceptualization. Ke Wu: Investigation, Formal analysis, Data curation, Conceptualization. Shumin Feng: Writing – review & editing, Writing – original draft, Supervision, Project administration, Conceptualization. Li Xu: Methodology, Investigation, Formal analysis, Data curation. Mi Lei: Methodology, Formal analysis, Data curation. Jianmei Chen: Methodology, Investigation. Shuang Li: Methodology, Investigation. Mian Qin: Methodology, Investigation. Dahui Liu: Writing – review & editing, Supervision, Project administration, Funding acquisition. Guoqiang Feng: Writing – review & editing, Supervision, Project administration.
This work was supported by the Natural Science Foundation of Hubei Province (Nos. 2023AFB376 and 2024AFD287), National Key Research and Development Program (No. 2023YFC3503804) and the National Natural Science Foundation of China (No. 22077044).
Supplementary material associated with this article can be found, in the online version, at doi:
J. Xu, H. Yuan, G. Bao, et al., Chin. Chem. Lett. 29 (2018) 1456–1464.
F. Li, L. Zou, X. Duan, et al., J. Photochem. Photobiol. A: Chem. 411 (2021) 113201.
Y. Yang, X. Yan, K. Zhong, et al., J. Hazard. Mater. 469 (2024) 134003.
X. Jiang, L. Huang, S. Chen, et al., Phytomedicine 20 (2013) 97–105.
J. Zhao, C. Zheng, W. Zhu, et al., Chem. Biol. Interact. 292 (2018) 84–93.
S. Zhou, J. Hu, S. Li, et al., J. Hazard. Mater. 364 (2019) 376–387.
X. Han, H. Zheng, F. Wang, et al., Spectrochim. Acta A: Mol. Biomol. Spectrosc. 317 (2024) 124463.
J. Bai, J. Qi, Y. Shi, et al., J. Ethnopharmacol. 298 (2022) 115650.
Z. Zhan, A. Deng, L. Huang, et al., J. Pharm. Biomed. Anal. 156 (2018) 340–348.
L. Zhang, L. Zhang, L. Chen, et al., TrAC Trends Anal. Chem. 169 (2023) 117377.
L. Zou, J. Xu, X. Duan, et al., Microchem. J. 153 (2020) 104461.
N. Sang, Y. Yun, G. Li, et al., Toxicol. Sci. 114 (2010) 226–236. doi: 10.1093/toxsci/kfq010
Chinese Pharmacopoeia Commission, Pharmacopoeia of the People’s Republic of China (Volume 4: Other General Rules), The Medicine Science and Technology Press of China, Beijing, 2020, pp. 29–34.
A. Nieto-Márquez, E. Atanes J. Valverde, et al., Fuel. Process. Technol. 144 (2016) 274–281.
H. Wang, L. Zhou, J. Sun, et al., Int. J. Hydrog. Energ. 35 (2010) 2994–2996.
X. Yao, C. Lee, C. Whitelaw, et al., Atmos. Environ. 45 (2011) 2781–2788.
K. Dou, Q. Fu, J. You, et al., Biomaterials 133 (2017) 82–93.
H. Jin M. Yang, R. Gui, et al., Coord. Chem. Rev. 446 (2021) 214114.
L. Wu, A. Sedgwick, T. James, et al., Acc. Chem. Res. 52 (2019) 2582–2597. doi: 10.1021/acs.accounts.9b00302
Q. Fu, X. Yang, J. Song, et al., ACS Nano 18 (2024) 3916–3968. doi: 10.1021/acsnano.3c10659
F. Yan, J. Cui, C. Wang, et al., Chin. Chem. Lett. 33 (2022) 4219–4222.
D. Cheng, L. Yuan, X. Zhang, et al., Anal. Chem. 92 (2020) 11396–11404. doi: 10.1021/acs.analchem.0c02277
Y.T. Yang, H. Zhong, B.H. Wang, et al., Chin. Chem. Lett. 34 (2023) 107674.
C. Li, C. Zou, W. Zhu, et al., Anal. Chim. Acta 795 (2013) 69–74.
Q. Xia, S. Feng, G. Feng, et al., Sens. Actuat. B: Chem. 337 (2021) 129732.
S. Feng, D. Liu, G. Feng, Anal. Chim. Acta 1054 (2019) 137–144.
L. Wang, L. Zhao, H. Liu, et al., Microchem. J. 160 (2021) 105703.
X. Bao, X. Cao, C. Huo, et al., J. Agric Food Chem. 69 (2021) 4903–4910. doi: 10.1021/acs.jafc.1c00797
M. Hou, Z. Wang, C. Li, et al., Talanta 265 (2023) 124815.
G. Qin, M. Wu, N. Sang, et al., Toxicol. Sci. 151 (2016) 334-246.
G. Qin, J. Wang, N. Sang, et al., Toxicology 300 (2012) 67–74.
L. Huang, Y. Zhou, X. Xue, et al., Aggregate 5 (2023) e403.
J. Yin, Y. Ma, W. Lin, et al., Coord. Chem. Rev. 412 (2020) 213257.
N. Iwase, T. Sasaki, K. Shirato, et al., J. Clin. Invest. 99 (1997) 1651–1661.
U. Tamima, S. Sarkar, K. Ahn, et al., Angew. Chem. Int. Ed. 62 (2023) e202300580.
B. Yang, R. Tian, Z. Wang, et al., Anal. Chem. 95 (2023) 5034–5044. doi: 10.1021/acs.analchem.2c05523
J. Chen, S. Chen, C. Li, et al., Anal. Chem. 95 (2023) 2119–2127. doi: 10.1021/acs.analchem.2c05235

Scheme 1 The sensing mechanism of the probe NIR-RS to detect SO2 and the simple diagram of NIR-RS imaging SO2 in cell and in vivo.

Figure 1 (a) Ultraviolet (UV) spectrum changes of NIR-RS (10 µmol/L) in the presence of SO2 derivative (200 µmol/L). (b) Fluorescence spectrum changes of NIR-RS (10 µmol/L) detection of SO2 derivative (200 µmol/L). (c) Fluorescence ratio (I582/I702) of NIR-RS upon addition of various analytes (200 µmol/L). 1–40: HSO3−, blank, Cl−, I−, HCO3−, OCN−, AcO−, C2O42−, S2O72−, HSO4−, F−, Br−, SCN−, NO2, S2O32−, Ser, Glu, Lys, Arg, Gly, Phe, His, Ala, Met, Ile, Gln, Thr, Ca2+, Zn2+, Al3+, Fe3+, Cu2+, Mg2+, 5 mmol/L GSH, 200 µmol/L NaHS, Hcy, Cys, S8, CH3SSSCH3, Na2S2 (insert fluorescence spectrum). (d) Competition experiments of NIR-RS for the above various analytes. All experiments were performed in PBS buffer (10 mmol/L, pH 7.4) with 30% DMF at 37 ℃. λex = 480 nm, slit width (10, 10). Data are presented as mean ± standard deviation (SD) (n = 3).

Figure 2 Fluorescent spectral changes of probe NIR-RS (10 µmol/L) upon addition of HSO3− (0–400 µmol/L) Insert: Fluorescence intensity changes at 582 and 702 nm. (b) The linear relationship between the variation in fluorescence ratio (I587/I702) and HSO3− in the range of 0–200 µmol/L. λex = 480 nm, slit width (10, 10). Data are presented as mean ± SD (n = 3).

Figure 3 Imaging the changes of different concentrations of SO2 residual in P. rhizoma sample within cells. (a) The HeLa cells were incubated with 10 µL P. rhizoma sample solution 0 g/kg (B), 0.1 g/kg (C), 0.4 g/kg (D), 5 g/kg (E), then treated with 5 µmol/L NIR-RS for 30 min. (F) The HeLa cells were incubated with 10 µL P. rhizoma (5 g/kg) solution and 200 µmol/L HCHO, then treated with 5 µmol/L NIR-RS for 30 min. The green channel (Em = 540–590 nm, with λex = 488 nm), and the red channel (Em = 680–720 nm, with λex = 633 nm). Scale bar: 30 µm. (b) The simple diagram of mitochondrial ATP change under SO2 stimulation. (c) The structure of Probe Rho-ATP. (d) Imaging the ATP concentration changes of high SO2 residual in P. rhizoma sample within cells. Scale bar: 20 µm. The HeLa cells were incubated with 10 µmol/L Rho-ATP for 20 min (G). The HeLa cells were incubated with P. rhizoma samples 0 g/kg (H), 5 g/kg (I) for 30 min, then incubated with 10 µmol/L Rho-ATP for 20 min; The HeLa cells were incubated with P. rhizoma samples (5 g/kg) and 1 UN/mL apyrase for 30 min, then incubated with 10 µmol/L Rho-ATP for 20 min (J). Quantification of fluorescence intensity of green channel (Em = 570–620 nm, with λex = 561 nm). Data are presented as mean ± SD (n = 3).

Figure 4 Fluorescence imaging of the mice (0, 0.4, 5 g/kg groups) after intravenous injection of NIR-RS (100 µL, 100 µmol/L). (a) Mice abdominal imaging. (b) Mice back imaging. Fluorescence imaging at 570 nm (c) and 710 nm (d) of the heart, liver, spleen, lung, and kidneys after 10 min of tail vein injection of NIR-RS. (e) Plot of the intensity of images kidneys. (f) Plot of the intensity of images liver. Fluorescence quantification analysis of the liver at 570 and 710 nm. Data are represented as the mean ± SD (n = 4). **P < 0.01, ****P < 0.0001.

 扫一扫看文章

扫一扫关注我们
 DownLoad:
 下载:
下载:
 下载:
下载: