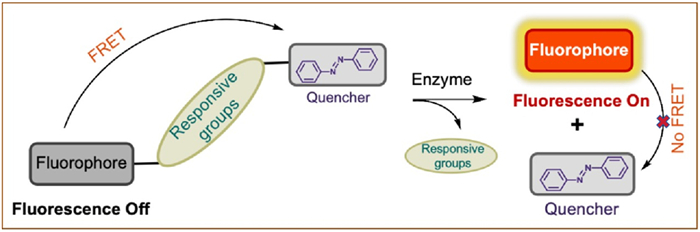
Figure 1.
Diagram of the action mechanism of FRET.

Fluorescence probe for quantitative detection of enzyme activity based on FRET mechanism of azo quencher
Donglei Tian , Yixuan Cao , Xiaoyan Zeng , Xiaoxie Ma , Jun Yin


Biological macromolecules like polysaccharides, nucleic acids, proteins and enzymes, are vital to living organisms [1–3]. Among them, enzymes produced by living cells exhibit a high degree of specificity and catalytic activity towards their substrates, which makes them an extremely class of biocatalysts [4–7]. Enzymes in living organisms are essential for catalyzing reactions, regulating metabolism, facilitating the synthesis and degradation of compounds [8,9]. Abnormal concentrations of specific enzymes can indicate the presence and severity of various diseases. For example, the absence of tyrosinase in the human body can lead to albinism [10–13]. Utilizing enzymes as markers for early disease diagnosis can significantly improve treatment success rates and patient survival chances [14–17]. Thus, precise determination of enzyme activity and localization is essential for diagnosing diseases and advancing related research.
In previous studies, the commonly used methods to detect enzyme activity are usually in vitro detection, such as flow cytometry (FCM), enzyme-linked immunosorbent assays (ELISA), and radionuclide method and absorption spectrometry [18]. These traditional detection methods can only detect enzyme activity in abiotic systems and lack the ability of in-situ detection. As such, there is an increasing demand in the biological and clinical fields for innovative tools, such as a novel class of small molecule fluorescent probes [19–24]. The probes are designed to quantitatively measure the activity of disease-related enzymes in vivo and are also useful for biological imaging. These fluorescent probes overcome the limitations of conventional detection methods by providing high sensitivity, selectivity, precision, and low toxicity, along with the additional advantage of minimal interference. In the intricate environment of living tissue, where a multitude of biomolecules coexist, high selectivity is crucial for minimizing interference from non-target molecules. This enables the precise localization of the target molecule, ensuring accurate and reliable imaging and detection outcomes. These probes enable the direct detection of enzyme activity within cells, making this novel approach increasingly noteworthy in recent developments. Among them, the fluorescent probe for enzyme activity based on Förster resonance energy transfer (FRET) [25] mechanism in which azobenzene is involved as a quencher is considered as an effective molecular tool for in situ enzyme activity quantitative analysis. The design principle of such probes is shown in Fig. 1. This type of probes consists of three components, including a fluorophore, an azo quenching moiety and an enzyme activity response moiety. Moreover, the choice of fluorophores and quenching groups is crucial. There needs to be a good overlap between the emission of the fluorophore and the absorption of the azo-quencher, and the distance between them should be kept a relatively appropriate [26–28].
In recent years, a number of azo-quencher-based FRET in situ enzyme activity fluorescent probes have been successively developed and used to study the biological functions of related enzymes. In view of this, we summarized the recent progress on fluorescent probes of quantitative enzyme activity by using an azo-quencher involving FRET sensing system in this review. And biological function of enzymes, the design of fluorescent probes, the responsive mechanism, the biological applications in living cells or in vivo have been presented. Simultaneously, we also discussed the limitations of these probes, and provides a brief overview of the current state and future prospects of fluorescent probes for in situ enzyme activity visualization.
Glucocerebrosidase (GCase) is a lysosomal lipid hydrolase and a membrane-associated glycoprotein responsible for hydrolyzing glucosylceramide (GlcCer) into glucose and ceramide [29]. Homozygous loss-of-function mutations in the gene encoding GCase result in single amino acid substitutions that destabilize the enzyme, preventing its proper delivery to the lysosome. Instead, these unstable GCase variants undergo degradation in the endoplasmic reticulum, leading to reduced GCase activity. This enzymatic impairment causes the undesirable accumulation of GlcCer in lysosomes, which is the primary driver of Gaucher's disease (GD) [30]. Additionally, unstable mutant forms of GCase have been implicated in Lewy body diseases (LBDs), such as Parkinson's disease [31,32], due to α-synuclein toxicity arising from diminished GCase activity.
Research has shown that small molecule inhibitors of GCase can act as pharmacological chaperones, stabilizing mutant GCase and facilitating its transport to the lysosome. Once inside the lysosome, these mutant enzymes can remain stable and functional even after the inhibitor diffuses out of the cell. Western blot of cell lysates is a conventional method to evaluate enzyme activity enhanced by pharmacological chaperones. However, if the inhibitor is not effectively expelled from the cell, it continues to inhibit the enzyme, leading to significant errors in activity measurement with Western blot. Consequently, developing methods to monitor enzyme activity in live cells is crucial for higher accuracy and for understanding the transport mechanisms of active enzymes in the presence of inhibitor chaperones.
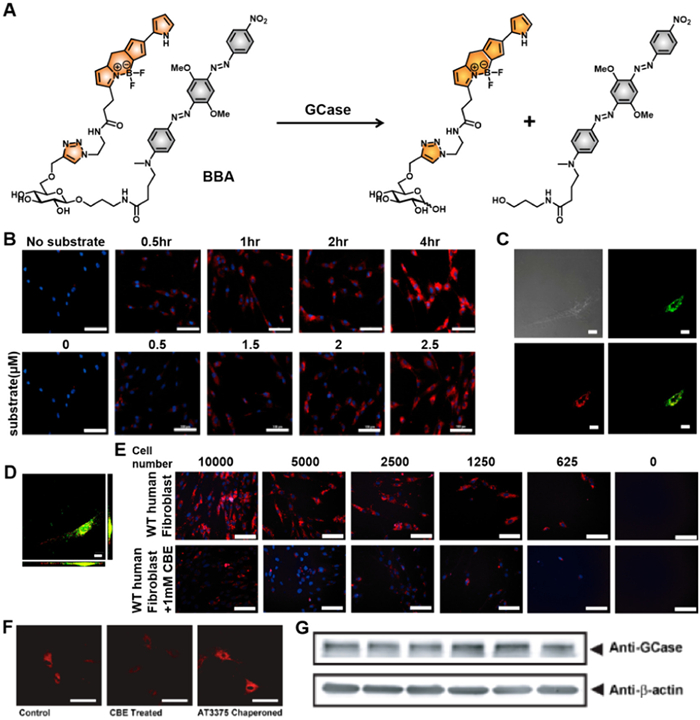
To enable in situ detection of GCase activity in live cells, Vocadlo et al. [33] devised a convenient modular design. This design uses the natural GCase substrate GlcCer as the recognition moiety and a fluorophore–quencher pair capable of FRET for effective fluorescence response. The fluorophore was modified at the 6-position of glucose to ensure compatibility with GCase. Building on this strategy, a lysosome-targeting fluorescent probe, BBA (Fig. 2A), was developed for real-time monitoring of endogenous GCase activity. The probe consists of the fluorophore boron-dipyrromethene (BODIPY), a fluorescence-quenching diazo group, and a glycoside detection unit. The BODIPY fluorophore has an emission wavelength of 595 nm, which overlaps with the excitation range of the diazo quenching group. This overlap enables the FRET process, quenching the fluorescence of BODIPY and rendering the probe non-fluorescent before enzymatic reaction. The quenching efficiency exceeds 99.9%. When GCase encounters the glycosidic group of the probe, enzymatic cleavage separates the fluorophore and quenching group, terminating the FRET process. This reaction activates fluorescence, emitting a visible yellow signal indicative of GCase activity. The probe demonstrated time- and dose-dependent imaging performance (Fig. 2B) and exhibited low toxicity after 3–20 h of incubation. Colocalization imaging confirmed that fluorescence resulting from probe cleavage occurred predominantly in lysosomes (Figs. 2C and D). Comparison experiments with the GCase inactivator conduritol B epoxide (CBE) further validated the probe's specificity for lysosomal GCase (Fig. 2E). Additionally, BBA enabled quantification of chaperone inhibitors targeting wild-type (WT) GCase. Cells incubated with the inhibitory GCase chaperone AT3375 exhibited brighter fluorescence than control and CBE-treated groups (Fig. 2F). This fluorescence increase correlated with immunoblot data showing elevated GCase levels (Fig. 2G). The assay's compatibility with high-content imaging allowed the first direct quantitative imaging of mammalian glycoside hydrolases (GHs) at endogenous levels in live cells. Furthermore, this study provided a valuable molecular tool for investigating GCase activity in situ, paving the way for screening endogenous protein regulators and activators of GCase function within cells.
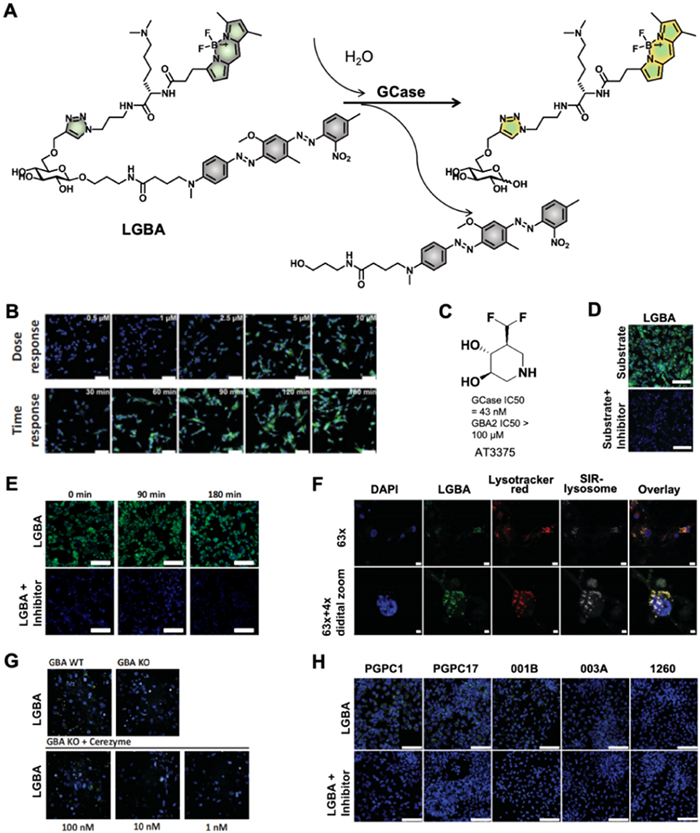
To further explore the influence of endogenous cellular factors on lysosomal GCase activity, Vocadlo et al. [34] aimed to develop a more effective GCase probe based on BBA. To address the poor aqueous and substrate solubility, they introduced a small polar lysosomotropic group, Nε,Nε-dimethyl-L-lysine (dML), to the 6–hydroxyl position of the core glucose moiety. This basic tertiary amine not only enhanced solubility but also facilitated retention within lysosomes. Additionally, pH-insensitive fluorophores were employed to increase the signal-to-background fluorescence ratio. These modifications resulted in the construction of a highly selective FRET probe for GCase, named LGBA (Fig. 3A), enabling the quantitative measurement of GCase activity in lysosomes. Similar to BBA, LGBA followed the same enzymatic mechanism of GCase action. With a quenching efficiency exceeding 99.9%, LGBA demonstrated exceptional sensitivity and selectivity for GCase. In vitro, it exhibited a linear dose- and time-dependent fluorescent signal, underscoring its potential for quantifying GCase activity (Fig. 3B). Cell imaging experiments using the GCase inhibitor AT3375 (Fig. 3C) confirmed LGBA’s high selectivity for GCase (Fig. 3D). Notably, time-course experiments revealed that the fluorescent product generated by LGBA within lysosomes displayed excellent retention, attributed to the lysosomotropic dML residue. These properties established LGBA as an ideal tool for quantitative measurement of GCase activity in live cells using fluorescence microscopy (Fig. 3E). In neurons derived from the live mature forebrain neurons cell line, LGBA exhibited strong lysosomal targeting (Fig. 3F). Its ability to quantitatively measure lysosomal GCase activity was further validated by dose-dependent experiments using the GCase replacement therapy Cerezyme (Fig. 3G). Moreover, LGBA was successfully applied to assess lysosomal GCase activity in patient-derived tissues from five distinct inducible pluripotent stem cell (iPSC) lines differentiated into monocytes, neural progenitor cells (NPCs), and neurons (Fig. 3H). The results highlighted a strong correlation in lysosomal GCase activity across these cell lineages. This innovative design and validation of LGBA provide a robust framework for developing novel enzyme substrates for live-cell imaging.
Beyond GCase enzymes, GHs are also critical for physiological regulation. GHs cleave glycosidic bonds linking monosaccharides to various biomolecules and are implicated in numerous monogenic human diseases and age-related disorders [35]. For instance, mutations in the GLA and NAGA genes result in altered α-galactosidase A (α-GALA) and α-N-acetylgalactosaminidase (α-NAGAL) enzymes, contributing to Fabry disease and Kanzaki disease, respectively [36,37]. Monitoring α-GALA and α-NAGAL activity in lysosomes of living cells is therefore vital for mitigating associated disorders.
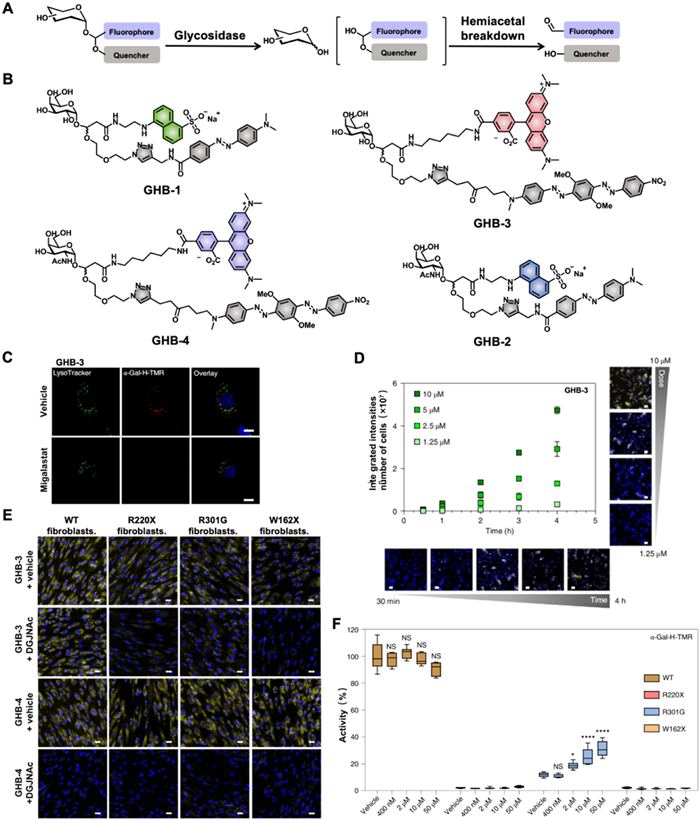
To this end, Vocadlo et al. [38] developed a strategy incorporating a fluorophore and quencher pair into the aglycone via bis-acetal functionality, creating bis-acetal-based fluorescence-quenched substrates (GHBs) for quantitative GH activity analysis. Enzymatic cleavage of GHBs by GHs released a hemiacetal aglycon, which spontaneously dissociated to separate the fluorophore and quencher, resulting in significant fluorescence enhancement (Fig. 4A). Notably, liberated fluorophore attached with aldehyde that reacted with proteins to form imine species could improve the cellular retention effects [39]. However, the first-generation substrates displayed relatively low catalytic efficiency. To improve turnover performance, GHB-1 and GHB-2 were synthesized by reducing steric congestion near the quaternary center proximal to the glycosidic bond. These modifications yielded outstanding selective responses to α-GALA and α-NAGAL, respectively. Building on this foundation, GHB-3 and GHB-4 were developed for cellular studies, offering superior photophysical properties and cell permeability (Fig. 4B). In lysosomal co-localization imaging, the addition of competitive inhibitors migalastat resulted in near-complete absence of fluorescence, demonstrating the enzyme-dependent turnover (Fig. 4C). The probes also showed dose- and time-dependent increase in fluorescence (Fig. 4D). These properties enabled quantitative measurement of α-GALA and α-NAGAL activity in live lysosomes of live cells. Later, the probes were successfully applied to determine the half maximal inhibitory concentration (IC50) values of migalastat and DGJNAc in live cells. Subsequently, the capacity for quantification of enzymatic activity was evaluated in live patient cells, including R220X, W162X, and R301G cells that showed absent or reduced α-GALA activity. In contrast to three patient cells, the treatment of α-NAGAL-specific inhibitor DGJNAc to WT fibroblasts showed no effect on the turnover of GHB-3. And the turnover of GHB-4 was absolutely not observed in WT and three patient cells incubated with DGJNAc. In addition, reduced activity in all three mutant cell lines was accurately measured by GH3 (Fig. 4E). Furthermore, in situ IC50 value of migalastat and its ability to act as a pharmacological chaperone was successfully achieved, finding that migalastat could lead to a threefold dose-dependent increase in lysosomal α-GALA activity (Fig. 4F). Taken together, these results strongly confirmed the excellent ability of this bis-acetal-based fluorescence-quenched substrates for quantitative detection of enzyme activity within mammalian live cells by the utilization of. These findings underscore the reliability of this substrate strategy and its potential in advancing therapeutics and diagnostics for GH-related diseases.
Cathepsin D (CatD) have also made great contributions to the regulation of cellular physiological processes. CatD serves as an immune response effector in macrophages, facilitating protein hydrolysis within the acidic environment of lysosomes and contributing to cellular apoptosis [40,41]. CatD apoptosis impacts both innate and cellular immunity, rendering the body susceptible to bacterial infections or inflammation. Thus, quantitatively assessing CatD activity in macrophages proves instrumental in treating inflammation or bacterial infections.
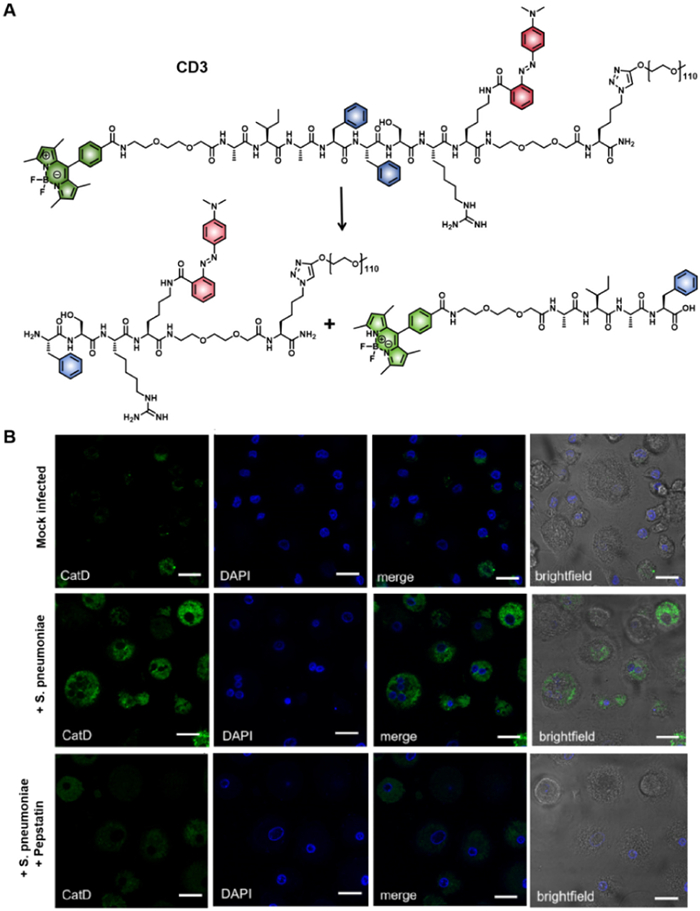
In light of this, Bradley et al. [42] developed a substrate-specific fluorescent probe, CD3, for detecting CatD activity (Fig. 5A). This FRET-based probe pairs the fluorophore BODIPY with the quencher Methyl Red, generating a significant “turn-on” fluorescence at 515 nm upon activation by CatD. The functionalized BODIPY displayed excellent photophysical properties and pH insensitivity, providing high sensitivity across a broad pH range, making it ideal for CatD detection in diverse physiological conditions. Additionally, the incorporation of a long polyethylene glycol (PEG) chain (5 kDa) significantly improved the water solubility of the probe. Thanks to these enhanced properties, CD3 was successfully employed to monitor CatD activity in human monocyte-derived macrophages exposed to bacteria, with a notable fluorescence increase. In contrast, pretreatment with the CatD inhibitor pepstatin A resulted in a significant reduction in fluorescence (Fig. 5B). These results strongly suggest that CD3 can serve as a powerful tool for studying the function and activity of CatD in complex physiological environments.
Cathepsin K (CatK), a member of the cysteine proteinase family, is essential for bone resorption and is highly expressed in osteoclasts, where it degrades bone tissue. Overexpression of CatK can compromise bone integrity, potentially leading to diseases such as osteoporosis, rheumatoid arthritis, and bone metastasis [43]. Real-time, in situ monitoring of CatK activity can provide valuable insights into the dynamic biology of osteoclasts, aiding the development of therapeutic strategies for osteoclast-associated bone diseases.
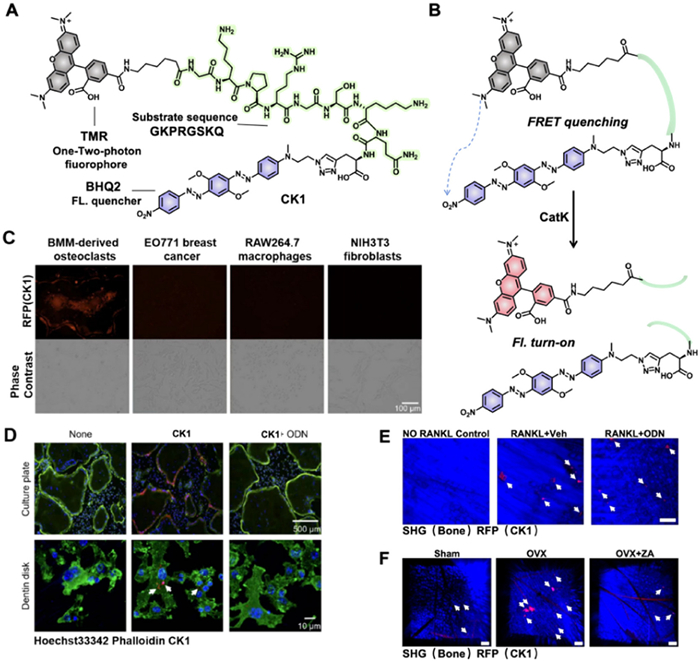
To this end, Kim et al. [44] introduced a novel two-photon FRET-based probe, CK1, for real-time tracking of CatK activity in osteoclasts (Fig. 6A). The probe design incorporates 5-carboxytetramethylrhodamine (TMR) as the fluorophore and black hole quencher 2 (BHQ2) at the N-terminal and C-terminal of the CatK substrate sequence, respectively, to create the FRET pair. Upon activation by CatK, the fluorescence at 585 nm significantly increases due to the disruption of the FRET process (Fig. 6B). In vitro fluorescence imaging demonstrated that CK1 could specifically detect CatK activity in the resorption lacunae of functional osteoclasts rather than in other cell types, producing a pronounced fluorescence signal (Fig. 6C). And the fluorescent signals in osteoclasts were thoroughly destroyed by the administration of odanacatib (ODN), a selective CatK inhibitor, further illustrating CatK-dependent responsive of CK1 (Fig. 6D). The excellent subcellular localization of the probe further facilitated the study of CatK functions within cells. Moreover, two-photon intravital imaging with CK1 enabled successful visualization of osteoclast activity in distinct murine models of bone diseases. As shown in the imaging, the fluorescent intensities in receptor activator of nuclear factor-κB ligand (RANKL)-induced bone loss model and ovariectomy (OVX) model were sharply diminished by the addition of ODN and zoledronate (ZA), indicating that CK1 enabled monitoring the osteoclast activity attenuation following pharmacological interventions and potentially used as a versatile tool for evaluating the efficacy of therapies targeting osteoclast-related bone diseases (Figs. 6E and F). Therefore, CK1 offers a highly efficient means of tracking pathological osteoclast activation, providing valuable insights for developing novel therapeutic strategies and anti-osteoporotic drugs.
The ability to detect the initiation and progression of diseases, as well as to differentiate between healthy and cancerous cells, is crucial in both fundamental biological research and clinical practices for diagnosis and treatment. To date, a variety of enzymes have been identified as biomarkers for diseases, including cancer. This review focuses on the development of organic small-molecule fluorescent probes designed for enzyme detection, offering potential tools for early disease diagnosis, screening, and tumor identification. Fluorescence bioimaging technology, with its high selectivity, sensitivity, simplicity, rapid response, low detection thresholds, and high spatial and temporal resolution, along with low cytotoxicity, forms the foundation for the biomedical applications of these probes. The continued development of these probes promises to make significant contributions to both basic biological research and the early detection of diseases, ultimately facilitating more effective treatments.
Despite significant progress in the development of small-molecule fluorescent probes, several challenges remain. In particular, many fluorescent probes still lack effective in-situ detection capabilities, and the accuracy of these probes in identifying disease-related biomolecules can often be compromised by significant errors. Addressing these challenges is essential for ensuring the reliability and success of these technologies in biomedical applications. However, ongoing technological advancements and dedicated scientific research hold great promise for creating a wide range of small-molecule probes that can respond to diverse biomolecules. The development of such probes, which aim to improve the detection of disease-related biomarkers for routine clinical diagnostics and real-time disease monitoring, is of profound scientific importance and offers promising prospects for biological research and disease diagnosis.
Donglei Tian: Writing – review & editing, Writing – original draft. Yixuan Cao: Writing – review & editing, Writing – original draft. Xiaoyan Zeng: Supervision. Xiaoxie Ma: Supervision. Jun Yin: Writing – review & editing, Writing – original draft, Supervision.
The authors declare that they have no known competing financial interests or personal relationships that could have appeared to influence the work reported in this paper.
This work was supported by the National Key R&D Program of China (No. 2022YFA1207400), National Natural Science Foundation of China (No. 22274061), the 111 Project (No. B17019) and Fundamental Research Funds for the Central Universities (No. CCNU24JCPT030).
L. Yang, Q. Chen, Z. Wang, H. Zhang, H. Sun, Coordin. Chem. Rev. 474 (2023) 214862. doi: 10.1016/j.ccr.2022.214862
Y. Xie, S. Du, Z. Liu, et al., Angew. Chem. Int. Ed. 61 (2022) e202200303. doi: 10.1002/anie.202200303
Y. Liao, Y. Liang, Y. Huang, et al., Chin. Chem. Lett. 35 (2024) 109092. doi: 10.1016/j.cclet.2023.109092
X. Li, C. Yin, L. Zhang, F. Huo, Dyes Pigments 219 (2023) 111631. doi: 10.1016/j.dyepig.2023.111631
Y. Yao, Y. Zhang, C. Yan, W.H. Zhu, Z. Guo, Chem. Sci. 12 (2021) 9885–9894. doi: 10.1039/d1sc02069b
H. Fang, B. Peng, S.Y. Ong, et al., Chem. Sci. 12 (2021) 8288–8310. doi: 10.1039/d1sc01359a
J.J. Morsby, B.D. Smith, Bioconjug. Chem. 33 (2022) 544–554. doi: 10.1021/acs.bioconjchem.2c00057
E. Rajakumara, S. Abhishek, K. Nitin, et al., ACS Chem. Biol. 17 (2022) 266–280. doi: 10.1021/acschembio.1c00500
R.G. Webster, Y. Guan, M. Peiris, Coordin. Chem. Rev. 429 (2021) 213645. doi: 10.1016/j.ccr.2020.213645
S. Ma, G. Chen, J. Xu, et al., Coordin. Chem. Rev. 427 (2021) 213553. doi: 10.1016/j.ccr.2020.213553
J. Zhang, X. Chai, X.P. He, et al., Chem. Soc. Rev. 48 (2019) 683–722. doi: 10.1039/C7CS00907K
X. Ma, Y. Huang, A. Li, et al., ChemMedChem 18 (2023) e202300204. doi: 10.1002/cmdc.202300204
H. Zhang, C. He, L. Shen, et al., Chin. Chem. Lett. 34 (2023) 108160. doi: 10.1016/j.cclet.2023.108160
H. Jeong, X. Wu, J.S. Lee, J. Yoon, Trend. Anal. Chem. 168 (2023) 117335. doi: 10.1016/j.trac.2023.117335
X. Wu, R. Wang, N. Kwon, H. Ma, J. Yoon, Chem. Soc. Rev. 51 (2022) 450–463. doi: 10.1039/d1cs00543j
R. Shi, Q. Wu, C. Xin, et al., ChemBioChem 20 (2019) 1487–1497. doi: 10.1002/cbic.201800813
S. Shen, W. Xu, J. Lu, et al., Chin. Chem. Lett. 35 (2024) 108360. doi: 10.1016/j.cclet.2023.108360
D. AmarieiA, M. Haase, T.K.M. Klischan, et al., ChemCatChem 16 (2024) 11.
X. Zeng, X. Ma, J. Dong, et al., Angew. Chem. Int. Ed. 62 (2023) e202312618. doi: 10.1002/anie.202312618
D. Li, T. Shen, X. Xue, et al., Sci. China Chem. 66 (2023) 2329–2338. doi: 10.1007/s11426-023-1661-6
Z. Li, X. Gao, H. Zhang, et al., Chin. Chem. Lett. 34 (2023) 107645. doi: 10.1016/j.cclet.2022.06.068
X. Ma, Y. Huang, W. Chen, et al., Angew. Chem. Int. Ed. 62 (2023) e202216109. doi: 10.1002/anie.202216109
X. Zeng, Y. Huang, J. Dong, et al., Adv. Agrochem. 1 (2022) 73–84. doi: 10.1016/j.aac.2022.08.001
Y. Huang, W. Chen, J. Chung, J. Yin, J. Yoon, et al., Chem. Soc. Rev. 50 (2021) 7725–7744. doi: 10.1039/d0cs01340d
T. Förster, Naturwissenschaften, 33 (1946) 166–175. doi: 10.1007/BF00585226
L. Wu, C. Huang, B.P. Emery, et al., Chem. Soc. Rev. 49 (2020) 5110–5139. doi: 10.1039/c9cs00318e
A.J.P. Teunissen, C. Pérez-Medina, A. Meijerink, W.J.M. Mulder, Chem. Soc. Rev. 47 (2018) 7027–7044. doi: 10.1039/c8cs00278a
Y. Shen, C. Nie, Y. Wei, et al., Coordin. Chem. Rev. 469 (2022) 214676. doi: 10.1016/j.ccr.2022.214676
V. Lombard, H.G. Ramulu, E. Drula, P.M. Coutinho, B. Henrissat, Nucleic Acids Res. 42 (2014) D490–D495. doi: 10.1093/nar/gkt1178
I. Bendikov-Bar, M. Horowitz, Hum. Mutat. 33 (2012) 1398–1407. doi: 10.1002/humu.22124
E. Sidransky, G. Lopez, Lancet Neurol. 11 (2012) 986–998. doi: 10.1016/S1474-4422(12)70190-4
A. Lwin, E. Orvisky, O. Goker-Alpan, M.E. LaMarca, E. Sidransky, Mol. Genet. Metab. 81 (2004) 70–73. doi: 10.1016/j.ymgme.2003.11.004
A.K. Yadav, D.L. Shen, X. Shan, et al., J. Am. Chem. Soc. 137 (2015) 1181–1189. doi: 10.1021/ja5106738
M.C. Deen, Y. Zhu, C. Gros, et al., Proc. Natl. Acad. Sci. U. S. A. 119 (2022) e2200553119. doi: 10.1073/pnas.2200553119
A. Varki, R. Cummings, J. Esko, et al., Essentials of Glycobiology, 3rd edn, Cold Spring Harbor Laboratory Press, New York, 2017.
J.M. Aerts, J.E. Groener, S. Kuiper, et al., Proc. Natl. Acad. Sci. U. S. A. 105 (2008) 2812–2817. doi: 10.1073/pnas.0712309105
D.P. Germain, Orphanet J. Rare Dis. 5 (2010) 30. doi: 10.1186/1750-1172-5-30
S. Cecioni, R.A. Ashmus, P.A. Gilormini, et al., Nat. Chem. Biol. 18 (2022) 332–341. doi: 10.1038/s41589-021-00960-x
H.V.K. Diyabalanage, G.C. Van de Bittner, E.L. Ricq, J.M. Hooker, ACS Chem. Biol. 9 (2014) 1257–1262. doi: 10.1021/cb500248r
C. Oberle, J. Huai, T. Reinheckel, et al., Cell Death Differ. 17 (2010) 1167–1178. doi: 10.1038/cdd.2009.214
L.P. Deiss, H. Galinka, H. Berissi, O. Cohen, A. Kimchi, EMBO J. 15 (1996) 3861–3870. doi: 10.1002/j.1460-2075.1996.tb00760.x
M. Rodriguez-Rios, B.J. McHugh, Z. Liang, et al., Commun. Chem. 6 (2023) 237. doi: 10.1038/s42004-023-01035-9
M.M. McDonald, A.S. Kim, B.S. Mulholland, M. Rauner, JBMR Plus 5 (2021) e10539. doi: 10.1002/jbm4.10539
K. Seyoung, E.J. Lee, H. Xiong, et al., Angew. Chem. Int. Ed. 63 (2024) e202318459. doi: 10.1002/anie.202318459

Figure 2 (A) Structure of the lysosome-targeting fluorescent probe BBA and its fluorescence response mechanism toward GCase. (B) Time-dependent fluorescence imaging of BBA in human fibroblasts (scale bar: 100 μm). (C) Confocal microscopy imaging of probe-treated cells co-stained with LysoTracker Green DND-26, with fluorescence images from a central Z-section (scale bar: 20 μm). (D) Maximum intensity projection of Z-sections in confocal microscopy imaging (scale bar: 20 μm). (E) Comparison of fibroblast fluorescence imaging after treatment with CBE, showing reduced fluorescence compared to BBA treatment (scale bar: 100 μm). (F) Fluorescence imaging of fibroblasts incubated with BBA and the chemical chaperone AT3375, compared to untreated cells (scale bar: 50 μm). (G) Immunoblot of fibroblasts treated with AT3375 (10 μmol/L). Reproduced with permission [33]. Copyright 2015, American Chemical Society.

Figure 3 (A) The highly-selective FRET probe for GCase LGBA and its fluorescence response toward GCase. (B) Dose and time response of LGBA in live SK-N-SH cells. (C) The structure of inhibitor AT3375 (D) Comparison of fluorescence imaging of LGBA in live SK-N-SH cells treated with inhibitor AT3375 and blank control cells. Scale bar: 100 μm. (E) Representative images of the substrate diffusion assay with LGBA. Scale bar: 50 μm. (F) Representative high-resolution confocal images of lysosomal colocalization of LGBA in live mature forebrain neurons. Scale bar: 10 μm. (G) Representative high-resolution confocal images of human neurons showing response in LGBA signal to enzyme replacement with Cerezyme. (H) Representative images of lysosomal GCase activity in different lines of patient iPSC-derived NPCs. Scale bar: 100 μm. Reproduced with permission [34] [licensed under Creative Commons Attribution License (CC BY)]. Copyright 2022, National Academy of Sciences.

Figure 4 (A) Diagram illustrating the action mechanism of FRET. (B) Structure of the bis-acetal-based fluorescence-quenched substrates GHB-(1–4). (C) Co-localization of GHB3 (red) with lysosome tracker green (green) in the presence and absence of certain conditions. Scale bar: 10 μm. (D) Dose and time responses of GHB turnover in live SK-N-SH cells. Scale bar: 25 μm. (E) Fluorescence images from more than three independent experiments showing patient fibroblasts with probes (blue, 4′,6-diamidino-2-phenylindole (DAPI) channel) and product (yellow, tetramethylrhodamine Isothiocyanate (TRITC) channel). Scale bar: 25 μm. (F) Chaperoning with migalastat in fibroblasts determined by IC50. Reproduced with permission [38]. Copyright 2022, Springer Nature.

Figure 5 (A) The substrate-specific fluorescent probe CD3 and its fluorescence response mechanism toward CatD. (B) Detection of CatD activity in monocyte-derived macrophages. Scale bar: 25 μm. Reproduced with permission [42]. Copyright 2023, Springer Nature.

Figure 6 (A) The novel two-photon FRET-based probe CK1. (B) Diagram illustrating the FRET action mechanism. (C) Fluorescence microscopic images of CK1 in different cell types. (D) Fluorescence images of osteoclasts differentiated on culture plates and dentin slices. (E) Intravital two-photon microscopic images revealing CK1 signals in different treatment groups, alongside a comprehensive quantification of CK1 fluorescence intensity per region of interest (ROI). (F) Intravital two-photon microscopic images showing CK1 signals in different treatment groups. Scale bar: 100 μm. Reproduced with permission [44]. Copyright 2023, John Wiley and Sons.

 扫一扫看文章


扫一扫关注我们
 DownLoad:

 下载:
 下载: