Table 1.
The scale and dimension of test methods for ion transport.
Citation:
Shanyan Huang, Shijie Li, Zheng Huang, Kailun Zhang, Wei-Li Song, Shuqiang Jiao. A review of multiscale characterization methods of ion transport in solid-state electrolytes[J]. Chinese Chemical Letters,
2026, 37(5): 110973.
doi:
10.1016/j.cclet.2025.110973

A review of multiscale characterization methods of ion transport in solid-state electrolytes
English
A review of multiscale characterization methods of ion transport in solid-state electrolytes
Abstract:
Solid-state batteries that present lower risk factors and higher energy density are promising for advanced energy storage and applications. In particular, solid-state electrolytes (SSEs) are the critical components that responsible for ionic transport between negative electrodes and positive electrodes. It is crucial to fundamentally understand the ionic transport models and behaviors in the SSEs, with purpose of enhancing ion transport rate and stability of SSEs. To rationally improve the solid-state ion transport behavior of electrolytes, this review summarizes recent progresses on the transport principles and multiscale characterization methods of ion transport in SSEs, including traditional electrochemical methods, frequency-dependent spectroscopy, two-dimensional morphological imaging and three-dimensional morphological imaging. It is emphasized that combination of multiscale and multiple methods would be a developing trend for fundamentally understanding the mechanism of ion transport in SSEs. According to comprehensive transport principle and behaviors, hierarchical fillers are designed for composite electrolytes with fast ionic transport abilities. The remaining challenges for establishing advanced multiscale characterization methods are also discussed.
-
1. Introduction
Since lithium-ion batteries (LIBs) were commercialized in the 1990s, it has emerged as the most extensively developed and utilized power sources, owing to their advantage of energy and power density [1–6]. Currently, commercial LIBs are mostly assembled based on liquid organic electrolytes with adding various additives and lithium salts. Although these electrolytes possess good ion transport properties, they are also volatile, flammable, and potentially explosive. To address the safety concerns associated with liquid electrolytes, researchers have explored the potential substitution of liquid electrolytes with solid-state electrolytes (SSEs), which is an emerged technology for the further development of high-power and high-safety Li-based batteries [7–11].
The advancement of solid-state batteries (SSBs) originated from the discovery of solid-state ion conductors. In 1833, Michael Faraday was the first to report the phenomenon of ion conduction in AgS2 and offered the renowned "Faraday's Law" [12]. In the 1950s study of SSBs began on the batteries employing AgI [13] and AgCl [14] as electrolytes. During this period, the voltage of SSBs remained below 1 V, and the discharge current was limited [15]. In the 1970s, the discovery of Li+ conduction behavior in halides led to the development of lithium metal batteries utilizing LiI as the SSEs, significantly improving the energy storage abilities of the batteries [16,17]. In 1969, Rao firstly applied a LiI film in the Li|LiI|I2 solid-state lithium-ion battery, which showed an open circuit voltage of 3 V [18–20]. In the same year, Professor Charies proposed a series of Li|LiI|MI (M represents Ag, Cu, and Pb) SSBs. By incorporating Al2O3 powder into LiI, the specific energy density of this battery type reached 100–200 Wh/kg. However, the development of a continuous LiI interface at the electrolyte-electrode interface during cycling resulted in the blockage of ion transport channels, leading to increased battery polarization and internal resistance [21].
The advancement of rechargeable SSBs commenced with the discovery of intercalation electrode materials. In 1983, Knutz reported a rechargeable SSB utilizing Li|Li3N|TiS2, which demonstrated over 200 cycles [22]. Meantime, researchers at Hitachi developed another type of rechargeable SSBs employing Li3.6Si0.6P0.4O4 as the electrolyte. By improving the preparation process of the electrolyte film, this battery achieved a recharge-discharge cycle exceeding 2000 times [23]. In 1973, Fenton discovered the ion conductivity of polyethylene oxide (PEO), which was subsequently utilized in the SSBs. Polymeric SSEs, derived from PEO, become a major research hotspot in SSBs development [24,25]. In comparison with lithium halide films, polymeric SSEs have demonstrated nice compatibility with electrolyte materials and were successfully commercialized by Bolloré Group in the Autolib project.
Several inorganic solid-state ion conductors were also reported, including sodium fast ion conductor (NASICON) discovered by Goodenough in 1976 [26] and the lithium fast ion conductor (LISICON) with a similar structure, Li1.3Al0.3Ti1.7(PO4)3, first showed by Professor Anon in 1989 [27,28]. In 1993, Inaguma et al. reported the perovskite Li0.34La0.51TiO2.94 (LLTO) electrolyte with ionic conductivity of over 10−3 S/cm [29]. Another significant oxide in the development of fast ion conductors is garnet-type Li7La3Zr5O12 (LLZO) discovered in 2003, with conductivity determined in 2007 [30]. SSEs composed of these oxide materials demonstrate higher ion conductivity and mechanical strength [31,32]. However, the enhanced mechanical strength reduces the risk of thin film piercing, which can result in short circuits between positive and negative electrodes, but it also diminishes the connection between the electrode and the electrolyte, increasing the internal resistance. To strengthen the electrode-electrolyte interface compatibility, enabling closer exposure, researchers have added 15 wt% of 0.44LiBO2–0.56LiF during co-sintering [33]. As a result, the Li4Ti5O12|Li1.3Al0.3Ti1.7(PO4)3|LiMn2O4 SSBs showed enhanced cycling stability and greatly minimized capacity loss after 10 weeks of cycling. In the same period, Bates et al. prepared LiPON using magnetron sputtering technology under a nitrogen atmosphere, which demonstrated good compatibility with high-voltage positive electrodes and lithium metal negative electrodes during cycling [34,35]. Sulfide electrolytes also exhibit good Li ion transport properties due to the weak bonding characteristics of the Li-S bond [36]. With the advancement of solid-state energy storage technology, numerous studies on SSEs have emerged, and the ion conductivity of these electrolytes has approached that of commercial electrolytes [37,38]. The SSBs are beginning to show commercial potential. In 2011, Professor Ryoji Kanno's group at the Tokyo Institute of Technology in Japan discovered a sulfide SSE, Li10GeP2S12, which demonstrated ionic conductivity comparable to, or even greater than, that of liquid electrolytes [39]. In 2016, this group broke their own record due to the discovery of Li9.54Si1.74P1.44S11.7Cl0.3 [40].
In addition to material development, manufacturing process play crucial roles in influencing the capabilities of SSBs. According to battery manufacturing processes, the SSBs can be sorted into four classifications [41]. The first kind of SSBs employs oxide ion conductors as SSEs. These batteries exhibit low ion conductivity at room temperature but demonstrate a significant increase in ion conductivity at elevated temperatures. The second type is based on sulfide ion conductors as electrolytes, which exhibit ultra-high ion conductivity at room temperature. The third type is linked with LiPON thin films using micro-nano manufacturing technologies such as magnetron sputtering. The fourth type utilizes polymer-based SSEs, which are flexible, stable, and easy to mass-produce, offering various manufacturing processes. Although it is a challenge to meet the operation requirement based on each single type of electrolytes, the trend for combining component integration and structural design to reach the complementary advantages of various SSEs [42].
Owing to the complexity of the electrolytes via component integration and structural design, it is urgent to fundamentally understand the ion transport behaviors in the SSEs. Herein, we firstly study the physical model of ion conduction in SSEs. As the critical topic in this review, various methods for characterizing the ion transport behaviors at different scales would be summarized, as shown in Table 1 and Fig. 1. Based on the traditional electrochemical methods, i.e., we could determine the ionic conductivity of the electrolytes via EIS and CA via measuring the macroscopic bulk composites. Moreover, NMR, DS and X-ray photoemission spectroscopy are the methods for identifying the ionic transport at specific frequency, linking with the resonant components at a specific scale. Additional methods upon morphological imaging could be used to probe the component and its concentration distribution. The characterization scales are strongly dependent on the imaging resolution of the techniques. Typically, two-dimensional (2D) morphological imaging methods involve TEM, KPFM and SEM coupled with element mapping. Additionally, three-dimensional (3D) morphological imaging methods mainly contain CT, TOF-SIMS and neutron diffraction. Based on understanding the ion transport behaviors at various scale, we also briefly highlighted typical progresses in designing various fillers, i.e., mainly using zero-dimension (0D), one-dimensional (1D), 2D or 3D fillers, to fabricating SSEs. Finally, the remaining challenges for developing multiscale characterization methods have been discussed with purpose of fundamentally studying the ion transport mechanism in the SSEs.
Table 1

 DownLoad:
CSV
DownLoad:
CSV
Methods (+: combined method) Scale Dimension EIS+CA Frequency dependent
(micro-meter~meter)Arbitrary dimension
(Statistical)EIS+DC Frequency dependent
(micro-meter ~meter)Arbitrary dimension
(Statistical)EIS+CA+DS Frequency dependent
(nano-meter~meter)Arbitrary dimension
(Statistical)NMR Nano-meter~micro-meter 1D KPFM Nano-meter~micro-meter 2D SEM/TEM Nano-meter~micro-meter 2D Neutron Micro-meter ~meter 3D TOF-SIM+(EIS) Nano-meter~micro-meter 2D-3D micro-CT+(EIS) Micro-meter ~meter 3D nano-CT+(EIS) Nano-meter~micro-meter 3D Figure 1
 Figure 1. Combined methods for understanding ion transport behaviors in SSEs and designing hierarchical fillers for composite electrolytes with fast ionic transport abilities.
2. Physical model of ion conduction in SSBs
The ion conduction mechanism in SSBs is significantly different from that in liquid electrolytes. Fig. 2 shows a schematic diagram illustrating several distinct paths for ion conduction in SSEs. The transport process of lithium ions in liquid electrolytes entails the migration of solvated ions through the solvent, following the principles outlined in the Stokes-Einstein equation [43]. The increasement of salt/ion dissociation in high dielectric constant solvents and debasement of solvent viscosity can accelerate migration rate of solvated ions, thus improving lithium ions conductivity of electrolyte [44]. Due to the rapid exchange and uniform environment of solvent molecules, the potential energy curve for mobile lithium ions in the electrolyte remains relatively flat. In contrast, crystalline or amorphous SSEs present a different scenario for the diffusion of Li+ ions. The diffusion of these ions necessitates periodic bottleneck points along the diffusion path, which exhibit higher energy barriers compared to the diffusion sites. Consequently, a periodic oscillating potential energy curve is formed along the diffusion path in SSEs.
Figure 2
 Figure 2. Schematic diagram of the ion conduction path of SSEs: (a) Inorganic SSEs; (b) amorphous polymer SSEs; (c) crystalline polymer SSEs. Reprinted with permission [43]. Copyright 2004, American Chemical Society.
Ion movement is propelled by the gradients of chemical and electrochemical potential in the system. In the field of physical chemistry, the Nernst-Planck equation is often used to relate the transport of charged particles to the gradients of chemical and electric potential (represented as ∇ci and ∇φ). By applying mass conservation principles, the current density (j) can be calculated [45]:
$ j=-F^2 \nabla \varphi \sum\limits_i \mu_i c_i-F \sum\limits_i D_i \nabla c_i+F u \sum_i c_i $ (1) Here, F represents the Faraday constant, µi represents the migration rate of charged particle i, ci represents the ion concentration, Di means the diffusion coefficient, and u means the convection rate. For the ion transport in solid-state system, the concentration and electric potential gradients increase at the interface, resulting in a significant increase in diffusion and migration terms while convection can usually be neglected. Under small concentration gradients, Eq. 1 can be simplified as:
$\sigma=-\frac{j}{\nabla \varphi}=-F^2 \sum\limits_i \mu_i c_i $ (2) where σ represents ionic conductivity. As shown in Eq. 2, high ion conductivity relies on both high mobility and a significant carrier concentration, allowing charged ions to overcome the energy barrier and move quickly under the potential drive. Therefore, a fast ion-conducting medium needs to facilitate ion dissociation with a low conduction barrier.
In SSEs, the ions that overcome energy barriers can jump between sites. The diffusion coefficient is a function of the migration free energy:
(3) where γ represents the geometric factor, a represents the distance between ion jump sites, f0 is the attempt frequency of ion jump, which is the migration free energy. Combined with (2), (3), σ can be expressed as:
(4) where ΔSmig and ΔHmig are ion migration entropy and enthalpy, respectively. If ionic pair dissociation is thermally activated, the carrier concentration ci is related to the formation enthalpy [46].
(5) where c0 represents the initial concentration under standard conditions. By combining the pre-exponential factor and various activation energies, we can derive the well-known Arrhenius equation:
(6) The pre-exponential factor is a function that depends weakly on temperature, which represents the total energy barrier that an ion has to overcome to form a carrier by thermal activation and to migrate in the electrolyte. Therefore, the activation energy includes both the formation energy of the carrier and the energy barrier for its diffusion in the electrolyte.
The amorphous materials have higher entropy and more free volume for movement, which makes them superior ion conductors. As one of the representative achievements in the field of ion conductors, there exists a highly conductive glass phase in AgI-Ag2SeO4 [47]. Like most amorphous materials, glasses undergo transitions between liquid, crystalline, and glassy states as temperature and processing history vary, and they typically exhibit smaller structural units with long-range disorder. The amorphous network theoretically has an infinite relaxation time, and ion transport occurs via hopping from one site to another with lower energy, similar to that in crystals [48]. At temperatures below the glass transition temperature (Tg), ion migration conforms to the Arrhenius equation, and the ion transport behaves similarly to that in crystals within this range. When the temperature is above Tg, the structural units can relax around the site and assist ion transport, and the ion transport and structural relaxation are coupled. The strength of structural relaxation depends on the material viscosity, which decreases with increasing temperature. Therefore, the Vogel-Fulcher-Tammann equation is modified to describe such a case:
(7) When ions conduct within the bulk phase of a material, the microstructure and physicochemical properties of material are key factors in defining the migration path of ions, whether in crystalline or amorphous materials. Crystals possess a periodic coordination polyhedron structure, and actual crystal materials contain defects such as gaps and vacancies, which contribute to rapid ion migration. In crystal fast ionic conductors, the energy pattern of ion transport is primarily determined by the topological structure, crystal structure coordination, and ion binding sites. The design of superionic conductors for effectively transport Li+ often feature disordered sub-lattices, a high density of lithium vacancies, and interconnected gap sites. Dynamics simulations have demonstrated that in fast ionic conductors such as LGPS, LLZO, and LATP, Li+ exhibits cooperative migration. Multiple ions simultaneously jump to the nearest position rather than a single ion sequentially overcoming the energy barrier to reach the next site [49]. In fast ion conductors, ion diffusion often displays anisotropic characteristics [50]. Neutron powder diffraction studies have revealed that in the LGPS lattice, a one-dimensional conducting channel traverses the diffusion plane, forming a quasi-isotropic three-dimensional diffusion path [51]. As temperature increases, ion migration within the lattice transitions from predominantly one-dimensional to a three-dimensional dominant conduction mechanism, which complicates the analysis of transport behavior [52]. For LLZO-like oxide electrolytes, the cubic garnet phase's ionic conductivity greatly exceeds that of the tetragonal phase. The enhanced ion diffusion rate in LLZO electrolytes leads to more uniform ion redistribution, mitigating polarization issues.
In low molecular weight polymers and oligomers, ion conduction primarily occurs through the solvation of the electrolyte [53]. Amorphous polymers, such as polyethylene oxide (PEO), conduct ions via segmental relaxation. In the case of PEO, the local movement of Li+ diffusion along the PEO chain, as well as the inter-segment jumping and collective motion of coordinating ions along the entire polymer chain, facilitate the diffusion of Li+ [54]. For high molecular weight polymers, segment entanglement affects ion solvation and polymer chain diffusion. Therefore, inter-segment jumping of ions becomes the main mode of transport. Polymer electrolytes' ionic conductivity is closely associated with their crystallinity. Experimental findings indicate that ionic conduction in the amorphous region of a polymer is faster, suggesting that lowering crystallinity is key to enhancing the polymer electrolytes' ionic conductivity [55].
3. Multi-scale characterization methods for solid-state ion conduction
The interface between the electrode and SSEs is often critical in regulating ion transport and exchange. SSEs materials typically exhibit lower ion transport rates and higher resistance, resulting in significant potential drops and ion concentration changes at the interface. Owing to the disparities between the electrode and SSEs, the charge distribution at their interface is often non-uniform, leading to potential shifts and ion concentration variations. These phenomena directly impact the performance and stability. Therefore, it is critical to grasp and manage the ion transport mechanism in interface. Utilizing different characterization techniques to study the space charge region at the interface enables a more in-depth understanding of ion transport behavior in complex and diverse solid-state media. This, in turn, opens up new avenues and directions for enhancing the performance of SSEs.
3.1 Traditional electrochemical methods
In order to elucidate the ion transport mechanism in composite electrolytes, researchers have utilized a range of characterization tools to gain insights at different scales. At the macroscopic level, electrochemical impedance spectroscopy (EIS) and chronoamperometry (CA) are commonly employed to determine the ionic conductivity [56]. For example, Wang et al. effectively separated the conductivity of typical positive electrode materials, such as LiCoO2 (LCO), LiNi1/3Mn1/3Co1/3O2 (NCM-333), and LiNi0.5Mn0.3Co0.2O2 (NCM-532) using the principle depicted in Fig. 3 [57]. The Huggins method was utilized to separate the electronic and ionic conductivities via EIS. The two semicircles observed in the impedance spectra of the mixed conductor correspond to the parallel connection of electronic resistance and structural capacitance at low frequencies, as well as the parallel connection of ionic resistance and structural capacitance at high frequencies. Due to electronic current shunting the interfacial capacitance at low frequencies, the conventional low-frequency tail is absent. When CA was employed to separate the ionic and electronic currents, both ionic and electronic currents were initially present upon the application of voltage. However, due to the presence of ionic blockage at the electrode, the ionic current (Ii) decays over time until it disappears, and the steady-state current will represent the electronic current (Ie). The corresponding ionic conductivity σi and electronic conductivity σe were calculated based on Ohm's law using the current versus time curve. In 2000, Maier et al. combined micro-nanofabrication methods with EIS to characterize the enhanced effect of space charge layers on the overall ionic conductivity of multilayered nanowires [58]. Additionally, by utilizing a blocking electrode and a high time-resolution electrochemical test device, the CA method can effectively capture the attenuation process of ion conduction current in electrolytes, enabling the determination of the ionic conductivity.
Figure 3
 Figure 3. (a) Scheme for testing method to obtain the electronic and (b, c) ionic conductivity of bulk samples. Reprinted with permission [57]. Copyright 2018, Elsevier.
To analyze battery failure, galvanostatic potential curves, EIS and materials characterization techniques are frequently utilized. In the case of LIBs, repeated charging leads to uneven lithium electroplating on the negative electrode surface, resulting in dendrite formation. As time progresses, dendrites can penetrate the separator and reach the positive electrode, causing internal short circuits (Fig. 4a) [59]. A sharp decrease in bulk resistance which can be observed through EIS or dielectric spectroscopy will reveal the presence of internal short circuits. Adding a thin intermediary layer between the positive and negative electrode to monitor voltage changes from lithium dendrites can enable early detection of battery failure (Fig. 4b).
Figure 4
 Figure 4. (a) The formation of dendrites in LIBs. (b) The voltage profile in a Li/Li battery. Reprinted with permission [59]. Copyright 2014, Springer Nature. (c) The charge-discharge profile and impedance spectra. (d) The evolution of the four resistances from impedance spectra fitting. Reprinted with permission [60]. Copyright 2017, American Chemical Society.
Changes in interfacial resistance are closely connected to battery failure. The progression of various resistance components has been tracked and linked to capacity loss [60]. As illustrated in Fig. 4c, this capacity fade is due to the poor contact with the SSEs during delithiation. High-frequency resistance remains almost unaffected by the state of charge (SOC), indicating that this resistance is related to ions transport within the bulk phase of the SSEs (RSE, bulk), which is similar to the resistance (RSE, gb) at the grain boundaries. During subsequent charging, RSE/anode returns to its initial value. Significantly, the interface resistance at the positive electrode rises considerably during the first two battery cycles, especially during the first charge, leading to a rise in RSE/cathode. The disparity in overpotential observed from impedance spectra compared to galvanostatic cycling is attributed to formation effects (Fig. 4d).
3.2 Frequency-dependent spectroscopy
At the microscopic level, researchers have proposed various models and hypotheses, as well as employed different characterization methods to directly investigate the conduction pathway of Li ions. As shown in Fig. 5, solid-state nuclear magnetic resonance (NMR) is a quantitative solid-state transport characterization technique, which has been commonly applied to research solid-state ion conduction. Zheng et al. utilized selective Li isotope labeling and solid-state NMR to investigate the conduction process of the LLZO-PEO(LiClO4) composite electrolyte system, identifying three conduction processes in the composite electrolyte through characteristic peaks: polymer internal conduction, LLZO crystal internal conduction, and interfacial conduction [61]. By fabricating symmetric cells with electrodes labeled with 6Li isotope and electrolytes, they found that the substitution of 6Li ions for 7Li ions primarily occurred in the LLZO ceramic phase during the cycling process, with Li ion migration being controlled by the LLZO phase. The characteristic resonance peak of 6Li allowed for the qualitative determination of the transport environment and the proportion of reacting ions in different channels, revealing the channel selectivity of ion conduction. When LLZO accounted for 50 wt%, lithium ions tended to be transported internally within the LLZO ceramic. Zhang et al. also investigated the influence of active nano-filler concentration on ionic conductivity and the regulation of ion transport pathways in the LLZO-PEO. As shown in Fig. 5c, when the LLZO filler content was below 20 wt%, Li+ conduction primarily occurred within the PEO polymer. However, when the LLZO content reached the critical point of 20 wt%, the LLZO particles formed a permeable network, blocking the Li+ conduction channel within the PEO and leading to a switch in the transport pathway of Li from the PEO matrix to the interconnected LLZO filler. The critical point of conduction channel switching was strongly connected to the particle size and structural parameters of the filler. Additionally, the addition of liquid tetraglyme to the composite material facilitated the rapid conduction of a significant number of lithium ions through the polymer-filler interface. These findings indicate that with an increase in LLZO content, the primary pathway for ion transport shifts from the polymer phase to the ceramic phase [62].
Figure 5
 Figure 5. Ion conduction characterization of composite electrolytes: (a) Schematic diagram of ion conduction paths in LLZO-PEO. (b) Regulation of solid-state NMR signals by cyclic processes. Reprinted with permission [61]. Copyright 2016, Wiley-VCH. (c) The regulatory mechanism of packing conduction path by qualitative analysis of solid state nuclear magnetic cores with 6Li as both prime labeling. Reprinted with permission [62]. Copyright 2019, American Chemical Society.
Characterizing ion migration in composite SSEs presents a challenging task that requires coverage of an ultra-wide frequency range. Apart from EIS, high-frequency dielectric spectroscopy (DS) (from 106 Hz to 1010 Hz) can also be utilized to determine the AC conductivity at specific frequencies, thereby characterizing the multi-scale relaxation processes within complex-phase materials by differentiating frequency ranges. Dielectric spectroscopy is a valuable method for characterizing ion conduction under external alternating electric fields. It provides insights into ion dynamics and relaxation processes. Within the frequency range of 104 Hz to 109 Hz, ss-NMR spectroscopy is effective in separating ion conduction states and kinetic processes in both the interfacial and bulk phases. By applying a magnetic field, ss-NMR can regulate anisotropic interactions between conductive ions and interfaces, offering valuable insights into ion conduction mechanisms.
The combination of EIS and blocking electrodes is generally used for characterizing the overall ion conductivity of composite SSEs. EIS covers from 10−2 Hz to 106 Hz, providing information about ion transport and interfacial processes. Within the range of 10−2 Hz to 103 Hz, chronoamperometry (CA) is a commonly used time-domain method that measures diffusion rates and other kinetic parameters. By applying a constant voltage as the excitation signal, CA offers valuable information about ion diffusion processes. Additionally, CA data can be converted to the frequency domain, allowing analysis from 10−2 Hz to 103 Hz. By employing these characterization methods across different frequency ranges, researchers can understand ion migration and conduction behavior in composite SSEs, facilitating further advancements in SSBs development.
In current research, extensive efforts have been made to analyze conduction mechanisms at different scales using the aforementioned methods. However, to achieve a comprehensive understanding of the multi-scale ion conduction mechanism in SE, it is crucial to establish connections between different scales of ion transport by combining these diverse spectroscopic techniques. Zhang et al. integrate DS, EIS, and CA methods to jointly characterize the ion conduction behavior of SSEs [63]. They developed an integrated analytical approach to study ion conduction in SE across 10−2–1010 Hz, and employed this method to investigate influence of the fluorine content (xF) and volume fraction (v) of TiO2 fillers on the ionic conductivity of SSEs. In their study, the SSEs polymer matrix consisted of polyethylene oxide (PEO) and polyvinylidene fluoride (PVDF) with TiO2 and surface-modified fluoride TiO2 (F-TiO2) nanoparticles serving as fillers, and LiTFSI was used as the lithium salt. Figs. 6a and b present the obtained key physical parameters of ion conduction, including σ, Ea, c0, and ε, through the combination of analytical methods. The dependence of these key conduction parameters on filler volume and surface structure was investigated. When the TiO2vol fraction is 10%, the total ionic conductivity reaches 3.1×10⁻⁵ S/cm, which is more than 15 times higher (Fig. 6c). Fig. 6d separates the contribution of the decrease in Ea and the increase in c0 to the improvement of ionic conductivity. Comparison reveals that the decrease in Ea contributes significantly more than the increase in charge carrier concentration (c). Marcus' theory established a linear correlation between dielectric constant and activation energy. The increased surface fluorine content of TiO2 fillers caused a reduction in the dielectric constant of the SSEs, which in turn led to a decrease in activation energy and an enhancement in interface conductivity. Additionally, an equivalent circuit model was employed to elucidate ion conduction in SSEs. The ideal v of inorganic fillers can be determined by the competition between bulk and interface conduction. These insights offer a fresh perspective on the ion conduction mechanism in solid-state Li-ion composite electrolytes.
Figure 6
 Figure 6. (a) Schematic diagram of the combination of CA, EIS, and DS method. (b) Relationships of parameters obtained from CA, EIS, and DS method. (c) The σ of PEO-TiO2 SSEs with different v and xF of TiO2 fillers. (d) The normalized enhancement factor of c and Ea to σ. Reprinted with permission [63]. Copyright 2022, Wiley-VCH.
Such multiscale method could be used to analyze the interface and volume effects of fillers for promoting ionic conductivity (Fig. 7) [63–65]. The volume effect of fillers pertains to filler loading, while the interface effect involves using functionalization to modify the filler surface. With increasing inorganic fillers, more highly conductive channels are obtained via the polymer/filler interface (Figs. 7a and b). To represent the overall ion conductance in composite SSEs, a straightforward series equivalent circuit model has been developed (Fig. 7d), which can be written as:
(8) where σ0 is ionic conductivity of neat polymer electrolyte, w is the normalized factor, η is the volume fraction of interface, σI and σB are the ionic conductivity of interface and bulk phases, respectively, α and β are the Bruggeman correlation. Subsequently, the conducting competition mechanism between bulk and interface phases of polymer matrix could be also demonstrated by a volcano plots (Fig. 7c). A dimensionless variable, k, has been calculated to demonstrate the optimal volume fraction of inorganic fillers, which helps to better understand the competition between bulk and interface conduction, as detailed below:
(9) where a, b, and l are radius of inorganic filler, respectively. Furthermore, the volume fraction is denoted as v = (a/b)2. The thickness of interface layer could be acquired by Debye length
(10) where γ is the ratio of interface thickness and filler radius (γ = l/a). For the case of the variable ~1, the corresponding v is linked with the optimal volume fraction of the composite SSEs, which would present the maximum total ion conductivity. As a result, the interface phase occupies the maximum volume fraction:
(11) Figure 7
 Figure 7. The schematic diagram of volume and interfacial effects of P-TiO2 (a) and P-F-TiO2 (b) filler. (c) The conductance volcano plots of P-TiO2 and P-F-TiO2. (d) Series equivalent circuit model and ions transportation model. (e) The relationships between σtotal and υ. (f) The relationships of k and υ. Reprinted with permission [63]. Copyright 2022, Wiley-VCH.
The optimal volume fraction of filler voptimal is closely related to γ. Moreover, the optimal volume fraction could be also used as the critical value in other types of composite SSEs. Such physical scenario has highlighted a platform to optimize filler fraction and ion conductivity with consideration of interfaces and bulk electrolytes.
3.3 2D morphological imaging methods
The issue of lithium dendrites has long hindered the development of LIBs. Previous research has identified that the lithium dendrites will grow at grain boundaries within SSEs, while the exact function of the boundaries in the nucleation and branching of metallic lithium remains ambiguous [66]. Zhu et al. conducted a comprehensive investigation into the mechanism of lithium dendrite formation and evolution using operando Kelvin probe force microscopy (KPFM), which was used to test surface potential changes and lithium-ion transport in a garnet-type SSEs, specifically LLZO [67]. In their study, a potential of 300 mV was applied to symmetric cells, and KPFM were taken at various positions on the LLZO surface (Fig. 8). The results showed that the reduction in Galvani potential occurred exclusively at grain boundaries close to the sites of deposited lithium. Consequently, grain boundaries did not exhibit distinct ion transfer characteristics. In LIBs, the distribution of surface potential within SSEs is influenced by various factors, including Li-ion concentration, temperature, and voltage. These factors affect the Li-ion transport process, further influencing the formation and evolution of lithium dendrites [68,69]. KPFM, as an effective characterization method, enables researchers to gain a deeper understanding of solid-state interface reactions and Li-ions transport processes in LIBs.
Figure 8
 Figure 8. (a) Schematic diagram of KPFM measurement on the LLZO surface. (b) The factor k calculated at different positions on LLZO surfaces. (c-e) Schematic diagram, topography and CPD maps of the site of the KPFM measurement. (f, g) Averaged line profiles of the topography and CPD at different KPFM measure positions. Reprinted with permission [67]. Copyright 2024, Elsevier.
In terms of in-situ observation, Li et al. utilized transmission electron microscopy (TEM) to investigate the space charge region (approximately 3 nm) at the interface between the gallium and LLZO/PEO electrolyte [62]. The conduction model proposed that the improvement in ion conductivity could be attributed to ion conduction within the space charge region and its permeation. Nomura et al. employed in-situ electron microscopy to observe the Li-ion space charge region at the interface, characterized by a few nanometers in width, and also examined its impact on Li-ion transport behavior. They used LLZO as both the SSEs and electrode, and employed electron energy loss spectroscopy (EELS) technique to observe the space charge region within an energy window in TEM and STEM measurement [70]. Fig. 9a shows the sample structure for phase-shift holography and EELS. Two Cu films with 250 nm thickness were deposited on an LASGTP wafer, with one side thinned by focused ion beam milling for TEM observation. The surface for TEM observation was then coated with a 20 nm amorphous Al2O3 insulating film. A 10 nm conductive carbon film was deposited on the Al2O3 layer and grounded. The Al2O3 and carbon films are not visible due to their thin and amorphous nature (Fig. 9b). The Li-ion conducting phase (the dark gray region) and the AlPO4 grain (the light gray area) in LASGTP can be observed. Moreover, the electron interferogram (hologram) was captured in the cross-sectional of the Cu/LASGTP interface (Fig. 9c). Typical holograms around the interface are displayed in Fig. 9d, with interference fringes in LASGTP bending near the interface, as marked by the white dashed line. Fig. 9e shows phase images acquired using the phase-shift method, where different colors represent the phase values. Further experimental evidence indicated that this space charge region induced a local potential offset near the electrode/SSEs interface and influenced Li-ions motion in the vicinity of the interface. This study reveals the potential formation of a space charge region at the electrode/SSEs contact, which impacts ion transport behavior and provides important insights for optimizing SSEs design, thereby promoting the research of SSBs.
Figure 9
 Figure 9. (a) The sample configuration of the Cu/LASGTP interface for measurement. (b) The TEM image of Cu/LASGTP interface. (c-e) TEM image, the holograms, and the phase map at the Cu/LASGTP interface. Reprinted with permission [70]. Copyright 2019, Wiley-VCH.
The conduction model suggests that the improvement in ion conductivity is due to ion conduction and penetration within the space charge region. However, existing characterization methods typically concentrate on a single scale and can effectively characterize the ion transport mechanism either at the micro or macro scale. To better understand multi-scale transport models and establish connections between different scales, it becomes essential to combine various single-scale characterization methods.
3.4 3D morphological imaging methods
The neutrons can interact with the 6Li isotope, generating 4He and 3H with precise energy, which can be used to determine the location and quantity of lithium [71]. The neutron depth profiling (NDP) can offers valuable insights into density and the approximate porosity of electrochemically deposited lithium. The neutron depth profiles results suggest that the highly porous lithium extend into the electrolyte interior (Fig. 10a). In addition, the plating potential can highly affect the deposition of lithium on the copper current collector (Fig. 10b).
Figure 10
 Figure 10. (a) Schematic diagram of operando NDP measurement and results. (b) Total amount of lithium mass and the plating potential. Reprinted with permission [71]. Copyright 2018, Springer Nature. (c) The cell structures for the NDP measurement. The integrated NDP count curve, charge curve and the corresponding voltage profile of the asymmetric cell (d) and symmetric cell (e) during cycling. Reprinted with permission [72]. Copyright 2017, American Chemical Society.
Operando NDP has been employed to track lithium plating and stripping, as well as to identify short circuits in Li batteries. Fig. 10c presents a kind of in situ NDP configuration for Li-based SSBs [72]. This battery sample is placed inside a vacuum chamber and on a temperature-controlled aluminum, and the neutron beam interacts with the sample to produce ³H which are detected by a Si detector. Two distinct cell configurations were assembled and studied, one is a Li symmetric cells with a garnet-type SSEs and two Li metal electrodes, another is a Li asymmetric cells with Li-free electrodes and Li metal electrode. In symmetric cells, lithium metal was melted onto both sides of the garnet SSE with a titanium strip acting as current collector during the process. For asymmetric cells, the Li-free electrodes was a carbon nanotube (CNT) film, which was applied to the garnet SSEs pellet. Moreover, a Kapton film was used to block alpha particles, enhancing the depth resolution during the NDP testing. In the initial stripping cycle, over half of the plated lithium could not be stripped reversibly, which is corroborated by the rising voltage of 0.1 V. Meanwhile, the NDP signal also changed based on the current direction during cycling (Fig. 10d). As the current intensity increased, the wide of the NDP peaks extended into the interior (Fig. 10e), suggesting that lithium builds up at the interface and gradually moves into the garnet interior [72].
Figs. 11a-c show the visualized results of Na dendrites in NASICON-type electrolytes, which were obtained by integrating time-of-flight secondary ion mass spectrometry mapping (TOF-SIMS), X-ray photoemission spectroscopy (XPS), and time-resolved EIS [73]. The NASICON electrolytes are chemically unstable contacting with Na metal, and the diffusion-controlled interfacial reactions will occur. Na-based SSEs, though typically regarded as stable with Na metal, actually react with Na metals to some extent, resulting in a considerable rise in interfacial impedance. The Na symmetric cells showed the polarization increases gradually on cycling. No significant changes are observed in both the SSE and interfacial charge transfer resistance before and after cycling, while the interphase resistance increases nearly threefold, likely due to its gradual thickening. Therefore, the interfacial reactions are mainly caused by the electrochemical reduction of NZSP. As a result, the growing voltage polarization aligns with the formation of a thicker interphase layer during cycling (Fig. 11c).
Figure 11
 Figure 11. (a) Nyquist plot, bode plot, impedance spectra, and total resistance of Na-NZSP-Na symmetric cells over aging time. (b) 2D TOF-SIMS elemental maps of NZSP-Na interface. (c) 3D TOF-SIMS elemental maps of NZSP. Reprinted with permission [73]. Copyright 2018, American Chemical Society. (d) 3D TOF-SIMS elemental maps of the LiCoO2/LLZO interface. Reprinted with permission [74]. Copyright 2016, American Chemical Society.
The three-dimensional elemental maps generated by combining these techniques can reveal elements and phase transitions. For example, TOF-SIMS was used to analyze the failure behavior of LLZO electrolyte in air (Fig. 11d) [74]. Freshly prepared LLZO exhibits uniform distributions of Al and La element. In contrast, after storing for one year in air, the surface concentration of Al element decreases, while La element forms a pronounced concentration gradient. Al diffusion is substantial, extending beyond the interface area to the opposite end of the LiCoO2 layer. Al atoms occupy the Li sites in LLZO, stabilizing the cubic phase. As Al leaches out of LLZO and diffuses into LiCoO2, the cubic LLZO at the interfaces transforms into the tetragonal phase.
The X-ray nano-computed-tomography (CT) technique can be used to study the structural evolution of solid-state composite positive electrodes during the process (Figs. 12a-h), analyzing the effects of electrochemical behavior on ion transport in SSEs [75]. The observation shows that ion intercalation/deintercalation first occurs in the particles of positive electrode near the SSEs layer. Under concentration polarization, active ions efficiently diffuse into SSEs particles and move smoothly between the positive electrode and SSE electrolyte, due to the formation of a stable electrolyte/electrode interface. This stability is further confirmed by similar EIS results of the SSBs at different SOCs, explaining the small voltage drop of the battery (Figs. 12i and j).
Figure 12
 Figure 12. (a) Schematic diagram of the X-ray CT measurement and data analysis. (b) Reconstructed structure of the positive electrode at varying SOCs. (c) Diagram of the positive electrode reconstructed structure. (d) The volume ratio of positive electrode particles and pore. (e, f) The volume distribution of positive electrode particles and pores. (g, h) The volume ratio of positive electrode particles and pores at various position. (i) DRT results at various electrode SOCs. (j) Self-discharge behaviors of the SSBs. Reprinted with permission [75]. Copyright 2022, Wiley-VCH.
3.5 Multiscale morphological imaging methods
In order to understand the mechanisms of ion transport and interfacial reactions in SSEs, researchers often employ a combination of advanced characterization techniques across various scales to observe their evolution during electrochemical cycle. For instance, Patrice Perrenot et al. studied homemade amorphous 75% Li2S–25% P2S5 (Li3PS4) to know the effect of pressure and sintering time at room temperature (Figs. 13a-h). They used a geodesic distance map to show how pores influence dendrite formation and Li metal movement in the SSE during cell assembly. Surprisingly, this result indicates that sintered SSE with porosity of 3.5 vol% could still allow dendrite propagation if pressure is applied for a short duration. However, the porosity to rearrange and close when the SSE is sintered for a longer period [76].
Figure 13
 Figure 13. (a–h) 3D map of Li/LPS interface under various pressure and time condition. Reprinted with permission [76]. Copyright 2024, Wiley-VCH. (i) SEM image and EDS mapping of LLZTO-KF. (j, k) 3D and 2D view of element distribution. Reprinted with permission [77]. Copyright 2024, Springer Nature. (l–o) TEM and TOF-SIMS maps of LiF-rich SEI. Reprinted with permission [78]. Copyright 2023, Wiley-VCH.
Zhang et al. proposed enhancing the interface stability between the Li6.4La3Zr1.4Ta0.6O12 (LLZTO) and electrode by depositing a KF thin film on the surface. The SEM image and EDS mapping show the KF modifying layer and smooth surface (Fig. 13i) [77]. The TOF-SIMS clearly shows the variation of the K−, KF2−, TaO2− and ZrO2− signals, suggesting the smooth deposition of the KF layer (Figs. 13j and k). Similarly, Pang et al. constructed an IL-confined MOF/Polymer 3D-porous membrane for the electrochemical transformations of LiF/Li3N-rich SEI films on the nanofibers. The results show that TFSI- anions move freely without the IL confined by ZIF, leading to the formation of LiF on the surface of Li negative electrode. In the PAN/IL cell, the decomposition of TFSI- in the gap between the Li negative electrode and separator results in a thicker SEI layer, obstructing diffusion channels and impeding Li-ions migration. The incorporation of a 3D-Janus SEI into the separator provides fast Li-ions transport pathways (Figs. 13l-o) [78].
4. Designing hierarchical fillers for composite SSEs with fast ionic transport abilities
In SSBs, rapid ion transport at interfaces is critical especially for nanomaterials system due to the more interfaces. Apparently, the grain boundaries will play a crucial role in ion migration. Molecular dynamics simulations on a large scale have demonstrated that the Ea for ions migration in grain boundary is higher than that within the lattice in anti-perovskite structures. Deformation of the lattice near grain boundaries and interfaces creates additional pathways for interface charge transport. EIS results revealed that the conductivity of grain boundaries in materials, such as LLTO and LISICON, contributes significantly to the overall ionic conductivity, accounting for approximately 40%–50% of the total impedance. While the Ea for charge transfer along a single grain boundary in LLZO is similar to that through the entire grain, the reduced grain boundary resistance results in improved transport performance. Consequently, air-sintered LLZO exhibits higher conductivity than argon-sintered LLZO [79].
At non-uniform interfaces, free ions will redistribute according to varying chemical potentials when two materials come into contact, forming a space charge layer. The space charge layer and the potential distribution can be studied through calculation and simulation methods. These findings can be verified by combining techniques [80]. The space charge layer generates an ultra-large electrochemical potential gradient, which provides a fast ion transport pathway at the interfaces.
The fillers will significantly affect the ionic conductivity of composite SSEs, which is a common method to facilitate ion conduction at interfaces. Polymer electrolytes containing polar atoms often crystallize at room temperature, resulting in slow ion diffusion. The ionic conductivity of polymeric SSEs is closely associated with the amorphous regions. Constructing composite electrolytes can enhance the presence of highly conductive interfaces, and establishing continuous interface channels represents an effective approach for preparing composite electrolytes with high ionic conductivity [81].
Incorporating inorganic fillers into polymer electrolytes significantly enhances conductivity. The addition of certain plasma-conductive fillers, such as LLZO, effectively enhances the room temperature conductivity of polymers while reducing the activation energy. This addresses the challenge of high activation energy barriers observed in the transport behavior of pure polymers at both low and high temperatures. Computational calculations have demonstrated the correlation between the ceramic/polymer interface and ionic conductivity, and results have validated the applicability of this theory in composite electrolytes [82].
Nevertheless, there are instances that contradict this theory, as evidenced by the experimental findings of the Duward group, where the introduction of fillers showed minimal effect on ion transport [83]. Molecular spectroscopy results also indicate that the addition of inert oxide fillers does not significantly impact the dissociation degree of lithium salt within the polymer. It should be noted that excessively high filler content can lead to conductivity suppression. Composite SSEs, characterized by the presence of phase-phase interfaces, exhibit unique properties that pure polymer electrolytes lack. Nevertheless, their operating mechanism remains unclear, and the ongoing debate regarding transport mechanisms is a gradual process. Analyzing the filler-enhanced mechanism for achieving high ionic conductivity in composite electrolytes is essential for designing high-performance systems.
4.1 Zero-dimensional nanofillers for composite SSEs
The size of fillers is a crucial element in determining the conduction behavior of composite SSEs. Large filler sizes can obstruct ion conduction channels and reduce ion transport rates, especially when high proportions of non-ionic conductive fillers are used, resulting in significant suppression effects. Quantum dots, as zero-dimensional (0D) nanomaterials with particle diameters below 10 nm, offer promising potential as fillers for mixed electrolytes [84].
In 2018, Wei et al. introduced carbon quantum dots (CQDs) as fillers in polymer SSEs. Microstructural analysis revealed that the aldol condensation reaction-derived CQDs had diameters of only 2–3 nm [85]. The addition of CQDs to pure PEO films resulted in a darker color in the composite electrolyte film. The PEO-CQD electrolytes show favorable mechanical properties and a Li-ions conductivity of 1.39×10⁻⁴ S/cm after incorporating CQDs. Mechanism analysis indicated that the CQDs can reduce the crystallinity of PEO and enhance the dissociation of lithium salt, facilitating the rapid transport of lithium ions (Figs. 14a-e).
Figure 14
 Figure 14. Design of zero-dimensional fillers in composite electrolytes: (a) TEM and optical photographs of carbon quantum dots (CQDs). (b) Photographs of different types of CQD electrolytes. (c, d) Bending and stretching tests of CQD electrolytes. (e) Schematic of the effect of CQDs on ion transport. Reprinted with permission [85]. Copyright 2018, Wiley-VCH. (f) Schematic diagram of ion transport in polyethylene glycol fatty acid ester (PEG) grafted polymer quantum dot composite electrolyte. Reprinted with permission [86]. Copyright 2022, Elsevier.
In 2021, Kou et al. employed PPQDs to improve Li-ions migration. PPQDs with abundant active sites can reduce the crystallinity of PEO and facilitate the dissociation of lithium salt (Fig. 14f) [86]. Despite the potential of quantum dots as multi-component materials, their application in composite electrolytes remains relatively unexplored, leaving ample room for further investigation. Apart from CQDs, the effects of quantum dots derived from common non-conductive inorganic fillers like Al2O3 [87], TiO2 [88], SiO2 [89], and ZrO2 [90] on electrolyte transport properties have been extensively studied. For instance, the addition of nano-TiO2 to a PEO matrix resulted in an ion conductivity with 1.4×10⁻⁴ S/cm, which was one order of magnitude higher than that of a PEO/TiO2/LiClO4 electrolyte [91].
In addition to electronic conductive and insulating materials, ceramic particles with fast ion conduction properties are also utilized as 0D fillers. The inclusion of ceramic fillers disrupts the crystalline phase of the polymer and reduces the crystallinity. The introduction of nano-sized ceramic fillers in composite electrolytes results in higher ion conductivity compared to micro-sized polymer electrolytes, owing to the penetration effect. Scrosati et al. proposed that nano-ceramic fillers affect the structural rearrangement of polymer electrodes and improve the structural stability of polymer electrolytes [92].
LLZTO nanoparticles, a well-known ion-conducting ceramic, have been employed as fillers in polymer composite electrolytes. LLZTO nanoparticles of different sizes were used, resulting in corresponding ion conductivities [93]. The size of the ceramic fillers has a notable influence on the conduction behavior of composite electrolytes. Nano-sized LLZTO fillers exhibit better dispersibility than their micro-sized counterparts, forming a continuous interfacial conduction network with a larger surface area. Consequently, the nano-filled composite electrolyte demonstrates higher ion conductivity. Considering the impact of filler particle size on the permeation effect of composite electrolytes, careful selection of the size of inorganic electrolytes is crucial for effective performance enhancement.
4.2 One-dimensional nanofillers for composite SSEs
The incorporation of one-dimensional (1D) nanowires into polymer electrolytes allows for the creation of a continuous interface comprising highly conductive phases. This approach has been widely employed to improving the transport of lithium ions and is commonly used as a filler in mixed SSEs.
Zhang et al. conducted a study in which ion-conductive composite SSEs were prepared using vertically aligned anodic aluminum oxide (AAO) as the filler material [94]. Fig. 15 illustrates the mechanism through which 1D nanowires improve the ion transport properties of composite electrolytes compared to 0D nanoparticles as fillers. For composite electrolytes containing nanoparticle fillers, the ion transport path is discontinuous. However, with the dispersion of 1D nanowires, a bridging effect is achieved, connecting the conductive interfaces and enhancing the ion conductivity. The AAO fillers, through directional regulation, provide through-filling/polymer interface conduction channels, thereby greatly enhancing the rate of ion transport. Professor Yi Cui and his colleagues visually demonstrated this mechanism and obtained conductive channels. Consequently, the composite electrolyte achieved an overall ion conductivity [94,95].
Figure 15
 Figure 15. Design of one-dimensional packing of composite electrolyte: (a) Schematic diagram of the transport channel of Li+ in different structural fillers. (b) Macro/microscopic characterization and schematic of PI packing electrolytes. Reprinted with permission [96]. Copyright 2019, Springer Nature. (c) Internal Li+ transport mechanism of Mg2B2O5 nanowire packing composite electrolyte. Reprinted with permission [94]. Copyright 2018, American Chemical Society.
In Fig. 15b, the incorporation of polyimide (PI) into vertically aligned poly (ethylene oxide) (PEO) enables the construction of composite electrolytes with connected conductive channels [96]. The presence of PI in the vertical nanochannels forms a continuous channel that facilitates rapid ion transport and increases the Young's modulus of the electrolyte. This enhancement in mechanical properties helps prevent the growth of lithium dendrites. The PI resulted in an increase in ion conductivity from 5.4×10⁻⁵ S/cm to 2.3×10⁻⁴ S/cm in the composite SSEs. Furthermore, compared to pure PEO polymer electrolytes, the outer surface of the nanochannels in the PEO/PI/LiTFSI composite electrolyte with 200 nm diameter nanochannels exhibited a distribution of crystals, indicating that the nanochannels also affect the crystallinity of PEO. Simulation analysis revealed that the migration rate of lithium ions along the z-axis of the composite electrolyte in the nanochannels is remarkably higher than that in the x and y directions. This observation is consistent with the measured conductivity results and confirms the role of 1D nanowire interfaces in promoting ion conduction. Sheng et al. identified the rapid transport of Li+ at the interface of Mg2B2O5 and PEO as a key factor in improving ion conductivity (Fig. 15c) [97]. Additionally, Chen et al. observed similar interactions on Ca-CeO2 nanotubes, where the nanotubes surface can adsorb TFSI- anionic groups to promote the dissociation of LiTFSI salt into Li+ [98]. Liu et al. executed a study comparing the ion transport behavior of LLZTO nanoparticles, random nanowires, and aligned nanowires [99]. Based on SEM characterization, they found that the composite electrolyte exhibited maximum ion conductivity when the nanowires were aligned. This alignment resulted in high Li+ conductivity at the interface, with non-crossing paths. At 30 ℃, the composite SSEs with aligned LLZTO nanowires achieved a ten-fold increase in ion conductivity of 6.05×10⁻⁵ S/cm. The Ea value for ion conduction also decreased, indicating that the aligned nanowires provided a rapid ion transport pathway.
Zhao et al. utilized aligned Li6.4La3Zr2Al0.2O12 (LLZO) nanofibers as modified fillers in a composite electrolyte with PVDF polymer electrolyte as the filling material [100]. They employed the sol-gel method and electrospinning to obtain 245 nm ordered LLZO nanofibers. The LLZO nanofibers were then mixed with PVDF nanofibers to form the composite electrolyte. In comparison to the unfilled PVDF/LiClO4 electrolyte, the electrolyte with aligned ceramic nanofibers exhibited enhanced thermal stability and mechanical properties. The Young's modulus along the direction of the aligned nanofibers was measured at 1.8 MPa, and the ion conductivity reached 0.12×10 mS/cm at 30 ℃. The composite electrolyte was further tested in an NCA ternary cathode assembled with a Li battery, demonstrating 200 mAh/g and cycling stability. Similarly, Li1+xAlxTi2-x(PO4)3 exhibited enhanced transport characteristics.
4.3 Two-dimensional nanofillers for composite SSEs
While two-dimensional nanofillers may have limitations in terms of thermal stability and electronic conductivity, their large specific surface area and high aspect ratio provide advantages in promoting ion transport when combined with a polymer matrix [100,101]. Graphene oxide (GO), as a representative two-dimensional material, has been successfully used as a filler in PEO-based composite electrolytes by Professor Haleh, resulting in a nearly two orders of magnitude increase of ion conductivity and improved mechanical strength [102]. Solid-state graphite/LiCoO2 batteries fabricated using this composite electrolyte demonstrated good cycling stability. However, the electrochemical instability and high electronic conductivity of graphene oxide hinder its broader application.
Vermiculite (VS) has been identified as a suitable filler for composite electrolytes, with a thickness of about 1.5 nm to improve performance [103]. This electrolyte exhibited 0.12×10 mS/cm, and the LIBs assembled with this electrolyte showed stable cycling for over 60 days, benefiting from the electronegativity of the VS surface that enhanced ion interface transport (Fig. 16a). Rojaee used black phosphorus (BP) as an additive, where the surface of BP adsorbed TFSI− anionic groups, reducing the binding force between Li+ and N and improving ion conductivity [104]. Layered double hydroxide (LDH), another two-dimensional material with a nanosheet morphology, was employed by Xia et al. to enhance Li+ migration rates in PVDF-HFP polymer electrolytes [105].
Figure 16
 Figure 16. Design of two-dimensional packing for composite electrolyte: (a) Schematic diagram of the synthesis arrangement process and ion conduction mechanism of VS filler. Reprinted with permission [98]. Copyright 2020, Wiley-VCH. (b) Schematic diagram of monolayer double hydroxide nanosheet-enhanced PVDF-HFP composite polymer electrolyte. Reprinted with permission [100]. Copyright 2019, Springer Nature.
Fig. 16a demonstrates how black phosphorus (BP) captures TFSI− groups to increase the presence of Li+ ions and improve ion conductivity. MXene, as a newcomer among 2D materials, has also been considered for applications in composite electrolytes [106]. However, the high electronic conductivity of MXene poses a limitation, necessitating modification studies. Shi et al. proposed a novel approach to modify MXene nanosheets with mesoporous silica (MXene-mSiO2) to reduce the electronic conductivity of MXene nanosheets [107]. The modified nanosheets can then be incorporated into composite electrolytes, significantly enhancing the mechanical properties of the composite. Typically, 2D fillers are randomly distributed in the polymer matrix, but exploring ordered 2D fillers that regulate the entire system holds greater research value. Ordered 2D materials with continuous conduction pathways exhibit superior effects on overall ion transport compared to disordered 2D materials. Based on this understanding, Luo et al. developed vertically arranged vermiculite sheets (VAVS) to investigate their transport control mechanism in composite electrolytes [108]. VAVS was prepared, and SEM images clearly depicted the vertically ordered arrangement of VAVS. Comparatively, under the same conditions, PEO composite electrolytes with vertically ordered VAVS as fillers displayed higher ion conductivity than those with disordered vermiculite (VS) fillers. Continuous conduction pathways were essential in enhancing ion transport. Fig. 16b shows the use of GO nanosheets as templates for the synthesis of 2D Li6.5La3Zr1.5Nb0.5O12 by Hu et al. [109]. They grew a garnet precursor layer on the surface of GO, followed by the removal of the GO template to obtain garnet nanosheets. These garnet nanosheets create a continuous Li-ions transport pathway at the interface, resulting in an increased ion conductivity of 0.36 mS/cm.
4.4 Three-dimensional nanofillers for composite SSEs
The incorporation of three-dimensional (3D) skeletons as fillers in polymer electrolyte systems addresses the challenges of filler uniformity and mechanical strength in composite electrolyte membranes. The use of 3D skeletons creates additional interfaces for ion transport pathways, thereby enhancing the performance of SSEs [110,111]. Cellulose, a polymer support structure found in non-woven fabrics, was initially utilized by Zhang et al. to develop a stable, high ion conductivity, high voltage, and safe-enhanced composite polymer electrolyte when combined with propylene carbonate (PPC) polymer [112]. SEM images revealed the freely arranged nanofibers of the non-woven fabric with large pores. Following the addition of the PPC polymer electrolyte, the composite electrolyte's surface appeared smooth, indicating the successful construction of a continuous structure supported by cellulose non-woven fabric. In comparison to pure PEO polymer electrolyte, the cellulose-PEO composite electrolyte exhibited a significant improvement in ion conductivity under the same conditions. The excellent dynamic performance was verified using electrochemical impedance spectroscopy, and the solid-state soft-packaged battery demonstrated good cycling stability. Lin et al. employed 3D SiO2 aerogel as the filler to provide a mechanically robust skeleton and create a continuous interfacial conduction network in the polymer electrolyte, capable of absorbing anions and facilitating Li-ions transport [113]. The composite polymer electrolyte reached an ion conductivity of 1 mS/cm at 40 ℃, approaching the transport performance of traditional electrolytes at the same temperature. The enhanced suppression of lithium dendrite formation was confirmed through lithium symmetry experiments, with the SiO2 aerogel-enhanced composite polymer electrolyte exhibiting an extended cycle life compared to the electrolyte without SiO2 aerogel, which led to a short circuit in a shorter duration.
The conductive ceramic fillers offer a chance to generate additional ion transport pathways and enhance the ion conductivity of SSEs. Professor Hu's group utilized electrospinning technology to produce a PEO-based composite SSEs filled with 3D Li6.4La3Zr2Al0.2O12 (LLZO) fillers, resulting in a randomly distributed ceramic nanowire network that formed an interfacial ion conduction network with multiple conduction paths [114].
The 3D LLZO ceramic skeleton improved the thermal stability, enhanced ion conductivity, and suppressed the lithium dendrites, making it a high-performance filler within the PEO matrix. Template synthesis, a classic design method, has also been employed for the 3D nano-filler structure design of LLZO. Xie et al. utilized BC as a template to fabricate 3D LLZO nano-fillers (Fig. 17a). The 3D LLZO greatly enhanced the ion conductivity of the composite SSEs by creating a fast ion transport pathway for the electrolyte and enabling rapid Li-ions conduction within its lattice [115].
Figure 17
 Figure 17. Design of 3D conductive filler for composite electrolyte: (a) Schematic diagram of the preparation process of a composite SSEs. Reprinted with permission [115]. Copyright 2018, Wiley. (b) Geometric structure construction process of 3D LLTO/PEO composite electrolyte filler. Reprinted with permission [117]. Copyright 2018, Wiley-VCH. (c) Schematic diagram of the 3D structure LAGP/polymer composite electrolyte formation process. Reprinted with permission [118]. Copyright 2018, The Royal Society of Chemistry.
In terms of mechanical properties, Hu et al. adopted a reverse approach by using a porous PI film to prepare an electrolyte [116]. The porous PI film consists of interconnected fibers, creating numerous large pores. The 3D porous structure fully permeates the polymer electrolyte, forming a continuous pathway for Li+ transport, which is reflected in the enhancement of ion conductivity (Fig. 17b). SEM images demonstrate that the PI/PVDF/Li0.35La0.55TiO3 (LLTO) composite electrolyte exhibits a smooth lithium metal surface with fewer lithium dendrites, further highlighting the crucial role of PI in the system. Results from Li symmetrical cell tests indicate that the porous PI film can increase the mechanical strength and improve the compatibility between the composite SSEs and the Li electrode. The PEO polymer coating on the LLZO fiber can also serve as a protective layer to enhance the mechanical elasticity of the structure. The flexible test of the composite electrolyte soft pack battery demonstrates stable electrochemical impedance. Yu et al. employed a crosslinking agent to prepare 3D LLTO nano-fillers, obtaining a composite SSE with ion conductivity of 8.8×10⁻⁵ S/cm, whereas the pure PEO polymer electrolyte was only 2.2×10⁻⁶ S/cm [117]. Except from electrospinning and template methods, 3D printing technology represents an advanced approach for structural design. Zekoll et al. utilized 3D printing technology to fabricate LAGP (Fig. 17c) with various 3D structures [118]. These structures were then combined with polypropylene or polyethylene oxide to produce high-performance composite electrolytes. Four types of 3D printing structures were designed: cube, gyroid, diamond, and Bijel-derived structure, each affecting the physical, chemical, and electrochemical properties due to their distinct structures. Among the four composite electrolytes, the gyroid structure composite electrolyte exhibited the highest conductivity. Additionally, the composite electrolyte demonstrated excellent mechanical properties, with a strength five times higher than that of LATP nanoparticles.
5. Conclusion and outlook
In order to meet the commercial demand for solid-state energy storage technology, it is necessary to develop SSEs with both high ion conductivity and stable mechanical properties. This review offers a comprehensive introduction and summary of the ion transport principles in the SSEs and characterization methods, and briefly discusses the energy storage applications of solid-state composite electrolytes. Numerous studies have indicated that the geometric structure and interface design of nanofillers can significantly enhance the conductivity. However, the fundamental mechanism for substantially enhancing the ion transport via complex fillers is not yet fully understood, owing to the presence of multiscale effects induced with various fillers. Therefore, the optimization strategy for fillers in composite electrolytes remains unclear. There is a lack of effective multi-scale solid-state ion transport characterization and analysis methods that can quantitatively clarify the key factors contributing to the improvement of ion conductivity in the composite electrolytes.
Despite the significant progress made in designing high-performance composite electrolytes in recent years, there are still some limitations to address to achieve fast ion transport behavior competitive to the traditional liquid electrolytes. In the characterization and understanding of ionic transport behaviors in the SSEs, multi-scale analysis methods play a crucial role. These methods allow for the study of material performance changes at various scales, ranging from microscope to macroscope. Therefore, the dominating factors that are responsible for manipulating ionic transport at different scales would be clarified, which enables effective optimization of the design and preparation of SSEs. Specifically, solid-state ion transport behaviors in the composite electrolytes with different dimensional fillers are more complex. However, the current characterization methods for solid-state ion transport are lack of the abilities to establish multi-scale connections based on complicated transport phenomena. Therefore, developing a comprehensive characterization method that experimentally covers multiple scales is essential to analyze the multi-scale ion transport mechanism of composite electrolytes.
Meanwhile, the design of the interface conduction channel in complex composite electrolytes plays a crucial role in enhancing ion conductivity. Current design strategies focus on establishing connected interface conduction channels. However, the ion conductivity of composite SSEs is strongly influenced by the geometric structure parameters, conductivity characteristics, and interface chemical structure of the fillers. As a result, the fundamental physical mechanisms behind the enhancement effects of interface conduction remain unclear. It is highly urgent to develop combined methods based on multiple technologies, aiming at bridging the gap using separate single technology to characterizing the ion transport at a specific scale. Thereby, the conduction enhancement mechanism from microscopic filler-matrix interfaces to macroscopic bulk composite electrolytes would be understood in a multiscale view. As a consequence, a model that is able to explain the filler regulation of ion transport in the composite SSEs would be established. Also, such models upon balancing the dielectric loss and actual energy storage would provide valuable insights for guiding high-performance SSBs.
Declaration of competing interest
The authors declare that they have no known competing financial interests that could have appeared to influence the work reported in this paper.
CRediT authorship contribution statement
Shanyan Huang: Writing – original draft, Investigation, Data curation. Shijie Li: Methodology, Data curation. Zheng Huang: Writing – original draft, Methodology, Formal analysis. Kailun Zhang: Methodology. Wei-Li Song: Writing – review & editing, Methodology. Shuqiang Jiao: Writing – review & editing, Supervision, Project administration, Funding acquisition, Conceptualization.
Acknowledgment
This work was supported by National Natural Science Foundation of China (No. 51725401).
-
-
[1]
M. Armand, J.M. Tarascon, Nature 451 (2008) 652. doi: 10.1038/451652a
-
[2]
J.M. Tarascon, M. Armand, Nature 414 (2001) 359. doi: 10.1038/35104644
-
[3]
P. Poizot, S. Laruelle, S. Grugeon, L. Dupont, J.M. Tarascon, Nature 407 (2000) 496. doi: 10.1038/35035045
-
[4]
L. Lu, X. Han, J. Li, J. Hua, M. Ouyang, J. Power Sources 226 (2013) 272. doi: 10.1016/j.jpowsour.2012.10.060
-
[5]
J.W. Choi, D. Aurbach, Nat. Rev. Mater. 1 (2016) 16013. doi: 10.1038/natrevmats.2016.13
-
[6]
F.X. Wu, J. Maier, Y. Yu, Chem. Soc. Rev. 49 (2020) 1569. doi: 10.1039/C7CS00863E
-
[7]
Y.S. Hu, Nat. Energy 1 (2016) 16042. doi: 10.1038/nenergy.2016.42
-
[8]
Y.G. Lee, S. Fujiki, C. Jung, et al., Nat. Energy 5 (2020) 299. doi: 10.1038/s41560-020-0575-z
-
[9]
Q. Zhao, S. Stalin, C.Z. Zhao, L.A. Archer, Nat. Rev. Mater. 5 (2020) 229. doi: 10.1038/s41578-019-0165-5
-
[10]
H. Xu, Y. Su, C. Zheng, et al., Chin. Chem. Lett. 35 (2024) 109173. doi: 10.1016/j.cclet.2023.109173
-
[11]
C. Wei, R. Wang, Z. Wu, et al., Chin. Chem. Lett. 35 (2024) 108717. doi: 10.1016/j.cclet.2023.108717
-
[12]
J. Al-Khalili, Philos. T. R. Soc. A 373 (2015) 20140208. doi: 10.1098/rsta.2014.0208
-
[13]
K. Lehovec, J. Broder, J. Electrochem. Soc. 101 (1954) 208. doi: 10.1149/1.2781232
-
[14]
A. Sator, Comp. Rend. Hebdom. 234 (1952) 2283.
-
[15]
C.C. Liang, In applied solid state science, Elsevier, Wolfe, 1974, pp. 95–135.
-
[16]
A. Benrath, K. Drekopf, Z. Phys. Chem. 99 (1921) 57.
-
[17]
P. Vaillant, Comp. Rend. Hebdom. 182 (1926) 1335.
-
[18]
C.C. Liang, J. Electrochem. Soc. 117 (1970) C243.
-
[19]
C.C. Liang, P. Bro, J. Electrochem. Soc. 116 (1969) 1322. doi: 10.1149/1.2412312
-
[20]
C.C. Liang, J. Epstein, G.H. Boyle, J. Electrochem. Soc. 116 (1969) 1452. doi: 10.1149/1.2411560
-
[21]
B. Scrosati, J. Appl. Electrochem. 2 (1972) 231. doi: 10.1007/BF02354981
-
[22]
B. Knutz, S. Skaarup, Solid State Ionics 9 (1983) 371.
-
[23]
K. Kanehori, K. Matsumoto, K. Miyauchi, T. Kudo, Solid State Ionics 9 (1983) 1445.
-
[24]
D.E. Fenton, J.M. Parker, P.V. Wright, Polymer 14 (1973) 589.
-
[25]
J.E. Weston, B.C.H. Steele, Solid State Ionics 2 (1981) 347. doi: 10.1016/0167-2738(81)90038-2
-
[26]
J.B. Goodenough, H.Y.P. Hong, J.A. Kafalas, Mater. Res. Bull. 11 (1976) 203. doi: 10.1016/0025-5408(76)90077-5
-
[27]
H. Aono, E. Sugimoto, Y. Sadaaka, N. Imanaka, G.Y. Adachi, J. Electrochem. Soc. 136 (1989) 590. doi: 10.1149/1.2096693
-
[28]
H. Aono, E. Sugimoto, Y. Sadaaka, N. Imanaka, G.Y. Adachi, J. Electrochem. Soc. 137 (1990) 1023. doi: 10.1149/1.2086597
-
[29]
Y. Inaguma, C. Liquan, M. Itoh, et al., Solid State Commun. 86 (1993) 689. doi: 10.1016/0038-1098(93)90841-A
-
[30]
R. Murugan, V. Thangadurai, W. Weppner, Angew. Chem. Int. Ed. 46 (2007) 7778. doi: 10.1002/anie.200701144
-
[31]
C. Li, Y. Qiu, Y. Zhao, W. Feng, Chin. Chem. Lett. 35 (2024) 108846. doi: 10.1016/j.cclet.2023.108846
-
[32]
Z. Xie, Y. Zhou, C. Ling, et al., Chin. Chem. Lett. 33 (2022) 1407–1411. doi: 10.1016/j.cclet.2021.08.031
-
[33]
P. Birke, F. Salam, S. Döring, W. Weppner, Solid State Ionics 118 (1999) 149. doi: 10.1016/S0167-2738(98)00462-7
-
[34]
J.B. Bates, N.J. Dudney, G.R. Gruzalski, et al., Solid State Ionics 53 (1992) 647.
-
[35]
J.B. Bates, N.J. Dudney, G.R. Gruzalski, et al., J. Power Sources 43 (1993) 103. doi: 10.1016/0378-7753(93)80106-Y
-
[36]
M. Ribes, B. Barrau, J.L. Souquet, J. Non-Cryst. Solids. 38 (1980) 271.
-
[37]
X. Zhang, M.V.M. Nitou, W. Li, et al., Chin. Chem. Lett. 34 (2023) 108245. doi: 10.1016/j.cclet.2023.108245
-
[38]
S. Chen, C. Yu, S. Chen, et al., Chin. Chem. Lett. 33 (2022) 4635–4639. doi: 10.1016/j.cclet.2021.12.048
-
[39]
N. Kamaya, K. Homma, Y. Yamakawa, et al., Nat. Mater. 10 (2011) 682. doi: 10.1038/nmat3066
-
[40]
Y. Kato, S. Hori, T. Saito, et al., Nat. Energy 1 (2016) 16030. doi: 10.1038/nenergy.2016.30
-
[41]
R. Chen, Q. Li, X. Yu, L. Chen, H. Li, Chem. Rev. 120 (2020) 6820. doi: 10.1021/acs.chemrev.9b00268
-
[42]
B. Zhao, L. Ma, K. Wu, et al., Chin. Chem. Lett. 32 (2021) 125–131. doi: 10.1016/j.cclet.2020.10.045
-
[43]
K. Xu, Chem. Rev. 104 (2004) 4303. doi: 10.1021/cr030203g
-
[44]
Q. Zhao, S. Stalin, C.Z. Zhao, L.A. Archer, Nat. Rev. Mater. 5 (2020) 229. doi: 10.1038/s41578-019-0165-5
-
[45]
J.C. Bachman, S. Muy, A. Grimaud, et al., Chem. Rev. 116 (2016) 140. doi: 10.1021/acs.chemrev.5b00563
-
[46]
P. Knauth, H.L. Tuller, J. Am. Ceram. Soc. 85 (2002) 1654. doi: 10.1111/j.1151-2916.2002.tb00334.x
-
[47]
T. Minami, J. Non-Cryst. Solids. 73 (1985) 273. doi: 10.1016/0022-3093(85)90353-9
-
[48]
C.A. Angell, Annu. Rev. Phys. Chem. 43 (1992) 693. doi: 10.1146/annurev.pc.43.100192.003401
-
[49]
X. He, Y. Zhu, Y. Mo, Nat. Commun. 8 (2017) 15893. doi: 10.1038/ncomms15893
-
[50]
R. Iwasaki, S. Hori, R. Kanno, et al., Chem. Mater. 31 (2019) 3694. doi: 10.1021/acs.chemmater.9b00420
-
[51]
D.A. Weber, A. Senyshyn, K.S. Weldert, et al., Chem. Mater. 28 (2016) 5905. doi: 10.1021/acs.chemmater.6b02424
-
[52]
O. Kwon, M. Hirayama, K. Suzuki, et al., J. Mater. Chem. A 3 (2015) 438. doi: 10.1039/C4TA05231E
-
[53]
C.Z. Zhao, P.Y. Chen, R. Zhang, et al., Sci. Adv. 4 (2018) eaat3446. doi: 10.1126/sciadv.aat3446
-
[54]
O. Borodin, G.D. Smith, Macromolecules 39 (2006) 1620. doi: 10.1021/ma052277v
-
[55]
A.A. Teran, M.H. Tang, S.A. Mullin, N.P. Balsara, Solid State Ionics 203 (2011) 18. doi: 10.1016/j.ssi.2011.09.021
-
[56]
C. Li, R. Liu, S. Zhang, et al., Chin. Chem. Lett. 34 (2023) 108083. doi: 10.1016/j.cclet.2022.108083
-
[57]
S. Wang, M. Yan, Y. Li, C. Vinado, J. Yang, J. Power. Sources 393 (2018) 75. doi: 10.1016/j.jpowsour.2018.05.005
-
[58]
N. Sata, K. Eberman, K. Eberl, J. Maier, Nature 408 (2000) 946. doi: 10.1038/35050047
-
[59]
H. Wu, D. Zhuo, D. Kong, Y. Cui, Nat. Commun. 5 (2014) 5193. doi: 10.1038/ncomms6193
-
[60]
R. Koerver, I. Aygün, T. Leichtweiß, et al., Chem. Mater. 29 (2017) 5574– 5582. doi: 10.1021/acs.chemmater.7b00931
-
[61]
J. Zheng, M. Tang, Y.Y. Hu, Angew. Chem. Int. Ed. 55 (2016) 12538. doi: 10.1002/anie.201607539
-
[62]
Z. Li, H.M. Huang, J.K. Zhu, et al., ACS Appl. Mater. Interfaces 11 (2019) 784. doi: 10.1021/acsami.8b17279
-
[63]
K.L. Zhang, S. Jiao, W.L. Song, et al., Adv. Sci. 9 (2022) 2200213. doi: 10.1002/advs.202200213
-
[64]
Aninda J Bhattacharyya, Joachim Maier, Adv. Mater. 16 (2004) 811–814. doi: 10.1002/adma.200306210
-
[65]
M.A.K.L. Dissanayake, P.A.R.D. Jayathilaka, R.S.P. Bokalawala, I. Albinsson, B.E. Mellander, J. Power. Sources 119 (2003) 409–414.
-
[66]
J. Zheng, M. Chen, H. Yuan, et al., Chin. Chem. Lett. 35 (2024) 108812. doi: 10.1016/j.cclet.2023.108812
-
[67]
J. Landesfeind, J. Hattendorff, A. Ehrl, W.A. Wall, H.A. Gasteiger, J. Electrochem. Soc. 163 (2016) A1373. doi: 10.1149/2.1141607jes
-
[68]
K. Mozaffari, L. Liu, P. Sharma, J. Mech. Phys. Solids. 158 (2022) 104621. doi: 10.1016/j.jmps.2021.104621
-
[69]
C. Zhu, T. Fuchs, S.A. Weberr, et al., Nat. Commun. 14 (2023) 1300. doi: 10.1038/s41467-023-36792-7
-
[70]
Y. Nomura, K. Yamamoto, T. Hirayama, S. Ouchi, E. Igaki, K. Saitoh, Angew. Chem. 131 (2019) 5346. doi: 10.1002/ange.201814669
-
[71]
S. Lv, T. Verhallen, A. Vasileiadis, et al., Nat. Commun. 9 (2018) 2152. doi: 10.1038/s41467-018-04394-3
-
[72]
C. Wang, Y. Gong, J. Dai, et al., J. Am. Chem. Soc. 139 (2017) 14257–14264. doi: 10.1021/jacs.7b07904
-
[73]
S. Wang, H. Xu, W. Li, A. Dolocan, A. Manthiram, J. Am. Chem. Soc. 140 (2018) 250–257. doi: 10.1021/jacs.7b09531
-
[74]
K Park, B. Yu, Ji. Jung, et al., Chem. Mater. 28 (2016) 8051–8059. doi: 10.1021/acs.chemmater.6b03870
-
[75]
Z. Huang, W. Song, S. Jiao, et al., Adv. Mater. 34 (2022) 2104557. doi: 10.1002/adma.202104557
-
[76]
P Perrenot, A Fauchier-Magnan, M Mirolo, et al., Adv. Funct. Mater. 34 (2024) 2310739. doi: 10.1002/adfm.202310739
-
[77]
C Zhang, J Yu, Y Cui, et al., Nat. Commun. 15 (2024) 5325. doi: 10.1038/s41467-024-49715-x
-
[78]
X Zhang, Q Su, G Du, et al., Angew. Chem. Int. Ed. 135 (2023) e202304947. doi: 10.1002/ange.202304947
-
[79]
M. Kotobuki, K. Kanamura, Y. Sato, K. Yamamoto, T. Yoshida, J. Power Sources 199 (2012) 346. doi: 10.1016/j.jpowsour.2011.10.060
-
[80]
Y. Nomura, K. Yamamoto, T. Hirayama, et al., Angew. Chem. Int. Ed. 58 (2019) 5292. doi: 10.1002/anie.201814669
-
[81]
Q. Song, Y. Zhang, J. Liang, et al., Chin. Chem. Lett. 35 (2024) 108797. doi: 10.1016/j.cclet.2023.108797
-
[82]
N.S. Grundish, J.B. Goodenough, H. Khani, Curr. Opin. Electrochem. 30 (2021) 100828. doi: 10.1016/j.coelec.2021.100828
-
[83]
P. Johansson, M.A. Ratner, D.F. Shriver, J. Phys. Chem. B. 105 (2001) 9016. doi: 10.1021/jp010868r
-
[84]
H. Hou, C.E. Banks, M. Jing, Y. Zhang, X. Ji, Adv. Mater. 27 (2015) 7861. doi: 10.1002/adma.201503816
-
[85]
C. Ma, K. Dai, H. Hou, et al., Adv. Sci. 5 (2018) 1700996. doi: 10.1002/advs.201700996
-
[86]
W. Kou, R. Lv, S. Zuo, et al., Membrane Sci 618 (2021) 118702. doi: 10.1016/j.memsci.2020.118702
-
[87]
R.J. Sengwa, S. Choudhary, J. Alloys Compd. 701 (2017) 652. doi: 10.1016/j.jallcom.2017.01.155
-
[88]
P.K. Singh, B. Bhattacharya, R.K. Nagarale, J. Appl. Polym. Sci. 118 (2010) 2976. doi: 10.1002/app.32726
-
[89]
Y. Zhu, J. Cao, H. Chen, Q. Yu, B. Li, J. Mater. Chem. A. 7 (2019) 6832. doi: 10.1039/C9TA00560A
-
[90]
S.H.S. Cheng, K.Q. He, et al., Electrochim. Acta. 253 (2017) 430. doi: 10.1016/j.electacta.2017.08.162
-
[91]
C.W. Lin, C.L. Hung, M. Venkateswarlu, B.J. Hwang, J. Power Sources 146 (2005) 397. doi: 10.1016/j.jpowsour.2005.03.028
-
[92]
B. Scrosati, F. Croce, L. Persi, J. Electrochem. Soc. 147 (2000) 1718. doi: 10.1149/1.1393423
-
[93]
J. Zhang, N. Zhao, M. Zhang, et al., Nano Energy 28 (2016) 447. doi: 10.1016/j.nanoen.2016.09.002
-
[94]
X. Zhang, J. Xie, F. Shi, et al., Nano Lett. 18 (2018) 3829. doi: 10.1021/acs.nanolett.8b01111
-
[95]
W. Liu, A.D. Sendek, Y. Cui, et al., Nat. Energy 2 (2017) 17035. doi: 10.1038/nenergy.2017.35
-
[96]
J. Wan, J. Xie, X. Kong, et al., Nat. Nanotechnol. 14 (2019) 705. doi: 10.1038/s41565-019-0465-3
-
[97]
O. Sheng, C. Jin, J. Luo, et al., Nano Lett. 18 (2018) 3104. doi: 10.1021/acs.nanolett.8b00659
-
[98]
H. Chen, D. Adekoya, L. Hencz, et al., Adv. Energy Mater. 10 (2020) 2000049. doi: 10.1002/aenm.202000049
-
[99]
Y. Zhao, J. Yan, W. Cai, et al., Energy Storage Mater. 23 (2019) 306. doi: 10.1016/j.ensm.2019.04.043
-
[100]
Y. Liu, Y. Huang, X. Duan, Nature 567 (2019) 323. doi: 10.1038/s41586-019-1013-x
-
[101]
H. Qi, B. Liang, U. Kaiser, SmartMat 2 (2021) 131. doi: 10.1002/smm2.1035
-
[102]
M. Yuan, J. Erdman, C. Tang, H. Ardebili, RSC Adv. 4 (2014) 59637. doi: 10.1039/C4RA07919A
-
[103]
W. Tang, S. Tang, C. Zhang, et al., Adv. Energy. Mater. 8 (2018) 1800866. doi: 10.1002/aenm.201800866
-
[104]
R. Rojaee, S. Cavallo, S. Mogurampelly, et al., Adv. Funct. Mater. 30 (2020) 1910749. doi: 10.1002/adfm.201910749
-
[105]
S. Xia, B. Yang, H. Zhang, et al., Adv. Funct. Mater. 31 (2021) 2101168. doi: 10.1002/adfm.202101168
-
[106]
Q. Pan, Y. Zheng, S. Kota, C.Y. Li, et al., Nano. Adv. 1 (2019) 395. doi: 10.1039/C8NA00206A
-
[107]
Y. Shi, B. Li, Q. Zhu, et al., Adv. Energy Mater. 10 (2020) 1903534. doi: 10.1002/aenm.201903534
-
[108]
W. Tang, S. Tang, X. Guan, et al., Adv. Funct. Mater. 29 (2019) 1900648. doi: 10.1002/adfm.201900648
-
[109]
S. Song, Y. Wu, W. Tang, et al., ACS Sustain. Chem. Eng. 7 (2019) 7163. doi: 10.1021/acssuschemeng.9b00143
-
[110]
W. Zha, W. Li, Y. Ruan, J. Wang, Z. Wen, Energy Storage Mater. 36 (2021) 171. doi: 10.1016/j.ensm.2020.12.028
-
[111]
W. Zha, J. Li, W. Li, C. Sun, Z. Wen, Chem. Eng. J. 406 (2021) 126754. doi: 10.1016/j.cej.2020.126754
-
[112]
J. Zhang, J. Zhao, L. Yue, et al., Adv. Energy Mater. 5 (2015) 1501082. doi: 10.1002/aenm.201501082
-
[113]
D. Lin, R.H. Dauskardt, Y. Cui, et al., Adv. Mater. 30 (2018) 1802661. doi: 10.1002/adma.201802661
-
[114]
K. Fu, Y. Gong, J. Dai, et al., P. Natl. Acad. Sci. U. S. A. 113 (2016) 7094. doi: 10.1073/pnas.1600422113
-
[115]
H. Xie, C. Yang, K. Fu, et al., Adv. Energy. Mater. 8 (2018) 1703474. doi: 10.1002/aenm.201703474
-
[116]
J. Hu, P. He, B. Zhang, B. Wang, L.Z. Fan, Energy Storage Mater. 26 (2020) 283. doi: 10.1016/j.ensm.2020.01.006
-
[117]
J. Bae, Y. Li, J. Zhang, et al., Angew. Chem. Int. Ed. 57 (2018) 2096. doi: 10.1002/anie.201710841
-
[118]
S. Zekoll, C. Marriner-Edwards, A.O. Hekselman, et al., Energy Environ. Sci. 11 (2018) 185. doi: 10.1039/C7EE02723K
-
[1]
-
Figure 1 Combined methods for understanding ion transport behaviors in SSEs and designing hierarchical fillers for composite electrolytes with fast ionic transport abilities.
Figure 2 Schematic diagram of the ion conduction path of SSEs: (a) Inorganic SSEs; (b) amorphous polymer SSEs; (c) crystalline polymer SSEs. Reprinted with permission [43]. Copyright 2004, American Chemical Society.
Figure 3 (a) Scheme for testing method to obtain the electronic and (b, c) ionic conductivity of bulk samples. Reprinted with permission [57]. Copyright 2018, Elsevier.
Figure 4 (a) The formation of dendrites in LIBs. (b) The voltage profile in a Li/Li battery. Reprinted with permission [59]. Copyright 2014, Springer Nature. (c) The charge-discharge profile and impedance spectra. (d) The evolution of the four resistances from impedance spectra fitting. Reprinted with permission [60]. Copyright 2017, American Chemical Society.
Figure 5 Ion conduction characterization of composite electrolytes: (a) Schematic diagram of ion conduction paths in LLZO-PEO. (b) Regulation of solid-state NMR signals by cyclic processes. Reprinted with permission [61]. Copyright 2016, Wiley-VCH. (c) The regulatory mechanism of packing conduction path by qualitative analysis of solid state nuclear magnetic cores with 6Li as both prime labeling. Reprinted with permission [62]. Copyright 2019, American Chemical Society.
Figure 6 (a) Schematic diagram of the combination of CA, EIS, and DS method. (b) Relationships of parameters obtained from CA, EIS, and DS method. (c) The σ of PEO-TiO2 SSEs with different v and xF of TiO2 fillers. (d) The normalized enhancement factor of c and Ea to σ. Reprinted with permission [63]. Copyright 2022, Wiley-VCH.
Figure 7 The schematic diagram of volume and interfacial effects of P-TiO2 (a) and P-F-TiO2 (b) filler. (c) The conductance volcano plots of P-TiO2 and P-F-TiO2. (d) Series equivalent circuit model and ions transportation model. (e) The relationships between σtotal and υ. (f) The relationships of k and υ. Reprinted with permission [63]. Copyright 2022, Wiley-VCH.
Figure 8 (a) Schematic diagram of KPFM measurement on the LLZO surface. (b) The factor k calculated at different positions on LLZO surfaces. (c-e) Schematic diagram, topography and CPD maps of the site of the KPFM measurement. (f, g) Averaged line profiles of the topography and CPD at different KPFM measure positions. Reprinted with permission [67]. Copyright 2024, Elsevier.
Figure 9 (a) The sample configuration of the Cu/LASGTP interface for measurement. (b) The TEM image of Cu/LASGTP interface. (c-e) TEM image, the holograms, and the phase map at the Cu/LASGTP interface. Reprinted with permission [70]. Copyright 2019, Wiley-VCH.
Figure 10 (a) Schematic diagram of operando NDP measurement and results. (b) Total amount of lithium mass and the plating potential. Reprinted with permission [71]. Copyright 2018, Springer Nature. (c) The cell structures for the NDP measurement. The integrated NDP count curve, charge curve and the corresponding voltage profile of the asymmetric cell (d) and symmetric cell (e) during cycling. Reprinted with permission [72]. Copyright 2017, American Chemical Society.
Figure 11 (a) Nyquist plot, bode plot, impedance spectra, and total resistance of Na-NZSP-Na symmetric cells over aging time. (b) 2D TOF-SIMS elemental maps of NZSP-Na interface. (c) 3D TOF-SIMS elemental maps of NZSP. Reprinted with permission [73]. Copyright 2018, American Chemical Society. (d) 3D TOF-SIMS elemental maps of the LiCoO2/LLZO interface. Reprinted with permission [74]. Copyright 2016, American Chemical Society.
Figure 12 (a) Schematic diagram of the X-ray CT measurement and data analysis. (b) Reconstructed structure of the positive electrode at varying SOCs. (c) Diagram of the positive electrode reconstructed structure. (d) The volume ratio of positive electrode particles and pore. (e, f) The volume distribution of positive electrode particles and pores. (g, h) The volume ratio of positive electrode particles and pores at various position. (i) DRT results at various electrode SOCs. (j) Self-discharge behaviors of the SSBs. Reprinted with permission [75]. Copyright 2022, Wiley-VCH.
Figure 13 (a–h) 3D map of Li/LPS interface under various pressure and time condition. Reprinted with permission [76]. Copyright 2024, Wiley-VCH. (i) SEM image and EDS mapping of LLZTO-KF. (j, k) 3D and 2D view of element distribution. Reprinted with permission [77]. Copyright 2024, Springer Nature. (l–o) TEM and TOF-SIMS maps of LiF-rich SEI. Reprinted with permission [78]. Copyright 2023, Wiley-VCH.
Figure 14 Design of zero-dimensional fillers in composite electrolytes: (a) TEM and optical photographs of carbon quantum dots (CQDs). (b) Photographs of different types of CQD electrolytes. (c, d) Bending and stretching tests of CQD electrolytes. (e) Schematic of the effect of CQDs on ion transport. Reprinted with permission [85]. Copyright 2018, Wiley-VCH. (f) Schematic diagram of ion transport in polyethylene glycol fatty acid ester (PEG) grafted polymer quantum dot composite electrolyte. Reprinted with permission [86]. Copyright 2022, Elsevier.
Figure 15 Design of one-dimensional packing of composite electrolyte: (a) Schematic diagram of the transport channel of Li+ in different structural fillers. (b) Macro/microscopic characterization and schematic of PI packing electrolytes. Reprinted with permission [96]. Copyright 2019, Springer Nature. (c) Internal Li+ transport mechanism of Mg2B2O5 nanowire packing composite electrolyte. Reprinted with permission [94]. Copyright 2018, American Chemical Society.
Figure 16 Design of two-dimensional packing for composite electrolyte: (a) Schematic diagram of the synthesis arrangement process and ion conduction mechanism of VS filler. Reprinted with permission [98]. Copyright 2020, Wiley-VCH. (b) Schematic diagram of monolayer double hydroxide nanosheet-enhanced PVDF-HFP composite polymer electrolyte. Reprinted with permission [100]. Copyright 2019, Springer Nature.
Figure 17 Design of 3D conductive filler for composite electrolyte: (a) Schematic diagram of the preparation process of a composite SSEs. Reprinted with permission [115]. Copyright 2018, Wiley. (b) Geometric structure construction process of 3D LLTO/PEO composite electrolyte filler. Reprinted with permission [117]. Copyright 2018, Wiley-VCH. (c) Schematic diagram of the 3D structure LAGP/polymer composite electrolyte formation process. Reprinted with permission [118]. Copyright 2018, The Royal Society of Chemistry.
Table 1. The scale and dimension of test methods for ion transport.
Methods (+: combined method) Scale Dimension EIS+CA Frequency dependent
(micro-meter~meter)Arbitrary dimension
(Statistical)EIS+DC Frequency dependent
(micro-meter ~meter)Arbitrary dimension
(Statistical)EIS+CA+DS Frequency dependent
(nano-meter~meter)Arbitrary dimension
(Statistical)NMR Nano-meter~micro-meter 1D KPFM Nano-meter~micro-meter 2D SEM/TEM Nano-meter~micro-meter 2D Neutron Micro-meter ~meter 3D TOF-SIM+(EIS) Nano-meter~micro-meter 2D-3D micro-CT+(EIS) Micro-meter ~meter 3D nano-CT+(EIS) Nano-meter~micro-meter 3D  下载: 导出CSV
-

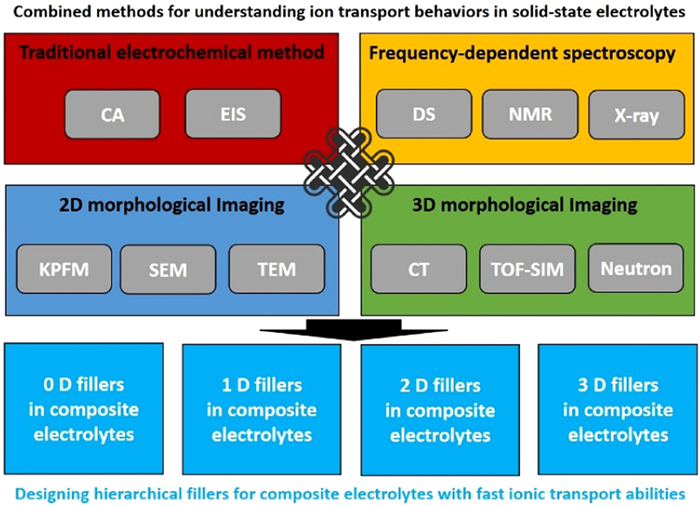
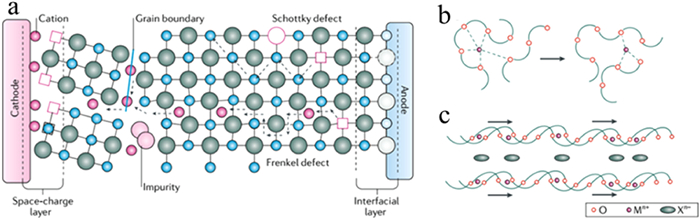
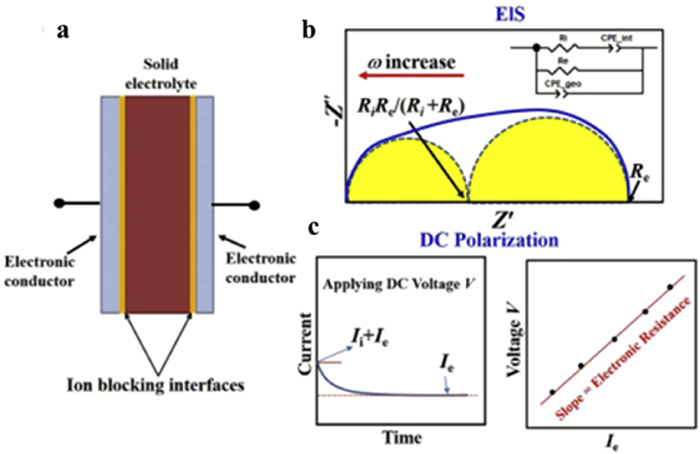
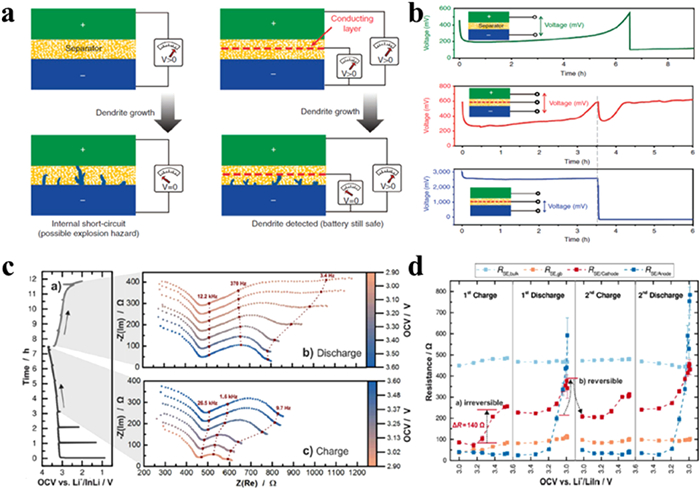
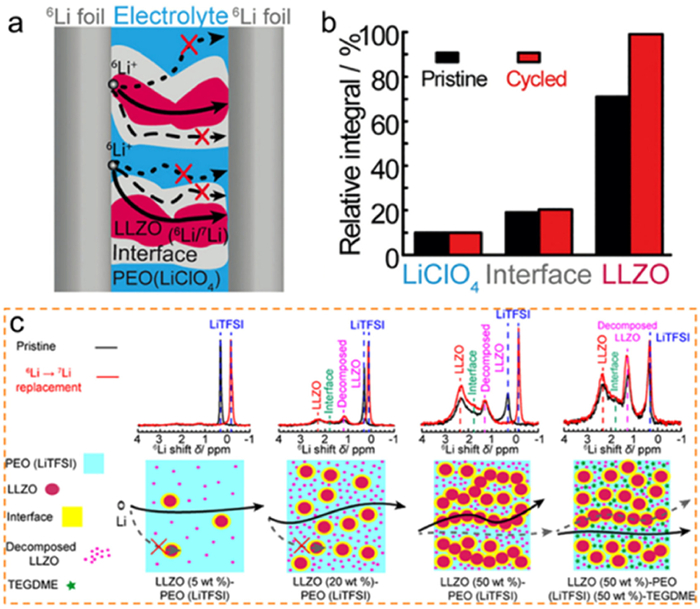
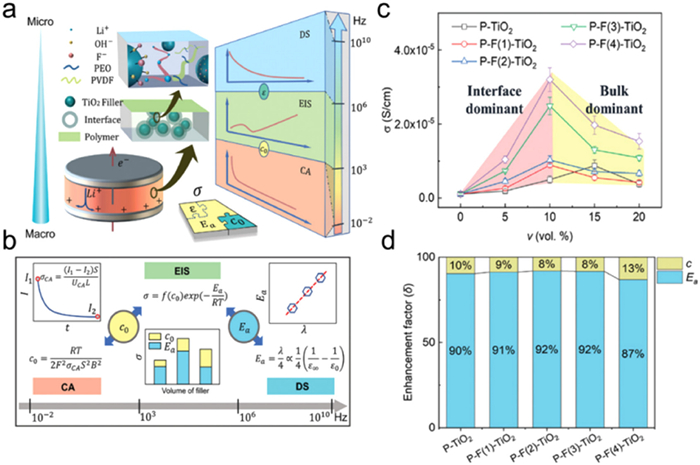
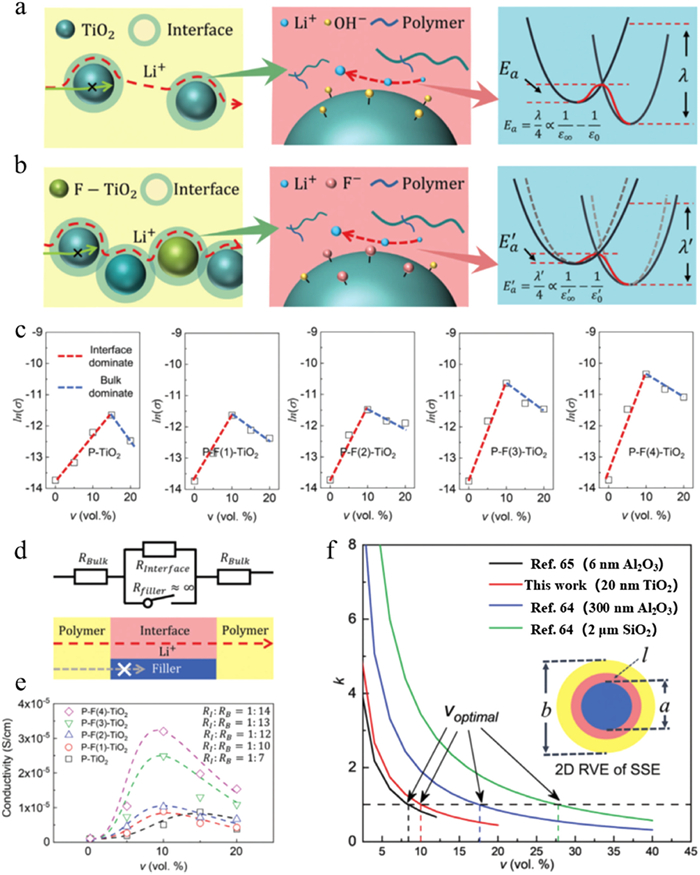
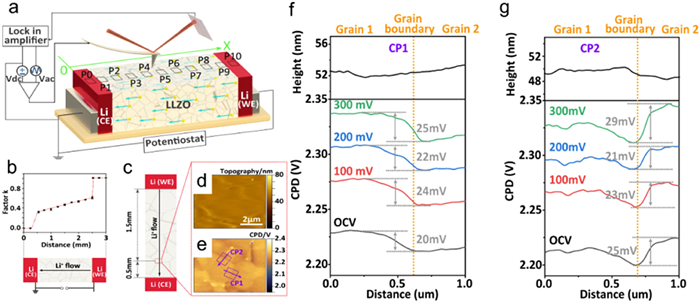
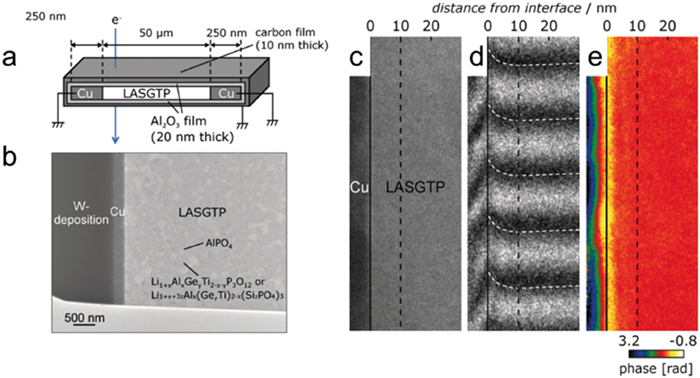
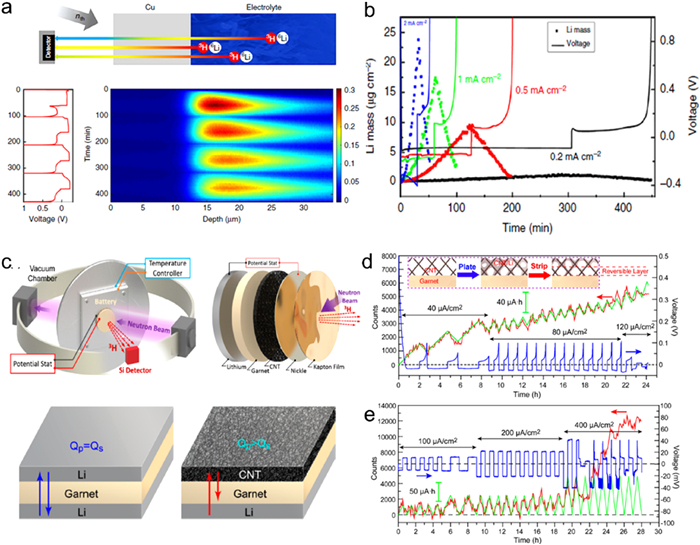
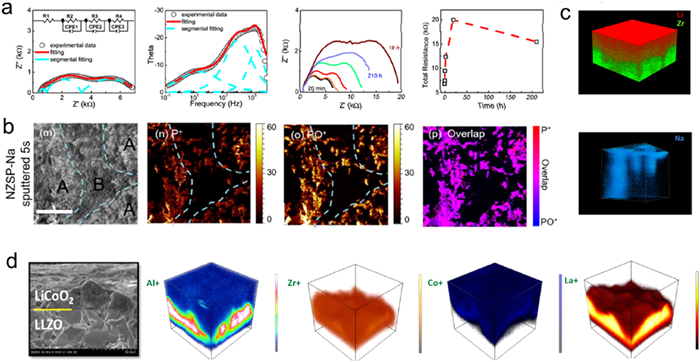
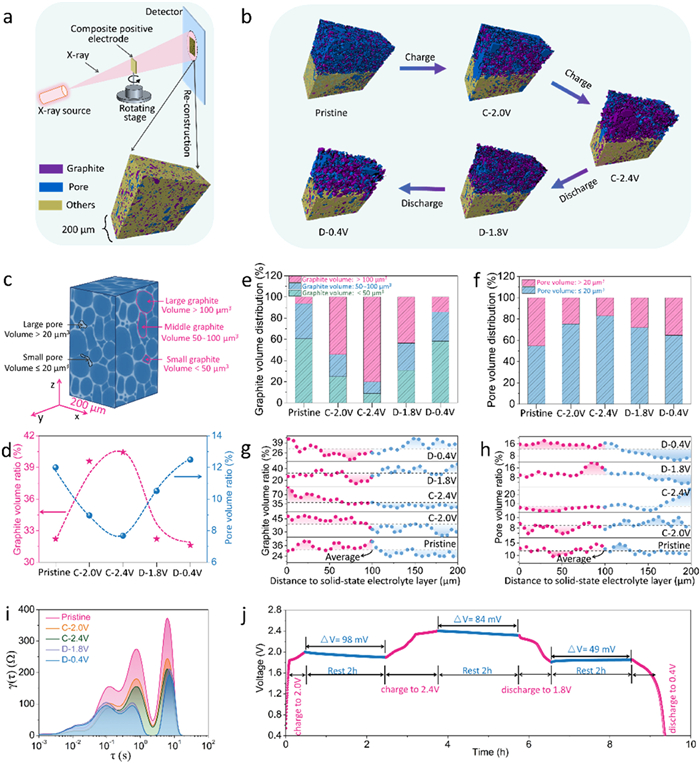
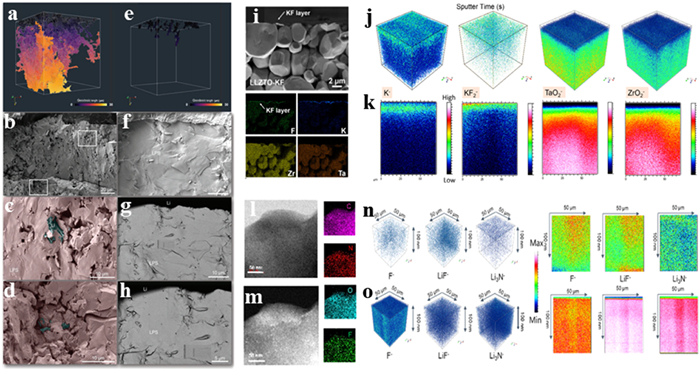
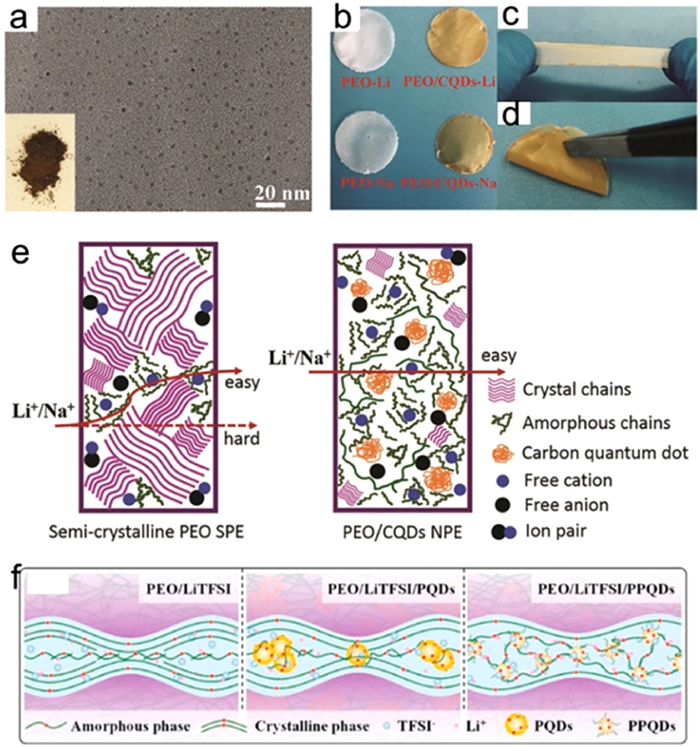
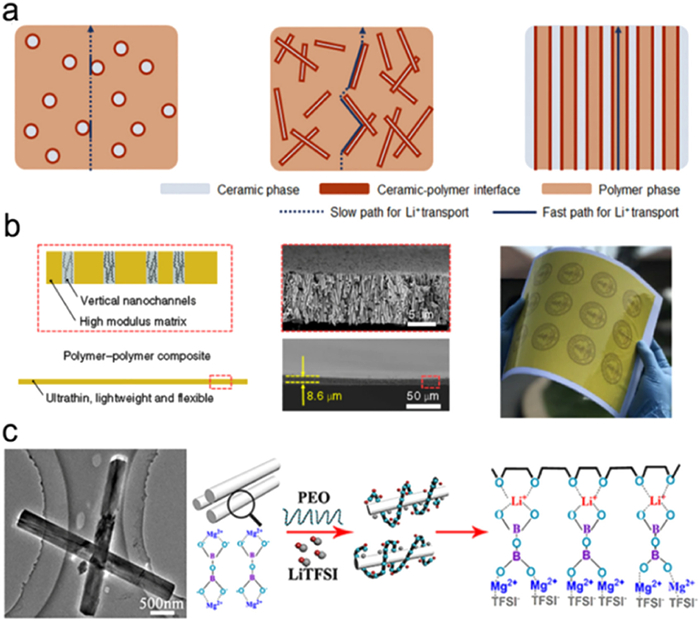
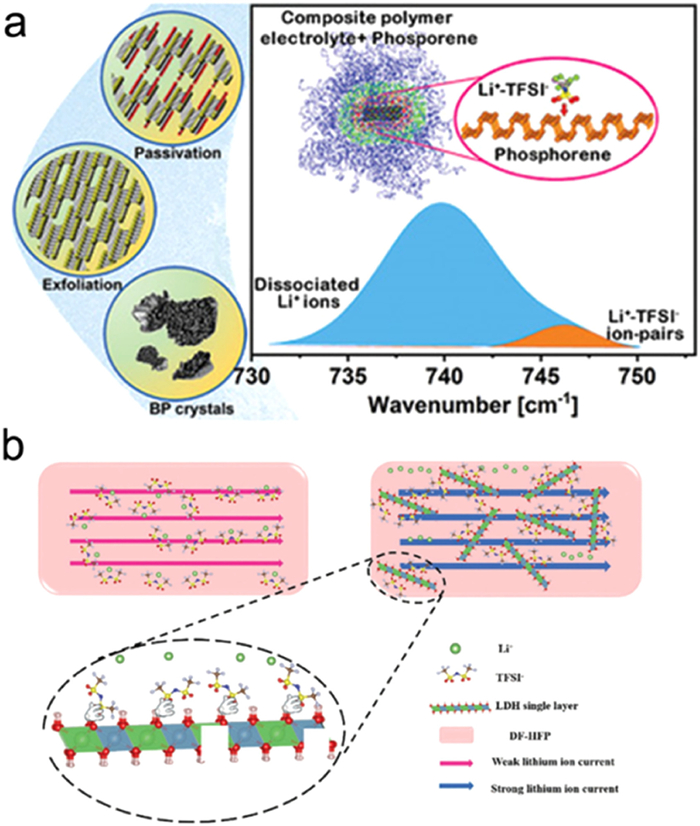
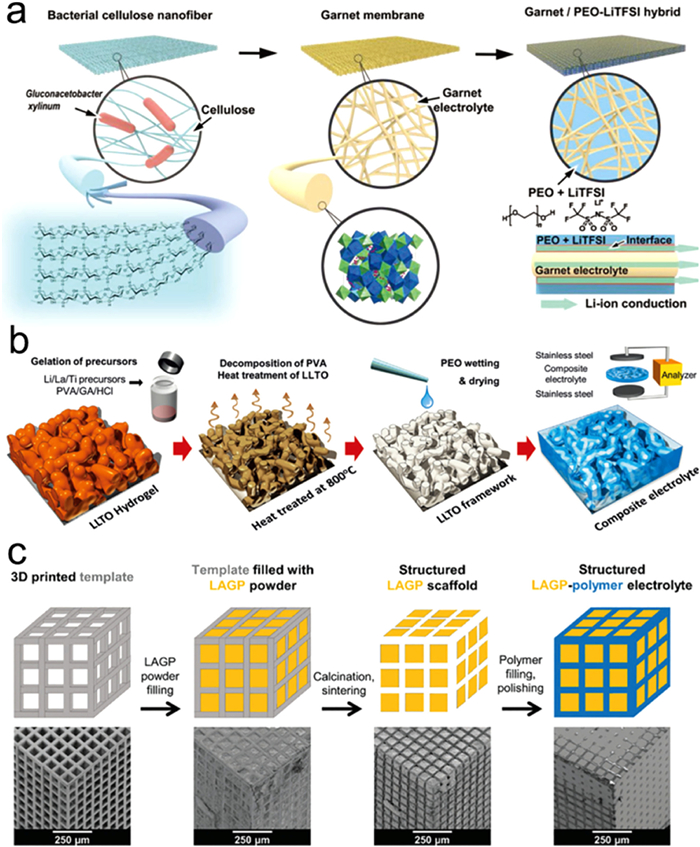


 扫一扫看文章
计量
- PDF下载量: 0
- 文章访问数: 122
- HTML全文浏览量: 6
 下载:
下载:
