Citation:
Fengzhi Wang, Ke Hu, Jinquan Chen, Zhubin Hu, Haitao Sun, Tony D. James, Yufang Xu, Xuhong Qian. Meta-amino substituted naphthalimides exhibit large charge transfer and strong N-H vibrations enabling use as ratiometric fluorescent probe[J]. Chinese Chemical Letters,
2026, 37(1): 110971.
doi:
10.1016/j.cclet.2025.110971
Meta-amino substituted naphthalimides exhibit large charge transfer and strong N-H vibrations enabling use as ratiometric fluorescent probe
English
Meta-amino substituted naphthalimides exhibit large charge transfer and strong N-H vibrations enabling use as ratiometric fluorescent probe
Received Date:
29 November 2024 Accepted Date:
18 February 2025 Revised Date:
13 February 2025 Available Online:
15 January 2026
Abstract:
Fluorescent probes based on intramolecular charge transfer (ICT) have obvious advantages for accurate quantitative analysis. To obtain high-performance ratiometric probes requires distinct photophysical properties during recognition reaction process, which is closely related to their ICT characteristics. 1,8-Naphthalimide is known as a typical fluorophore with desirable ICT property when functionalized with an electron-donating moiety at the para-position of the naphthalene chromophore. Although the photophysical properties of para-substituted 1,8-naphthalimide have been well studied, its meta-substituted counterpart has not been fully evaluated since the meta-position is conventionally thought to be weakly conjugated. Herein, combined experimental and theoretical studies are performed which consistently indicate that stronger charge transfer (CT) is exhibited by the meta-amino substituted 1,8-naphthalimide (m-NH2) compared to the para-amino substituted one (p-NH2). The ratiometric response of fluorescence with significant changes in wavelength and intensity upon acetylation (m-NAc and p-NAc) can be attributed to the larger ICT and stronger -NH2 vibrations. This observation is further demonstrated by deuterium oxide experiments, viscosity experiments and quantum chemical calculations. The practical application of meta-amino-1,8-naphthalimide ICT-based probes is also confirmed. This research is expected to bring an in-depth understanding of π-conjugated systems with ICT characteristics, and facilitates the design of sensitive ICT fluorescent probes with meta-amino substitution.
Fluorescent probes are effective tools for detecting and visualizing biological events due to their non-invasive, real-time and quantitative characteristics [1–4]. Molecular structure is a key intrinsic factor affecting the fluorescence properties [5]. The key to developing high-performance fluorescent probes is a precise understanding of the fluorescence mechanism [6,7]. Considerable efforts have been made to develop intramolecular charge transfer (ICT)-based fluorescent probes exhibiting high sensitivity, large Stokes shift, and easy self-calibration [8–11]. ICT-based fluorophores are characterized by donor-π-acceptor (D-π-A) scaffolds exhibiting strong fluorescence [12–14]. In general, when the donor is replaced by an electron-withdrawing group, the “push-pull” electronic structure is destroyed, commonly accompanied by fluorescence quenching [5,15,16].
It is known that 1,8-naphthalimide is a typical fluorophore with desirable ICT properties when functionalized with donor moieties like amine or hydroxyl groups at the para-position of the naphthalene nucleus, which exhibit redshift wavelengths and high fluorescence quantum yields (QYs) [17–19]. This is probably caused by the formation of a “push-pull” electron structure between the electron-donating amine and the electron-withdrawing imide in the conjugated plane [20]. For this reason, para-amino substituted 1,8-naphthalimide has been widely utilized for the ratiometric fluorescence detection of various targets [21–23], such as ions [24,25], reactive bio-species [26,27] and cancer-associated enzymes [28,29]. In contrast, the meta-position is conventionally thought to be only weakly conjugated, the application of meta-amino substituted 1,8-naphthalimide is relatively limited [30–38]. Xu et al. reported that the meta-azetidine substituted naphthalimide exhibited stronger charge transfer and is more sensitive to the solvent environment [39,40]. Our research group has developed a ratiometric N-acetyltransferase 2 (NAT2) fluorescent probe taking advantage of the unique NAT2 catalyzed N-acylation of amonafide [41]. The fluorescence QY of amonafide exhibited 10-fold fluorescence enhancement with large emission wavelength blueshift of 140 nm after recognition, with minimal interference during the detection process. Our system was one of the first fluorescent probes based on meta-substituted 1,8-naphthalimide, confirming that the meta-position can also be used to develop ICT-based probes. The small signal overlap between the absorption and fluorescence emission bands of meta-amino substituted 1,8-naphthalimide also led to a significant increase in detection sensitivity. However, a fundamental understanding of meta-amino substituted ICT conjugated system remains elusive.
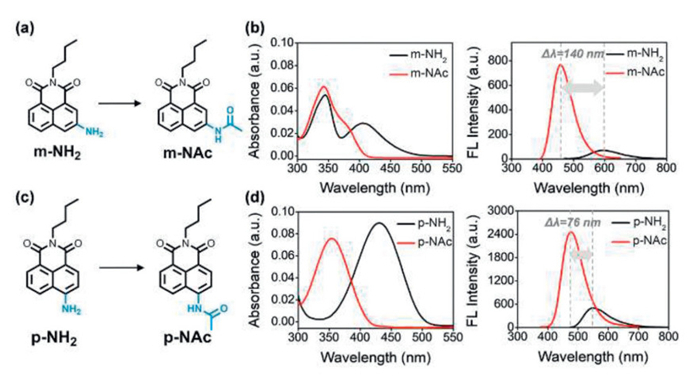
Herein, we synthesized m-NH2 and p-NH2 with a N-butyl moiety to simplify the molecule and avoid interference from photoinduced electron transfer (PeT) at the imide site and determined the photophysical properties of m-NH2, p-NH2, m-NAc and p-NAc (Figs. 1a and c). For p-NH2, only one absorption peak at around 430 nm appeared (Fig. 1d), but for m-NH2, two absorption peaks, one at around 405 nm, and the second at 345 nm was observed (Fig. 1b). The fluorescence spectra of m-NH2 exhibited a peak at 593 nm in water and displayed the largest blueshift (140 nm) after acetylation. Combined with theoretical calculation and experimental verification, the unique nature of meta-substituted m-NH2vs.p-NH2 was revealed based on the calculated frontier molecular orbitals, parameters of electron-hole distance, and amount of internal charge transfer using quantum chemical calculations. The simulation results based on predicted total reorganization energy and molecular vibration modes which are used to verify the effect of -NH2 vibrations are in good agreement with the deuterium oxide and viscosity experiments. We believe this work can provide a deeper understanding of meta-amino substituted conjugated systems with ICT characteristics.
Figure 1
Figure 1.
(a) Molecular structures of m-NH2 and m-NAc after acetylation. (b) Absorption and fluorescence spectra of m-NH2 (10 µmol/L) and m-NAc (10 µmol/L) in water. (c) Molecular structures of p-NH2 and p-NAc after acetylation. (d) Absorption and fluorescence spectra of p-NH2 (10 µmol/L) and p-NAc (10 µmol/L) in water. (m-NH2: λex = 345 nm, m-NAc: λex = 340 nm, p-NH2: λex = 430 nm, p-NAc: λex = 353 nm, slit: 5/5 nm).
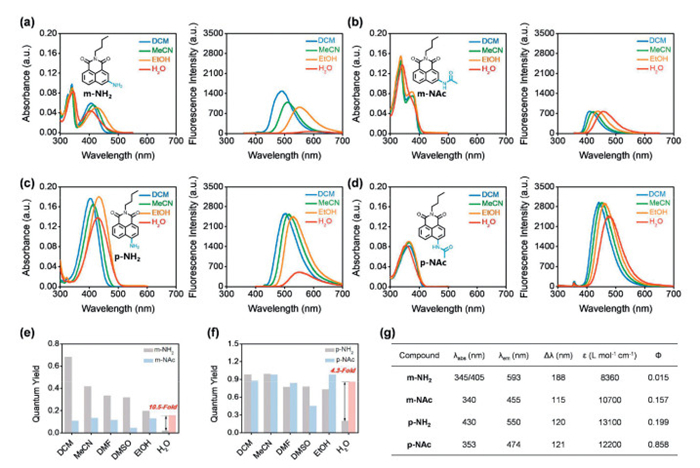
In all tested solvents, m-NH2 exhibited two absorption peaks, and the second absorption band was around 340–345 nm, which was stronger than the first one at around 400–427 nm (Fig. 2a, Fig. S1 and Table S1 in Supporting information). The fluorescence spectra of m-NH2 exhibited a peak at 593 nm in water which was the longest for all solvents evaluated (Fig. 2a). As expected, the longer wavelength absorption peak of m-NH2 shifted to shorter wavelengths at about 380 nm after acetylation, accompanied by a blueshift of emission wavelength and a decrease in fluorescence QY in all organic solvents (Fig. 2b). It is worth noting that the QY of m-NAc (Ф = 0.157) exhibited a 10.5-fold increase when compared with m-NH2 (Ф = 0.015) in water (Figs. 2e and g).
Figure 2
Figure 2.
Photophysical properties of m-NH2, p-NH2, m-NAc and p-NAc. (a–d) Absorption and fluorescence spectra of four molecules (10 µmol/L) in various solvents. (e, f) Quantum yields of four molecules in various solvents. (g) Absorption (λabs) and emission maxima (λem), Stokes shifts (Δλ), molar extinction coefficient (ε) and QY (Ф) of four molecules measured in water. m-NH2: λex = 345 nm, m-NAc: λex = 340 nm, p-NH2: λex = 430 nm, p-NAc: λex = 353 nm, slit: 5/5 nm.
The absorption spectra of p-NH2 in all solvents exhibited a single peak at around 403–435 nm, and the fluorescence spectra exhibited a peak at 550 nm in water, which was ~45 nm shorter wavelength than that of m-NH2 (Fig. 2c). Meanwhile, p-NH2 exhibited a fluorescence decrease in water similar to m-NH2. Substituting the amine with an acetyl group resulted in a blueshift of ~50 nm in all solvents (Fig. 2d). It was found that the fluorescence QY was enhanced by 10.5 times after the acetylation of m-NH2, which was more than twice the measured 4.3 times for the acetylation of p-NH2 (Figs. 2f and g). In addition, the photophysical properties were also affected by solvents. A redshift of the emission spectra was consistently observed for both m-NH2 and p-NH2, when changing solvents from DCM, MeCN, EtOH, to H2O. As seen, a significant fluorescence decrease was observed for m-NH2 particularly in water. After acetylation in water, a blueshift of emission wavelength is observed accompanying with the increasing fluorescence intensity. Notably, the variation in both emission wavelength and intensity observed for m-NH2 is greater than that of p-NH2, which suggests stronger ICT for m-NH2.
Based on the above different photophysical properties, we deduce that the electrons of the nitrogen atom in the m-NH2 are partially distributed in the π-conjugated system resulting in two absorption peaks at 345 nm/405 nm, whereas the electrons of nitrogen atom in the p-NH2 are almost entirely distributed in the conjugated system which exhibits only one absorption peak with a longer wavelength at 430 nm. After acetylation, the conjugated system is disrupted and a blueshift is induced in water, meanwhile the “push-pull” ICT effect is increased accompanied by the fluorescence increasing. Notably, the variation observed for m-NH2 is greater than that of p-NH2, which suggests that the charge transfer of m-NH2 might be more significant. The partial distribution of the electrons of m-NH2 with the conjugated system also leads to easier hydrogen bonding interactions with solvents.
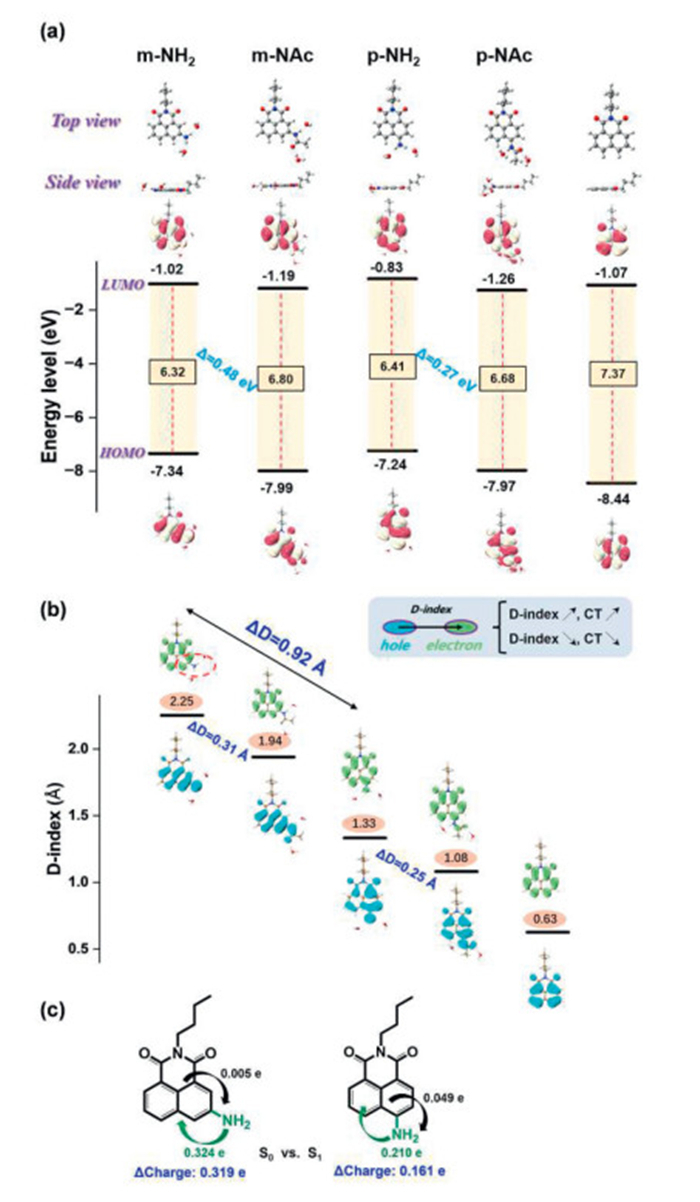
To further reveal the underlying mechanism of the meta-/para-amino substituent effect and different photophysical properties in water, density functional theory (DFT) and time-dependent DFT (TDDFT) calculations were performed at the optimally tuned-LC-BLYP* [42,43]/6–311G+(d,p) level, which has been shown to a reliable method for the accurate prediction of absorption and fluorescence properties. To better simulate the impact of a water environment, a cluster model consisting of the dyes and explicit water molecules via hydrogen bonding interactions were introduced in addition to the implicit solvation model based on density (SMD) (see Fig. S2 in Supporting information for the cluster model rationality verification). Thus, both solvent polarization environment and direct interaction of the surrounding water molecules with the amino group were evaluated. First, compared to the non-substituted 1,8-naphthalimide (7.37 eV), the NH2-substitution raises both the highest occupied molecular orbital (HOMO) and the lowest unoccupied molecular orbital (LUMO) levels, leading to significantly decreased orbital gaps for m-NH2 (6.32 eV) and p-NH2 (6.41 eV) (Fig. 3a). Interestingly, upon acetylation the decreased HOMO and LUMO levels result in slightly increased orbital gaps for m-NAc (6.80 eV) and p-NAc (6.68 eV), which is in good agreement with the experimentally observed blueshift of the absorption spectra. The energy gap difference of Δ = 0.48 eV between m-NH2 and m-NAc was slightly larger than that of Δ = 0.27 eV between p-NH2 and p-NAc, that was also in good agreement with the experimentally determined the change of Stokes shift.
Figure 3
Figure 3.
(a) Calculated HOMO and LUMO energy levels of five selected molecular dyes at the optimally-tuned-LC-BLYP*/6–311G+(d,p) level. (b) The analysis of electron-hole distribution of five molecules based on their lowest singlet excited state (S1), the D-index is defined as the distance (Å) between the centroids of the hole and electron distribution for the lowest singlet states. (c) The intramolecular charge transfer for two fragments between S0 and S1 states based on NPA.
The absorption spectra of the five selected dyes were simulated by TDDFT calculations as shown in Fig. S3 and Table S2 (Supporting information). The simulated absorption spectra reproduced the experimental measurements well, whether that be the overall shape of the spectra or the position of the spectral peaks. For m-NH2, the two absorption peaks located at 405 nm/345 nm in experiment are assigned as the S0-S1 and S0-S2 transitions with moderate oscillator strengths and calculated absorption wavelengths of 429 nm/322 nm, respectively. After acetylation, the two peaks in the absorption spectra of m-NAc became closer. For p-NH2, only one main peak at 430 nm was observed in the experiment. The two peaks that are well separated can be explained by a strong S0-S1 transition at 413 nm (f = 0.388) and weak S0-S2 transition at 304 nm (f = 0.002). To further provide quantitative characterization of the excited-state properties, the D-index [44] defined as distance between the centroids of the hole and electron distribution for the lowest singlet states were also calculated (Fig. 3b). Normally, a larger D-index corresponds to a well separated hole and electron distribution, indicating stronger CT characteristics. The m-NH2 molecule displayed the largest D value of 2.25 Å, which was significantly larger than that for p-NH2 of 1.33 Å. This result indicates stronger CT characteristics for meta-substitution versus para-substitution. Acetylation can weaken the CT characteristics and reduce the D values to a certain extent (ΔD = 0.31 Å for meta- and ΔD = 0.25 Å for para-). In addition, the stronger CT characteristics were also confirmed by the greater amount of charge transfer (0.319 e for meta- vs. 0.161 e for para-) based on natural population analysis (NPA) as shown in Fig. 3c.
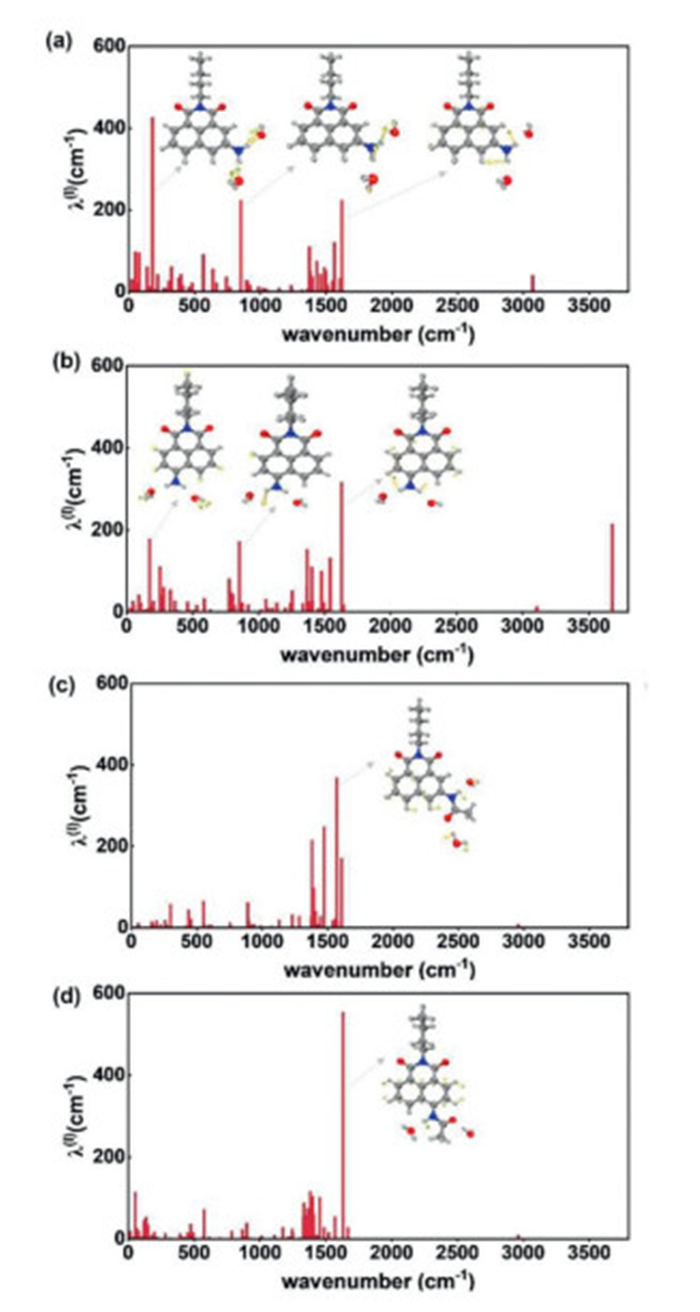
To further investigate the influence of meta-/para-substitution on the nonradiative transition process and resulting QYs of the dye molecules, the radiative decay rate (kr) and nonradiative decay rate (knr) were calculated (Fig. 4 and Table S4 in Supporting information). Generally, the QYs are determined by competition of kr and knr, i.e., QY = kr (kr + knr)−1. A larger kr suggests a stronger radiative transition and a smaller internal conversion rates (kic) indicates a weaker nonradiative transition for the molecule, thus finally resulting in an enhanced QY. The kr constant can be calculated using the Einstein spontaneous emission equation kr = fΔE2 1.499−1 for a simple two-level model [45], in which f is the dimensionless oscillator strength, and ΔE is the optical gap (emission energy) of S1 calculated by TDDFT. The values of kr for m-NH2 and m-NAc were calculated to be 5.25 × 10⁷ and 1.16 × 10⁸ s−1, with only ~2.2-fold enhancement after acetylation, which was significantly lower compared to the experimentally determined ~10.5-fold enhancement (Table S4). To further consider the nonradiative transition process, the kic of m-NH2 (6.54 × 10¹¹ s−1) and m-NAc (9.70 × 10¹⁰ s−1) were also obtained.
Figure 4
Figure 4.
The reorganization energies (λ, cm−1) as a function of normal modes (cm−1) for m-NH2 (a), p-NH2 (b), m-NAc (c) and p-NAc (d). The dominant vibration modes with large kic values are also shown.
By considering both kr and knr, the enhancement of the corresponding QYs achieved ~12-fold, which was in good agreement with the experimentally determined 10.5-fold. Similarly, a ~6-fold enhancement of QYs was observed for p-NH2 and p-NAc, which was similar to the 4.3-fold experimental increase. It should be noted that although direct quantitative comparison of experimental and calculated QYs is not feasible, the relative enhancement factor can have significance.
Moreover, the calculated reorganization energies (λ, cm−1) as a function of normal modes (cm−1) for m-NH2/m-NAc and p-NH2/p-NAc are given in Fig. 4, and the dominant vibration modes that significantly contributed to the internal conversion process were also displayed. First, the vibration modes for all the four molecules at ~1500 cm−1 came from a combination of plane shearing motion of -NH2 and distortion of 1,8-naphthalimide. For m-NH2vs.m-NAc, it was clear that the vibration modes (i.e., nonplanar torsion of -NH2, breathing vibration of 1,8-naphthalimide induced by water molecules) located at the low frequency region (i.e., <1000 cm−1) were greatly suppressed, suggesting obviously decreased reorganization energies and kic values, and thus enhanced QYs for m-NAc after acetylation. For m-NH2vs.p-NH2, the significant contribution of reorganization energies from the low-frequency vibrations made m-NH2 possess more active nonradiative transitions and relatively low QYs. Interestingly, the vibrations corresponding to the plane shearing motion of -NH2 disappeared when the amino group was substituted with an acetyl group. Herein, we summarize that the m-NH2 is more sensitive to the surrounding water molecules and the suppression of -NH2 vibrations is one of the keys to obtaining high QYs.
Based on the above theoretical calculations, we found that the stronger CT characteristics of m-NH2 led to a large wavelength shift upon substitution, and the low-frequency vibrations of the -NH2 contributed to the fluorescence intensity change. We performed D2O and viscosity experiments to validate the effect of the meta-substituted amino group on the CT from the perspectives of the molecular structure and system environment.
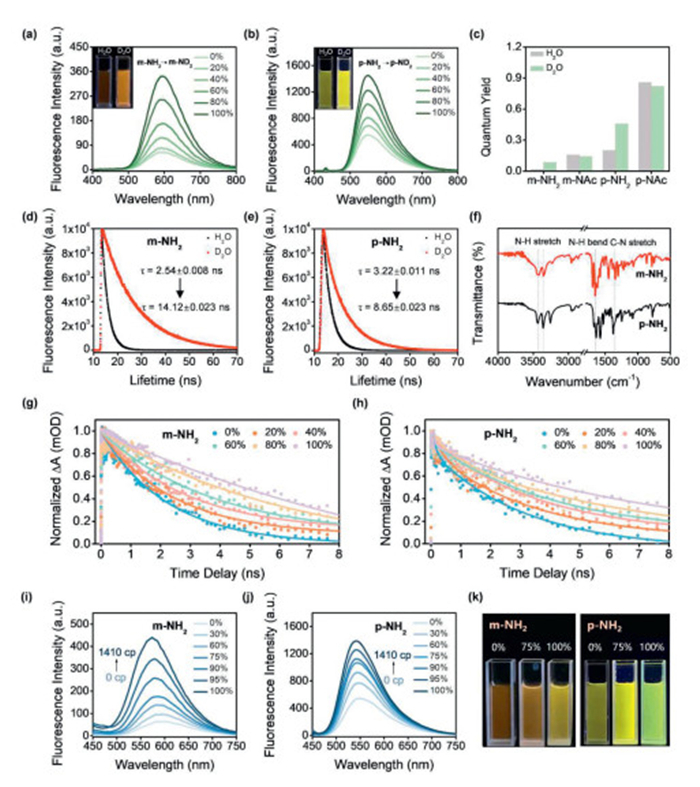
We chose D2O as the evaluation system because the rapid exchange of amino protons for deuterons occurs, according to literature reports [46]. We then measured the fluorescence intensity of m-NH2, m-NAc, p-NH2 and p-NAc in D2O/H2O mixtures of varying volume ratio. The relative fluorescence intensity of m-NH2 and p-NH2 gradually increased when the volume fraction of D2O was increased from 0% to 100% (Figs. 5a and b). With the conversion of N-H to N-D (Fig. S4 in Supporting information), the lower stretching frequency of the amino group reduces the energy loss in the non-radiative process, resulting in enhanced fluorescence. Notably, the QY of m-NH2 exhibited a nearly 5-fold increase from H2O (Ф = 0.015) to D2O (Ф = 0.084) compared to p-NH2 with an approximate 2.3-fold increase (Ф = 0.199 in H2O and Ф = 0.456 in D2O respectively) (Fig. 5c). The fluorescence intensity of m-NAc and p-NAc was basically unchanged under the same D2O/H2O mixture (Fig. S5 in Supporting information). The result strongly supports the stronger N-H vibrations of m-NH2 than p-NH2 as revealed by the theoretical calculations. Moreover, the fluorescence lifetime (τ) of m-NH2 and p-NH2 became obviously longer on transfer from H2O to D2O (Figs. 5d and e). The τ of m-NH2 increased by 5.6-fold from H2O to D2O, while the τ of p-NH2 is only increased by 2.7-fold. The excited-state dynamics of m-NH2 and p-NH2 were also investigated via transient absorption (TA) spectroscopy in D2O/H2O mixtures of varying volume ratio. As shown in Figs. 5g and h, when the proportion of D2O in the solvent mixture increased from 0% to 100%, the decay kinetics of m-NH2 became obviously slower (from 2.27 ns to 12.81 ns), and the same trend was observed for p-NH2 (from 3.16 ns to 6.59 ns). The faster decay kinetics as observed in H2O versus D2O can be attributed to the stronger -NH2 vibrations of m-NH2 and p-NH2versus -ND2 vibration.
Figure 5
Figure 5.
(a, b) Fluorescence spectra of m-NH2 (10 µmol/L) and p-NH2 (10 µmol/L) in mixtures of D2O/H2O. Insert picture: color photographs under 365 nm light in a dark room. (c) Quantum yields of four molecules in H2O and D2O. (d, e) Fluorescence lifetime decay curves of m-NH2 (10 µmol/L) and p-NH2 (10 µmol/L) in H2O and D2O. (f) FT-IR spectra of m-NH2 and p-NH2. (g) Kinetic decay of m-NH2 at 425 nm in mixtures of D2O/H2O (0%, 20%, 40%, 60%, 80%, 100% D2O) (λpump = 400 nm). (h) Kinetic decay of p-NH2 at 385 nm in mixtures of D2O/H2O (0%, 20%, 40%, 60%, 80%, 100% D2O). (λpump = 430 nm). (i, j) Fluorescence spectra of m-NH2 (10 µmol/L) and p-NH2 (10 µmol/L) in a mixture of glycerol/H2O with varying viscosity (0%, 30% wt, 60% wt, 75% wt, 90% wt, 95% wt, 100% glycerol). (k) Photographs of m-NH2 and p-NH2 in pure glycerol, the mixture of glycerol/H2O (v/v = 75:25) and in pure water under 365 nm light irradiation condition (m-NH2: λex = 345 nm, m-NAc: λex = 340 nm, p-NH2: λex = 430 nm, p-NAc: λex = 353 nm, slit: 5/5 nm).
In addition, Fourier transform infrared spectroscopy (FT-IR) was also employed. The characteristic peaks at 3300–3500 cm−1 are attributed to the stretching vibration of N-H bond, which is wider and blunter for m-NH2 than p-NH2 (Fig. 5f). The results indicate that m-NH2 has more vibration frequencies in the amino region, and its fluorescence intensity and lifetime enhancement is more pronounced when the vibrations are suppressed by hydrogen-deuterium exchange in D2O, which indicates that m-NH2 is more sensitive to changes of the environment.
Next, we tried to regulate the -NH2 vibrations by changing the viscosity of the system. As shown in Figs. 5i and k, the fluorescence intensity of m-NH2 increased 7-fold as the viscosity increased, accompanied by a blueshift of wavelength from 593 nm to 575 nm. As comparison, the fluorescence intensity of p-NH2 increased by only 2.5-fold and exhibited a slight wavelength blueshift as solvent viscosity varied (Figs. 5j and k). As the temperature drops to 0 ℃, the viscosity of glycerol further increases, also accompanied by a slight blue shift in the emission wavelength from 575 nm to 565 nm (Fig. S10 in Supporting information). The overall results demonstrated that the blueshift of emission wavelength may be due to the weaker -NH2 vibrations in the glycerol system, which weakens the charge transfer from -NH2 to the 1,8-naphthalimide aromatic ring. In low viscosity solvent, the -NH2 vibrations were not suppressed and can result in active nonradiative pathways and fluorescence quenching.
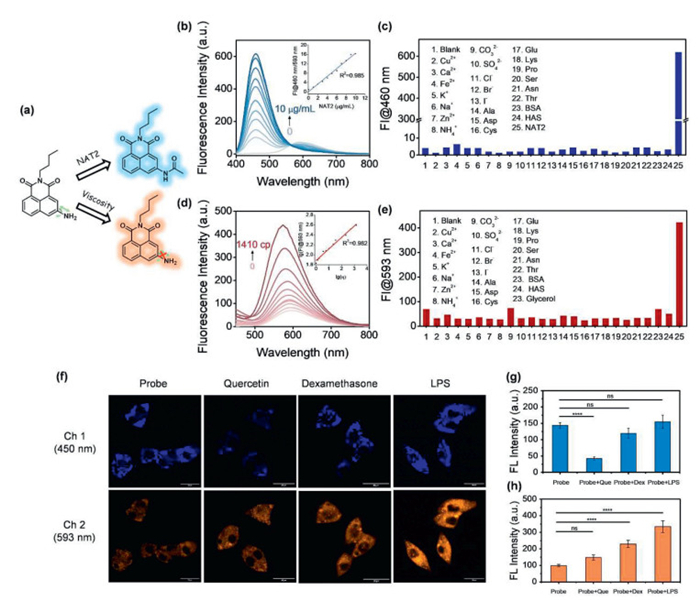
NAT2 plays vital roles in metabolism and clearance of carcinogens as a phase Ⅱ metabolizing enzyme [47]. It mainly acts on arylamine and hydrazine drugs and transfers an acetyl group from acetyl-CoA to the drugs [48–50]. While a viscous microenvironment is necessary for a variety of diffusion-mediated physiological process. Viscosity abnormalities are associated with many diseases such as inflammation and cancer [51]. Given the response of m-NH2 to viscosity and potential reaction with NAT2 means that it represents a potential dual-functional fluorescent probe for NAT2 and viscosity (Fig. 6a). Therefore, we investigated the photophysical properties of m-NH2 under simulated physiological conditions. The absorption spectra and fluorescence response of m-NH2 with the addition of various concentrations of NAT2 were measured in tris(hydroxymethyl)aminomethane hydrochloride (Tris–HCl) buffer (50 mmol/L, pH 7.4, with 0.1% DMSO and 0.05 mmol/L acetyl-CoA). After incubating with NAT2 for 15 min in the presence of acetyl-CoA as acetyl donor, the peak at 405 nm almost disappeared, accompanied by an obviously elevated absorption peak at 345 nm (Fig. S12 in Supporting information). Under excitation at 345 nm, the blue fluorescence intensity at 460 nm gradually enhanced and the ratio of intensity at 460 nm to 593 nm was up to 16-fold with NAT2 concentrations increasing from 0 to 10 µg/mL (Fig. 6b). These results indicated that phenylamine was converted to phenylacetyl by NAT2 within a short reaction time (Fig. S13 in Supporting information). Specifically, the ratio (FI460/FI593) exhibited a good linear relationship with the concentration of NAT2 with a linear correlation coefficient of 0.985 (Fig. 6b), which indicated that m-NH2 could be used for quantitative measurement of NAT2. To evaluate the specificity of m-NH2 towards NAT2, we examined its selectivity by recording the reaction with various analytes (Fig. 6c). However, only NAT2 could trigger a significant enhancement at FI460 without interference from other common amino acids and metal ions found in organisms.
Figure 6
Figure 6.
Spectral response of m-NH2 to NAT2 and viscosity. (a) Schematic illustration of simultaneous detection of NAT2 and viscosity changes by m-NH2. (b) Fluorescence spectra of m-NH2 (10 µmol/L) after incubation with different concentrations of NAT2 (0–10 µg/mL) at 37 ℃ in Tris–HCl buffer (50 mmol/L, pH 7.4, with 0.1% DMSO and 0.05 mmol/L acetyl-CoA). Insert picture: linear relationship between the ratio of fluorescence intensity at 460 nm to 593 nm and NAT2 concentration. (c) Fluorescence response of m-NH2 at 460 nm in the presence of different analytes. (d) Fluorescence spectra of m-NH2 (10 µmol/L) in glycerol/H2O mixtures with different viscosity. Insert picture: linear relationship between log (FI@593 nm) and log(η). (e) Fluorescence response of m-NH2 at 593 nm in the presence of different analytes. (f) Confocal fluorescence images of human hepatocellular carcinoma (HepG2) cells incubated with m-NH2 (10 µmol/L) only and treated with drugs (quercetin, dexamethasone and LPS). Fluorescence signals in the emission range (410–480 nm and 510–600 nm) were collected at excitation wavelengths of 405 nm (scale bar: 25 µm). (g, h) Relative fluorescence intensity of the corresponding two channels by different treatments. Data are presented as mean ± standard deviation (SD) (n = 3). ns, no significant difference. ****P < 0.0001. Student's t-test.
Since m-NH2 exhibits a significant response to viscosity in a glycerol/H2O system. As the medium viscosity increased from 0 cp to 1410 cp, m-NH2 exhibited a 7-fold fluorescence enhancement accompanied by a slight blueshift from 593 nm to 575 nm (Fig. 6d). The high viscosity solvent reduces the -NH2 vibrations resulting in fluorescence enhancement. Notably, the fluorescence intensity of m-NH2 at 593 nm exhibited a good linear relationship with viscosity of the medium with a linear coefficient of 0.982 (Fig. 6d). Moreover, only an increase in viscosity induced a significant increase of fluorescence intensity at 593 nm without any interference from other analytes (Fig. 6e). The above results confirmed the excellent dual-function of m-NH2 towards NAT2 and viscosity.
The fluorescence responses of m-NH2 to NAT2 and viscosity were investigated in human hepatocellular carcinoma (HepG2) cells for its relatively high endogenous expression of NAT2. The results of cell counting kit-8 (CCK8) assay suggested that the probe exhibited basically no cytotoxicity on HepG2 cells at experimental concentrations, confirming its high potential for cellular bioimaging (Fig. S14 in Supporting information). HepG2 cells were pre-incubated with quercetin (a known NAT2 inhibitor, 500 µmol/L), dexamethasone (a clinic drug contributed to increasing intracellular viscosity, 5 µmol/L) and lipopolysaccharide (LPS, induce the increase of intracellular viscosity, 1 µmol/L) for 30 min, followed by staining with m-NH2 (10 µmol/L) for 30 min and confocal fluorescence imaged. As shown in Figs. 6f and g, the strong fluorescence signal of blue channel was observed in cells without quercetin pretreatment, while the fluorescence signal of quercetin-treated cells was weaker. These results indicated that m-NH2 was able to be acetylated by NAT2 in living cells, which enhanced the fluorescence of its blue channel. To further confirm the viscosity-responsive properties of the probe, HepG2 cells were pretreated with dexamethasone and LPS for 30 min to change the intracellular viscosity, and then preincubated with m-NH2 for another 30 min. As shown in Figs. 6f and h, stronger fluorescence emissions were observed at the channel of 510–600 nm compared with control group. The results were consistent with the solution studies, which could be ascribed to the increased intracellular viscosity limiting the amino vibrations of m-NH2, thus resulting in strong fluorescence enhancement. The cell experiments also confirmed that m-NH2 could serve as a dual-functional fluorescent probe, which could be used in the detection of NAT2 and cellular viscosity of living HepG2 cells.
In summary, we synthesized m-NH2, p-NH2, m-NAc and p-NAc and evaluated the photophysical properties of the meta-/para-amino substituted naphthalimide. Combined with comprehensive experimental measurements and quantum chemical calculations, we demonstrated that m-NH2 exhibits a larger ICT and stronger -NH2 vibrations than p-NH2. The resulting more significant changes of fluorescence emission wavelength and intensity in m-NH2 after acetylation (m-NAc) are conducive to the design of ratiometric fluorescent probes. The potential application of m-NH2 as a dual-functional probe was evaluated in the detection both of NAT2 and viscosity. We anticipate that our research will enable a better understanding of conjugated systems with ICT characteristics at the meta-position and also promote the design of sensitive ratiometric probes with the meta-substituted 1,8-naphthalimide for advanced biological applications.
Declaration of competing interest
The authors declare that they have no known competing financial interests or personal relationships that could have appeared to influence the work reported in this paper.
CRediT authorship contribution statement
Fengzhi Wang: Writing – original draft, Validation, Investigation, Formal analysis, Data curation. Ke Hu: Writing – original draft, Formal analysis, Data curation. Jinquan Chen: Validation, Formal analysis, Data curation. Zhubin Hu: Writing – original draft, Investigation, Formal analysis, Data curation. Haitao Sun: Writing – review & editing, Validation, Supervision, Formal analysis, Data curation. Tony D. James: Writing – review & editing, Supervision, Formal analysis, Conceptualization. Yufang Xu: Writing – review & editing, Validation, Supervision, Data curation. Xuhong Qian: Writing – review & editing, Supervision, Conceptualization.
Acknowledgments
This work is financially supported by National Key Research and Development Programs (Nos. 2022YFD1700403 and 2023YFD1700303) and National Natural Science Foundation of China (Nos. 12274128 and 12250003), Shanghai Rising-Star Program (No. 21QA1402600). H.S. acknowledges the ECNU Multifunctional Platform for Innovation (001) and HPC Research Computing Team for providing computational and storage resources and the support of NYU-ECNU Center for Computational Chemistry at NYU Shanghai. TDJ wishes to thank the University of Bath and the Open Research Fund of the School of Chemistry and Chemical Engineering, Henan Normal University (No. 2020ZD01) for support.
Supplementary materials
Supplementary material associated with this article can be found, in the online version, at doi:10.1016/j.cclet.2025.110971.
[1]
Y.J. Geng, Z. Wang, J.Y. Zhou, et al., Chem. Soc. Rev. 52 (2023) 3873–3926. doi: 10.1039/d2cs00172a
[2]
D. Wu, A.C. Sedgwick, T. Gunnlaugsson, et al., Chem. Soc. Rev. 46 (2017) 7105–7123.
Figure 2
Photophysical properties of m-NH2, p-NH2, m-NAc and p-NAc. (a–d) Absorption and fluorescence spectra of four molecules (10 µmol/L) in various solvents. (e, f) Quantum yields of four molecules in various solvents. (g) Absorption (λabs) and emission maxima (λem), Stokes shifts (Δλ), molar extinction coefficient (ε) and QY (Ф) of four molecules measured in water. m-NH2: λex = 345 nm, m-NAc: λex = 340 nm, p-NH2: λex = 430 nm, p-NAc: λex = 353 nm, slit: 5/5 nm.
Figure 3
(a) Calculated HOMO and LUMO energy levels of five selected molecular dyes at the optimally-tuned-LC-BLYP*/6–311G+(d,p) level. (b) The analysis of electron-hole distribution of five molecules based on their lowest singlet excited state (S1), the D-index is defined as the distance (Å) between the centroids of the hole and electron distribution for the lowest singlet states. (c) The intramolecular charge transfer for two fragments between S0 and S1 states based on NPA.
Figure 4
The reorganization energies (λ, cm−1) as a function of normal modes (cm−1) for m-NH2 (a), p-NH2 (b), m-NAc (c) and p-NAc (d). The dominant vibration modes with large kic values are also shown.
Figure 5
(a, b) Fluorescence spectra of m-NH2 (10 µmol/L) and p-NH2 (10 µmol/L) in mixtures of D2O/H2O. Insert picture: color photographs under 365 nm light in a dark room. (c) Quantum yields of four molecules in H2O and D2O. (d, e) Fluorescence lifetime decay curves of m-NH2 (10 µmol/L) and p-NH2 (10 µmol/L) in H2O and D2O. (f) FT-IR spectra of m-NH2 and p-NH2. (g) Kinetic decay of m-NH2 at 425 nm in mixtures of D2O/H2O (0%, 20%, 40%, 60%, 80%, 100% D2O) (λpump = 400 nm). (h) Kinetic decay of p-NH2 at 385 nm in mixtures of D2O/H2O (0%, 20%, 40%, 60%, 80%, 100% D2O). (λpump = 430 nm). (i, j) Fluorescence spectra of m-NH2 (10 µmol/L) and p-NH2 (10 µmol/L) in a mixture of glycerol/H2O with varying viscosity (0%, 30% wt, 60% wt, 75% wt, 90% wt, 95% wt, 100% glycerol). (k) Photographs of m-NH2 and p-NH2 in pure glycerol, the mixture of glycerol/H2O (v/v = 75:25) and in pure water under 365 nm light irradiation condition (m-NH2: λex = 345 nm, m-NAc: λex = 340 nm, p-NH2: λex = 430 nm, p-NAc: λex = 353 nm, slit: 5/5 nm).
Figure 6
Spectral response of m-NH2 to NAT2 and viscosity. (a) Schematic illustration of simultaneous detection of NAT2 and viscosity changes by m-NH2. (b) Fluorescence spectra of m-NH2 (10 µmol/L) after incubation with different concentrations of NAT2 (0–10 µg/mL) at 37 ℃ in Tris–HCl buffer (50 mmol/L, pH 7.4, with 0.1% DMSO and 0.05 mmol/L acetyl-CoA). Insert picture: linear relationship between the ratio of fluorescence intensity at 460 nm to 593 nm and NAT2 concentration. (c) Fluorescence response of m-NH2 at 460 nm in the presence of different analytes. (d) Fluorescence spectra of m-NH2 (10 µmol/L) in glycerol/H2O mixtures with different viscosity. Insert picture: linear relationship between log (FI@593 nm) and log(η). (e) Fluorescence response of m-NH2 at 593 nm in the presence of different analytes. (f) Confocal fluorescence images of human hepatocellular carcinoma (HepG2) cells incubated with m-NH2 (10 µmol/L) only and treated with drugs (quercetin, dexamethasone and LPS). Fluorescence signals in the emission range (410–480 nm and 510–600 nm) were collected at excitation wavelengths of 405 nm (scale bar: 25 µm). (g, h) Relative fluorescence intensity of the corresponding two channels by different treatments. Data are presented as mean ± standard deviation (SD) (n = 3). ns, no significant difference. ****P < 0.0001. Student's t-test.

 DownLoad:

 下载:
下载:


 下载:
下载:
