
Scheme 1.
Schematic representation of optical LFIA from optical technology to body fluid sensing.
Optical lateral flow immune assay technology for body fluid sensing
Chen Liu , Tianqi Zhao , Jialing Zhou , Xiaoyun Hu , Dinghao Pan , Jinlong Li , Wei Li , Zhihui Dai

As an important clinical specimen source, body fluids mainly include blood, urine, saliva, cerebrospinal fluid (CSF). These fluids serve as essential sources of diagnostic diseases, as they contain a wide array of biomolecules. By assessing the molecular content of these fluids, researchers can identify biomarkers associated with a range of diseases, including cancers, infections, and cardiovascular conditions [1]. Detecting biomarkers in biological fluids is critically important for diagnosing diseases such as infections, chronic conditions, cancer, and cardiovascular diseases [2,3]. For example, high phosphorylation of tau at Ser 396,404 (p-tau396,404) and amyloid-β1–42 (Aβ1–42) in blood or CSF can be indicative of neurodegenerative disorders such as Alzheimer's disease (AD) or Parkinson's disease [4,5]. Similarly, the detection of viral antigen and cardiac troponin I (cTnI) in saliva or urine can be used to diagnose infectious diseases such as coronavirus disease (COVID-19) and influenza A virus [6,7]. Therefore, detecting biomarkers in body fluids including proteins, nucleic acids, and other biomolecules indicative of pathological conditions [8-10], are essential for identifying infectious diseases and chronic illnesses and responding to acute public health emergencies [11-13]. These biomarkers can be obtained from invasive sources (such as blood and CSF) [14-18], or non-invasive sources (including urine [19], saliva [20], and sweat [21]). Among the various techniques available for biomarker detection, optical lateral flow immune assay (LFIA) technology can observe the optical signal change from the colloidal gold to realize rapid detection [13]. LFIA is a paper-based detection and quantitative analysis platform that has gradually become an essential tool for clinical body fluid sample testing due to its simple operation, high sensitivity, and rapid detection [22,23]. Unlike more complex laboratory-based methods such as Lab-on-a-Chip [24] or Lab-on-a-Disc [25], LFIA does not necessitate sophisticated equipment or highly trained personnel, making it suitable for home, on-site, and point-of-care testing (POCT).
The LFIA strip is mainly composed of a sample pad, a conjugate pad, a nitrocellulose membrane (NCM), and an absorbent pad (Scheme 1) [22,26]. The immunoassay captures analytes in liquid samples via antigen-antibody reactions, forming a complex containing signal and recognition units that migrate to the test line (T line) and control line (C line) on the NCM for optical sensing [23]. Traditional LFIA relies on observing color changes at the T/C lines due to the aggregation of AuNPs. Detection techniques including colorimetry (COL) [27,28], surface-enhanced Raman scattering (SERS) [16,29,30], and fluorescence (FL) [31-35], afterglow (AG) [36-38], chemiluminescence (CL) [39,40], and electrochemiluminescence (ECL) [41,42] have proven effective for applications in pregnancy testing and COVID-19 diagnostics. However, these methods often fail to provide the comprehensive information required for diagnosing complex diseases such as AD and other diseases necessitating multi-marker analysis [43]. To address the limitations, optical signal hyphenated such as COL-SERS [44,45] and FL-magnetic (FL-MAG) [46,47], have been proposed to enhance the sensing performance of optical LFIA strips and facilitate the quantitative analysis of biomarkers. These innovations are represented in Scheme 1. Optical LFIA expands the potential applications of LFIA in complex disease diagnosis and multi-biomarker detection scenarios by enabling more precise and quantitative biomarker analysis.
To date, numerous research groups have dedicated their efforts to developing novel optical LFIA technologies for exploring the diagnostic potential of various biomarkers in different body fluids [48]. Therefore, a thematic summary is highly desirable to outline the significant progress made in utilizing optical LFIA for rapid and accurate biomarker sensing in body fluids, providing readers with a comprehensive understanding and valuable data for researchers aiming to design high-performance optical LFIA systems. Unfortunately, existing reviews on optical LFIA applications primarily focus on food [49], allergens [50], pathogens [51,52], bacteria [53,54], and fungi (mycotoxins) [55]. Consequently, there remains a lack of comprehensive reviews specifically focusing on the integration of optical LFIA technologies in body fluid analyses and their enhanced diagnostic capabilities. Herein, we aim to provide a systematic and comprehensive overview of recent advances in optical LFIA technology applied to body fluid testing along with its clinical applications. First, various single optical signal technologies with fast detection and many optical signal hyphenated technologies with high precision in T/C lines are discussed in optical LFIA. Next, the biomarker sensing of optical LFIA in human body fluids is comprehensively presented in both invasive and non-invasive aspects. Finally, this work presents challenges and perspectives for LFIA and inspires designing next-generation diagnostic platforms with accuracy, accessibility, and integration.
New LFIA strip technology has emerged to extend its application scenarios, such as SERS, AG, FL, and even signal hyphenated technology. While these technologies reducing their accessibility, portable FL or CL readers, some of which are already being integrated into POC diagnostic devices, are becoming increasingly compact, affordable, and user-friendly. To this end, we summarized the characteristics of different optical technologies and their corresponding application scenarios, as shown in Table S1 (Supporting information). So, this section for optical LFIA strips discussed in detail the research progress of single signal and hyphenated signal technology in LFIA T/C lines.
Single optical signal LFIA technology includes low cost and simple operation for detection by the optical signal change from signal units. Now, various signal materials have been developed as nanocomposite [56,57], quantum dot (QD) [58], nanozyme [36], and up-conversion nanoparticles (UCNPs) [59], which have been widely used in disease marker detection. Therefore, we have introduced single-signal LFIA test strips based on the characteristics of the optical signal. This includes COL, SERS, FL, AG, CL and ECL.
COL-LFIA strip has rapidly become one of the most popular POCT by recognizing the signal change from colloidal gold nanoparticles (AuNPs) via the naked eye [22]. As early as 1971, Faulk and Taylor pioneered the nanogold immunolabeling technology by combining rabbit anti-salmonella antiserum with AuNPs using immunogold staining to detect the surface antigens of Salmonella by direct immunocytochemistry [60]. Nowadays, the nanoparticles have developed multiform, such as nanoshells [61], nanoflowers [62], nanocages [63], nanozymes [64], and nanorods [65], resulting in increasing localized surface plasmon resonance (LSPR, the LSPR peaks of reciprocal oscillations produced by light irradiated at nanoparticle) [14]. Therefore, the above signaling materials are widely used in COL-LFIA.
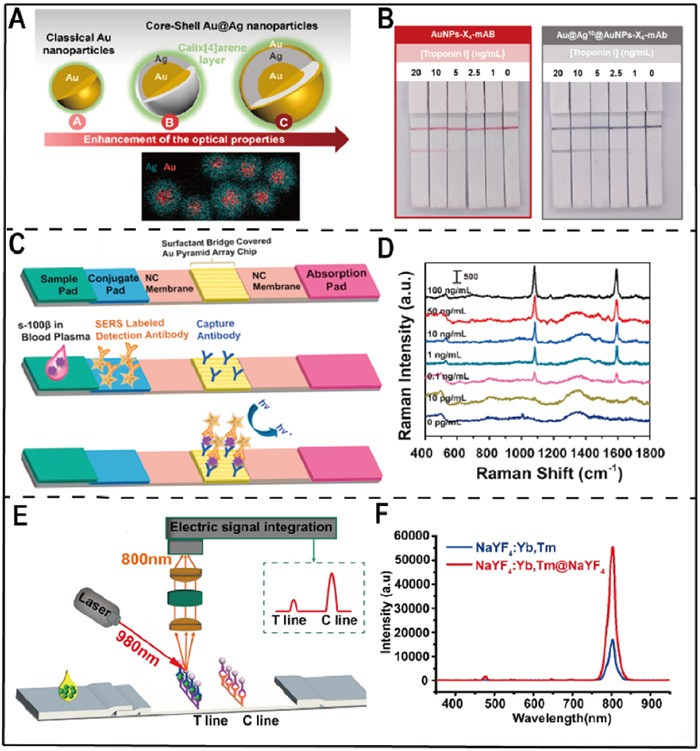
The morphology and size of AuNPs determine the properties of LFIA. For example, Scholz et al. [27] provided coupling of multicolor AuNPs by varying silver nitrate content. And Gosselin et al. [66] controlled the thickness of the silver shells by the growth of AuNPs on the surface of the shells (Fig. 1A), resulting in a strong color contrast on the NCM (Fig. 1B). So, the morphology of AuNPs affect the sensitivity. Moreover, Chen et al. [67] studied the size effect of AuNPs and found that 80 nm AuNPs outperformed 40, 60, and 100 nm, suggesting that larger AuNPs with greater surface area enhance antibody binding and sensitivity.
Nanozymes can catalyze 3,3′,5,5′-tetramethylbenzidine (TMB) to obtain oxidized TMB displaying a blue color, which can be designed for COL-LFIA strips [64]. For example, Kong et al. [36] developed a LFIA using cerium oxide nanoceria with oxidase activity to oxidize TMB into a colored product, eliminating the need for H2O2. The LFIA produced two blue lines in the detection and control regions within 3 min.
Researchers have developed novel LFA methods to improve performance by controlling fluid flow in wax printing. For instance, Sena-Torralba et al. [68] printed wax on the T-line selectively accumulated the target for human immunoglobulin G (IgG) detection. The target and assay probe flowed into the wax barrier, where they temporarily stayed until the barrier ruptured. Wax printing increased sensitivity 51.7-fold compared to AuNP-based LFIA by extending the coupling reaction time. In addition, the same effect could be achieved by combining an LFIA diverter with a polydimethylsiloxane barrier to optimize the delay rate of the fluid for increased sensitivity [69].
COL-LFIA is user-friendly, fast, and cost-effective, making it ideal for infectious diseases and emergency diagnoses in clinical applications. However, its lower sensitivity and qualitative nature limit its ability to accurately detect low biomarker concentrations and provide precise quantification.
SERS, an ultrasensitive molecular sensing technique, overcomes the weak signal and low sensitivity of traditional Raman methods [70]. For example, Gao et al. [16] established multistage three-dimensional (3D) plasmonic nanostructures called “hot spots” to amplify the SERS-LFIA signals by combining gold nanopyramid arrays on a quartz substrate for high sensitivity detection (Fig. 1C). SERS-LFIA was detected with the limit of detection (LOD) at 5 pg/mL level (Fig. 1D). Moreover, Lin et al. [71] established the SERS signal unit as two-dimensional black phosphorus with Ag nanoparticles, called Ag/BP nanosheets, which can also replace AuNPs for the detection of severe acute respiratory distress syndrome coronavirus 2 (SARS-CoV-2).
SERS-LFIA offers high sensitivity and specificity for detecting low-concentration biomolecules, making it ideal for disease detection. However, its complex surface preparation and data analysis requirements limit its use in POCT.
FL-LFIA is valuable in clinical diagnosis due to its low background interference and efficient quantitative sensing [72,73]. FL molecular probes consist of the receptor as recognition binding groups and the fluorophore as signal emitting groups [74,75]. Based on the emission wavelength range of fluorophore [76], we summarized the research progress of FL-LFIA according to the visible (400–780 nm) and near-infrared (NIR, 680–1870 nm).
For example, Bian et al. [77] developed organic luminogens with aggregation-induced emission (AIEgens)-embedded polystyrene (PS) nanoparticles. The PS encapsulation increased FL by over 10-fold, enabling easy and accurate semi-quantitative detection with a visible 490 nm emission. Similarly, Ji et al. [59] developed NaYF4:Yb/Tm@NaYF4 core-shell UCNPs with NIR emission at 800 nm under 980 nm excitation, which avoids the autofluorescence and light scattering common (Fig. 1E). The β-NaYF4 matrix enhances light-emitting efficiency, with a 4-fold increase in emission (Fig. 1F).
FL-LFIA provides low background interference and precise quantification, making it ideal for sensitive applications like biomarker detection. As is known to all, its reliance on specialized equipment, environmental sensitivity, and potential photobleaching limit its use in resource-limited or POCT. However, recent advancements in miniaturization and portability of optical devices such as portable fluorescence readers are actively addressing these limitations.
AG materials absorb and store excitation energy, emitting light after excitation ends, thus avoiding autofluorescence interference [78,79]. Recently, AG molecular probes, including inorganic and organic materials, have been developed to enhance the sensitivity and accuracy of LFIA by providing interference-free sensing. For example, Gao et al. [80] designed an LFIA strip using Zn2GeO4: Mn2+ persistent luminescent nanoparticles enable COL and highly sensitive AG detection without background FL interference.
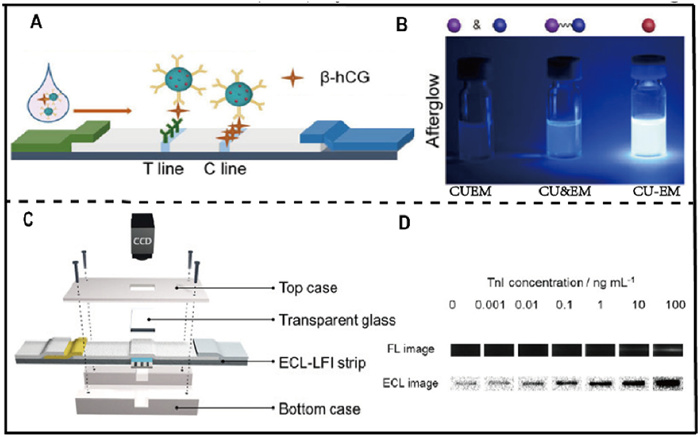
Organic AG luminescence probes have been developed as gradually popular fields for LFIA strips due to their excellent biocompatibility and degradability [81]. The AG photosensitizer is excited and produces singlet oxygen for energizing the AG substrate to produce emission by physical mixing [78]. At the same time, the organic AG signal is also realized by molecular fusion. For example, Su et al. [82] developed a blue AG system for the LFIA of β-hCG with a low LOD of 0.34 mIU/mL by synthesize a molecular probe called CUEM (Fig. 2A). The AG efficiency of CUEM was improved by more than 100-fold and 10-fold compared to physical mixing (CU&EM) and covalent coupling (CU-EM), respectively (Fig. 2B). Further, Hao et al. [78] developed AG nanoprobes using aggregation-induced emission (AIE) dyes and CL substrates, showing 256-fold higher sensitivity than AuNPs in LFIA.
AG-LFIA provides background interference-free detection, high specificity, and extended detection windows for low-abundance targets. However, it requires specialized equipment for signal readout, increasing costs and limiting use in POCT, and the AG signal may fade over time, reducing sensitivity.
The CL immunoassay technique involves conjugating an enzyme to an antibody or antigen, which, upon reacting with its target, catalyzes a chromogenic reaction for qualitative or quantitative detection [83-85]. The biomarker is temporarily limited to antigen-antibody strategy, but the introduction of dual-signal nanomaterials, multi-recognition-type antibodies, and another strategy to provide a broad prospect for CL-LFIA. For example, Ren et al. [37] developed a highly sensitive CL-LFIA platform using AuNPs-Ab-HRP-PEG coupling, where polyethylene glycol reduced non-specific interactions, and HRP catalyzed a strong chemiluminescent signal, enhancing detection sensitivity via CMOS camera imaging.
CL-LFIA offers high sensitivity for low-concentration analytes, making it ideal for early disease detection. However, CL-LFIA has some limitations, including a narrow dynamic range, complicating accurate quantification at high concentrations.
ECL is an ultra-sensitive analytical technique with advantages such as a wide detection range, fast analysis, making it ideal for biomarker detection. The Ru(bpy)32+ system, known for its high quantum yield and stability, has been successfully commercialized, and its integration with LFIA is expected to address the limitations of traditional LFIA [86]. In previous studies by Min-Gon Kim's group, the ECL-LFIA probe using mesoporous silica nanoparticles loaded with Ru(bpy)32+ achieved highly sensitive and quantitative detection of troponin I (Figs. 2C and D) [87]. New ECL-LFIA systems was developed to detect the ECL signals in the presence of Ru(bpy)32+. However, early ECL-LFIA systems required a two-step assay procedure to acquire the ECL signal and suffered from nonspecific binding due to the 200-nm-sized silica nanoparticles. The smaller AuNPs allowed for a single-step assay and reduced non-specific signals to overcome the above limitations by synthesizing Ru(bpy)32+ labeled AuNPs at 20 nm [86]. Single-step ECL measurements using AuNPs couplers for C-reactive protein (CRP) assays were proven feasible, with immobilized antibodies and AuNPs as targeting probes and ECL markers. This optimized ECL-LFIA system enabled highly sensitive dual electrochemical and ECL detection.
ECL-LFIA uses electrochemical reactions to generate light, enabling high-resolution detection and precise quantification of analytes, making it ideal for clinical diagnostics and biomarker monitoring. Unfortunately, its reliance on specialized equipment and advanced tools for signal interpretation limits its accessibility and increases costs, especially in resource-limited or POCT.
The single optical signal LFIA technology was typically visual to limit the diversity and informativeness of the decision results. Optical signal hyphenated LFIA technology combines multiple detection methods, such as COL hyphenated FL [40]/CL [84]/SERS [5]/photothermal (PT) [88], SERS hyphenated FL [89]/PT [39]/MAG [90], FL hyphenated MAG [46], and even multi-method hyphenated to realize multi-signal or simultaneous detection of a single target [91-93].
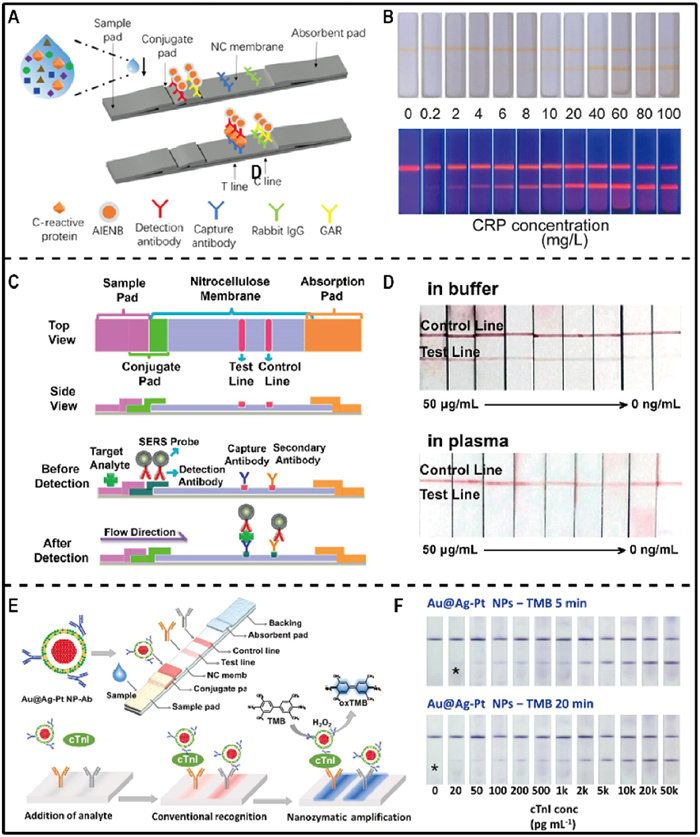
(1) COL hyphenated FL and CL. COL technology is widely used for rapid detection, but it lacks quantification capabilities, so it is combined with optical materials like FL and CL [84,93]. For example, Fan et al. [40] developed red AIE nanobeads (AIENBs) for CRP detection (Fig. 3A), enabling visual detection with a limit of 8.0 mg/L and down to 0.16 mg/L via FL (Fig. 3B). Roda et al. [84] introduced a dual-method COL-CL system (Fig. 3C), using AuNPs for COL detection with a smartphone camera and CL detection with a portable charge coupled device (CCD) device (Fig. 3D).
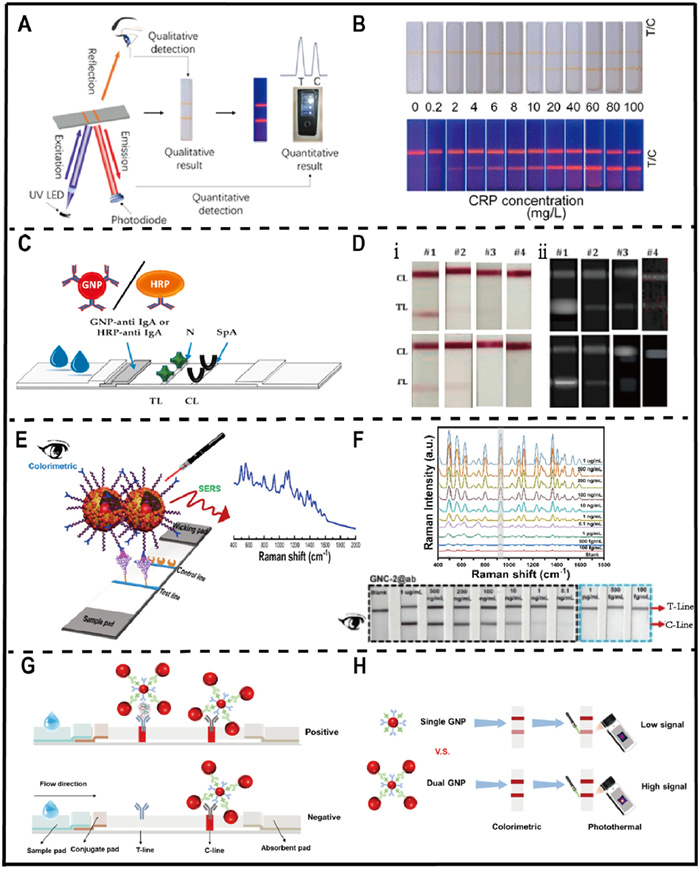
(2) COL hyphenated SERS. SERS signals depend on the interaction between nanoparticles and reporter molecules, and combining COL methods with SERS enhances detection sensitivity. For example, Atta et al. [44] created a gold nanocrown (GNC) structure for S1 protein detection (Fig. 3E), using AuNPs and Ag interstitials to generate strong SERS and COL signals (Fig. 3F). Similarly, Yu et al. [94] developed a MoS2@Au-Au dual-signal platform for detecting monkeypox virus, offering rapid visual detection and ultrasensitive quantitative analysis with portable SERS spectroscopy.
(3) COL hyphenated PT. COL-PT enhances sensing performance by utilizing plasma oscillations in metal nanoparticles, which absorbs light and releases energy as luminescence or heat [95]. For example, Li et al. [96] developed a dual-mode LFIA using Au nanoshells on Fe3O4 nanoclusters, where the PT signals were significantly enhanced by Au enrichment. Similarly, Huang et al. [88] synthesized dual gold nanoparticle couplers (DGNPs) for LFIA (Fig. 3G), improving COL sensitivity by 10.7-fold and PT sensitivity by 255.3-fold (Fig. 3H).
(1) SERS hyphenated FL. Researchers have explored integrating SERS and FL techniques into nanoparticle probes to enhance measurement precision and specificity [97,98]. For example, Li et al. [99] developed an aptamer-based LFIA sensor using a Cy3-cDNA/aptamer double-stranded gold nanostar, which combines FL and SERS detection (Fig. 4A). When the target binds, the aptamer dissociates from the cDNA, causing FL quenching and SERS enhancement.
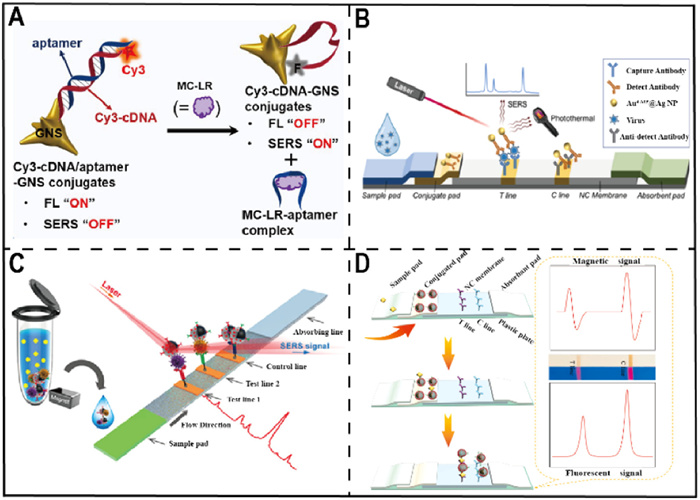
(2) SERS hyphenated PT. SERS hyphenated PT detections are also innovative technologies. For example, Liang et al. [39] developed a novel LFIA method using bimetallic Au4-ATP@AgNPs, combining SERS and PT effects. These nanoparticles generated strong SERS signals and significant PT signals under NIR laser, producing temperature changes for dual-mode detection (Fig. 4B).
(3) SERS hyphenated MAG. Wang et al. [90] developed MAG-SERS LFIA strips using dual-dye-loaded Ag-coated Fe3O4 MNPs (Fe3O4@Ag). These strips are 2000-fold more sensitive than traditional AuNPs strips, and can be applied directly to biological samples without pretreatment, significantly enhancing detection performance through MAG and SERS integration (Fig. 4C).
FL-LFIA provides a single FL signal with high sensitivity, but it is susceptible to background color and environmental interferences [100]. Thus, the introduction of a MAG signal as an auxiliary detection to form the FL hyphenated MAG technology can enhance the quantitative analysis performance and improve the anti-interference ability [101]. Herein, Shang et al. [101] designed and fabricated composite nanoparticles based on CsPbBr3 perovskite QDs, to combine FL detection and MAG enrichment for sensitive LFIA. The CsPbBr3 QDs provided high FL yield, while the SiO2 coating improved stability and bio-modifiability, and Fe3O4 nanoparticles enhanced sensitivity and reduced matrix interference through MAG enrichment. In addition, Xie et al. [46] developed novel FL hyphenated MAG dual-modal LFIA for the detection of SARS-CoV-2 nucleocapsid protein, using MAG Fe3O4 as the inner core and PEI modulated QDs to enrich its shell (Fig. 4D).
In recent years, multi-method hyphenated optical technology has become a powerful approach in the field of LFIA [102]. The traditional COL with various methods, such as SERS, FL, and PT improves overall sensitivity and specificity, and broadens the range of analytical applications, to work with complex samples and obtain more reliable results. So, the multi-method hyphenated technology is proposed as “three-in-one” [91,103,104] or “four-in-one” [93]. Li et al. [102] developed a “three-in-one” LFIA platform using Zn-CN@Nb26-EGFP-H6 as the optical unit with COL-SERS-PT signals. This system combined a self-assembled multivalent FL nanobody and a pyrolyzed oxidized imidazolium zeolite framework-8. The results demonstrated that this LFIA strip enabled efficient and accurate rapid assays. Similarly, Lin et al. [103] created a plasmonic gold nanostars@Raman@platinum oxide nanoclusters (Au@Raman@PtOs) for LFIA. Using platinum oxide bimetallic doping, Au@Raman@PtOs exhibited enhanced SERS, nano-enzymatic catalytic activity, and superior PT effects compared to gold nanostars. Excitingly, Wang et al. [93] introduced a “four-in-one” multimodal LFIA based on multifunctional dandelion-like gold@platinum nanoparticles (MDGPs). The unique properties of MDGPs—broad absorption spectra, porous nanostructures, and bimetallic composition—enable overlapping dual-spectrum FL, optical readout, catalytic activity, and PT effects. This versatility allows MDGP-LFIA to produce multimodal outputs (catalytic, FL, COL, and PT signals).
Signal-hyphenated LFIA boosts sensitivity by integrating multiple signal modes, enabling detection of lower analyte concentrations and broader applications. However, it is more complex and costly than single-signal LFIA, requiring specialized equipment.
Body fluids refer to the various liquids present within the human body [105], including blood [106], CSF [107], urine [108], saliva [109], and sweat [21]. These body fluids contain a wealth of biomarkers, which are molecules that can reflect the state of the body and the presence of diseases, such as enzymes [110], hormones [111], and metabolites [112]. Detecting biological markers in body fluids is crucial for providing insights into disease diagnosis and enabling early detection for timely intervention. Rich biomarkers containing the marker SARS-CoV-2, microRNA (miRNA), hepatitis B virus (HBV) [69,113], alpha fetoprotein (AFP) [13], carcinoembryonic antigen (CEA) [114,115], and prostate-specific antigen (PSA) [5,116,117] in human body fluids can be quickly detected by LFIA strips. And body fluids are categorized into intrusive biofluidic (blood, CSF) and non-invasive biofluidic (urine, saliva, sweat) sensing according to the source. To this end, the main achievements of optical LFIA applications in body fluids sensing as shown in Table S2 (Supporting information). This section introduced typical biomarkers detection in body fluids.
Invasive body fluids are essential in medical diagnostics, as they offer direct access to pathophysiological processes, providing specific, sensitive insights into disease states for early diagnosis, disease progression monitoring, and prognostic assessment [14]. LFIA technology significantly enhances the detection of biomarkers in invasive body fluids. It offers rapid results, POCT capabilities, simplicity, cost-effectiveness, and versatility [118], such as PSA in whole blood and serum and cTnI in serum and plasma [5,15,116]. Thus, we introduced important representative biomarkers in blood [119-121] and CSF [122] based on LFIA strip sensing in this section.
(1) Hepatitis B virus and COVID-19 biomarker in blood. So far, human beings have not been completely rid of respiratory diseases and cancer [123]. Therefore, rapid detection of HBV or SARS-CoV-2 associated with lung disease, as well as PSA or CEA associated with cancer, is particularly important for timely detection and treatment of these diseases. Hepatitis B, a common infectious disease, is caused by HBV [124,125]. For instance, Panferov et al. [113] developed a signal enhancement method for LFIA using electrophoresis to control biotin and streptavidin functionalized AuNPs. By altering the surface charge of target molecules with GNPs, the migration rate in the electric field was modified, enhancing signal detection. This reduced the LOD of HBV surface antigens from 8 ng/mL to 0.12 ng/mL, improved sensitivity from 73% to 98%, and maintained 95% specificity in serum and plasma. COVID-19 caused by the SARS-CoV-2 has spread globally over the past few years, resulting in serious health threats [126,127]. Therefore, timely detection of SARS-CoV-2 allows early detection and treatment to minimize losses using low cost LFIA. For example, Tong et al. [23]. proposed an AI-assisted COL polydopamine (PDA) LFIA for the sensitive quantification in human serum, using spike proteins from SARS-CoV-2 and receptor-binding domains from mouse IgG attached to PDA probes. Detecting SARS-CoV-2 specific IgM, IgG, and IgA in human serum and plasma is an alternative method for diagnosing COVID-19. For example, Chen et al. [31] developed AIE810 nanoparticles as FL reporters of LFIA (Fig. 5A), effectively eliminating autofluorescence from NCM and biological samples (Fig. 5B). The results showed that AIE810 showed 78% sensitivity for IgM and 95% for IgG, outperforming AuNPs strips.
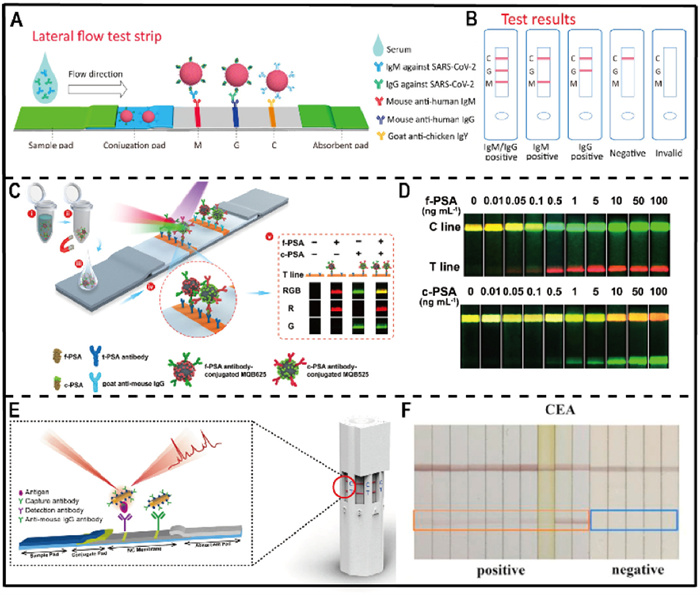
(2) Cancer biomarkers in blood. Early detection of cancer biomarkers using LFIA, such as PSA [128], CEA [114], and AFP [115] assists to save lives in the prevention, diagnosis, monitoring and treatment of cancer [116]. Particularly, the detection of free PSA (f-PSA) and complex PSA (c-PSA) is essential for accurate diagnosis of PSA. For example, Rong et al. [128] produce the recognition probes as magnetic-quantum dot nanobeads with 625 and 525 emissions by polyethy-leneimine and coupled with f-PSA antibody and c-PSA antibody, producing dual-functional with FL and MAG enrichment (Fig. 5C). Under UV light, the T lines of the LFIA strips used for f-PSA and c-PSA detection showed red and green FL, respectively. At the same time, the T line of their mixture was yellow due to the merging of red and green FL emission. The LOD of f-PSA and c-PSA in the assay of clinical serum samples were 0.009 and 0.087 ng/mL (Fig. 5D). Elevated AFP levels can indicate malignant (e.g., liver, ovarian, testicular) or non-cancerous (e.g., cirrhosis, chronic hepatitis) tumors, making its detection useful for screening and diagnosis [129]. In addition, Xiao et al. [115] developed a portable, multiplexed SERS-LFIA platform for simultaneous detection of AFP, CEA, and PSA, achieving dual Raman and visual signals. The method had a LOD of 0.01 ng/mL, lower than the visual signal detection (Figs. 5E and F).
(3) C-reactive protein biomarker in blood. CRP is an acute-phase reactant. CRP activates complement and enhances phagocytosis, playing a key role in the immune response by clearing pathogens and damaged cells [2]. Fan et al. [40] developed a dual-reading LFIA system for rapid CRP detection using AIENBs with FL and COL properties (Fig. 6A), achieving detection down to 8.0 mg/L visually and 0.16 mg/L fluorometrically (Fig. 6B).
(4) Traumatic brain injury (TBI) biomarker in blood. TBI is a neurological deficit caused by head trauma with high mortality and disability rates. Currently, the diagnosis of moderate or severe TBI relies on MAG resonance imaging [29], which is costly and inefficient to use in emergencies. In the case of TBI, S-100β, ubiquitin carboxy-terminal hydrolase-L1 (UCH-L1), neuron-specific enolase (NSE) blood biomarkers have been developed. For instance, Gao et al. [29] created nanoparticles to detect NSE in plasma with an LOD of 0.86 ng/mL (Fig. 6C), well below the threshold of 12.4 ng/mL (Fig. 6D), making SERS-LFIA unsuitable for clinical NSE testing in TBI. To enhance sensitivity, Gao et al. [130] targeted S-100β, a key TBI biomarker, using gold nanopyramids to create “hotspots” that enhanced the SERS signal. This LFIA approach improved the LOD for S-100β to 5.0 pg/mL.
(5) cTnI biomarker in blood. The use of myocardial biomarkers has become a reliable method of confirming the diagnosis of AMI due to the difficulty in recognizing the signs and symptoms of AMI [131]. Bai et al. [15] developed Au@Ag-Pt nanorattles as plasmonic nanozymes to enhance cTnI detection (Fig. 6E). The Au@Ag-Pt NPs LFIA strips detected cTnI in the range of 20–1000 pg/mL, with a low LOD of 20 pg/mL (Fig. 6F).
Serum, plasma can easily be obtained, but these liquids are susceptible to exogenous factors, and therefore only weakly representative of central nervous system disorders [106]. Lumbar puncture of CSF is more invasive but can be used as a source of biomarkers for chronic neurological diseases [132]. This capability is particularly advantageous for diagnosing diseases such as AD, CSF leakage. For instance, AD can be detected through biomarkers such as Aβ1–40, Aβ1–42, and the p-Tau for AD diagnosis present in CSF [107]. CSF leakage can be identified by detecting beta-trace protein (BTP), a specific marker for CSF, which allows for early detection and prevention of complications such as infections and severe headaches [133].
AD is a chronic neurodegenerative disorder that may develop 20–30 years before clinical symptoms appear, leading to brain atrophy and cognitive decline [134]. Early diagnosis is crucial, and biomarkers such as β-Amyloid and β-trace proteins are key for screening at-risk populations. For example, Zhang et al. [107] developed a dual-target LFIA using anti-Aβ42 monoclonal antibodies (1F12 and 2C6) for rapid detection of Aβ42 in CSF or blood within 30 min (Fig. 7A). The LOD was 154 pg/mL by visual observation (Fig. 7B), with results similar to enzyme-linked immunosorbent assay (ELISA).
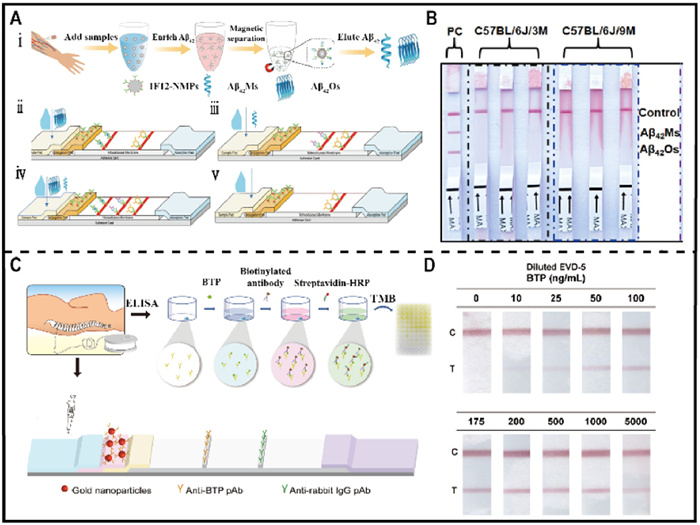
CSF leakage is a common complication of spinal surgery, potentially leading to headaches and meningitis, which can be minimized with proper treatment [135]. While CSF leakage can be diagnosed through clinical symptoms and imaging, incidental intraoperative detection remains challenging [133]. In response, Chou et al. [133] developed a highly sensitive stacked pad LFIA for the quantitative detection of the CSF-specific marker BTP, using a AuNPs-anti-BTP antibody conjugate in an antigen-antibody sandwich format (Fig. 7C). A diluted clinical sample was added to the sample pad, and after 15 min (Fig. 7D), the color intensities of the T- and C-lines were captured and analyzed using ImageJ software. This LFIA allowed surgeons to monitor the quality of dural repair through serial testing of postoperative drainage samples.
Invasive biofluids necessitate complex puncture procedures and stringent disease control measures [136], but their use is limited due to discomfort and inconvenience, requiring specialized personnel for routine monitoring and rapid diagnostics [137]. On the other hand, non-invasive biofluids such as saliva, urine, and sweat are easily collected for home monitoring and rapid clinical diagnostics [138]. They require less complexity in collection conditions and are more acceptable to patients, enhancing compliance and comfort. Therefore, this section introduces typical biomarkers for urine, saliva and sweat based on LFIA strip sensing.
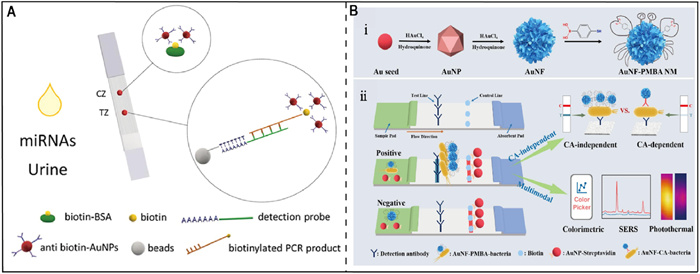
Urine is a crucial non-invasive biofluid utilized in medical diagnostics due to its ease of collection, which reflects the body metabolic state and provides insights into disease presence [138-140]. Representative biomarkers in urine include miRNAs [141] associated with tumor growth and metastasis for diagnosing Escherichia coli (E. coli) in urinary bacterial infections [142]. For instance, Lamprou et al. [142] developed a universal LFIA combining reverse transcription-polymerase chain reaction (RT-PCR) and AuNPs to detect miR-21 and miR-let-7a in urine (Fig. 8A), achieving detection of 100–1000 copies of miR-21 and 100–10,000 copies of miR-let-7a with high specificity and reproducibility. E. coli is the leading pathogen in urinary tract infections (UTIs), responsible for about 90% of cases [143]. The need for rapid, sensitive diagnostic methods for UTIs highlights the importance of LFIA for POCT. Traditional LFIA relies on costly, hard-to-store capture antibodies. To address this, Wu et al. [91] developed a multimodal LFIA (MCI-LFIA) using p-mercaptophenylboronic acid-modified gold nanoflowers (AuNF-PMBA) for rapid UTI diagnosis without capture antibodies. The method achieved a LOD of 10³ cfu/mL for E. coli, three orders of magnitude lower than conventional methods, and detected E. coli in urine within 45 min with high accuracy and reproducibility (Fig. 8B).
Saliva is an important non-invasive biofluid that offers immense potential for disease diagnostics due to its simplicity of collection and the inclusion of multiple biomarkers [144]. These biomarkers that include proteins [7], macromolecular [145], antigens [146], and miRNA [147] are closely associated with the onset and progression of various diseases. Studies have shown that SARS-CoV-2 can be detected in saliva, while salivary cTnI indicates myocardial injury and serves as a marker for cardiovascular diseases. Salivary cortisol is a well-established marker for stress-related infections [148]. LFIA technology offers significant advantages in salivary diagnostics due to its simplicity, rapidity, and cost-effectiveness. For example, Wang et al. [20] developed a novel LFIA method using a MAG-FL nanofilm (GF@DQD-APBA) coupled with 4-aminophenylboronic acid (APBA) on a non-antibody-modified nanoprobe. This probe efficiently captured viral glycoproteins (GPs), achieving detection limits of 0.93 pg/mL for MPXV envelope proteins and Ebola virus (EBOV)—500-fold and 200-fold lower than traditional AuNP-based LFIA and ELISA (Figs. 9A and B).

Cortisol can be measured in plasma, urine, saliva, and hair, with saliva being preferred for its ease of collection and no need for specialized personnel [149]. Nardo et al. [148] examined three strategies as covalent binding, non-specific coupling, and protein receptor-mediated coupling with SPA for coupling antibodies to GNPs (Fig. 9C). Their LFIA for cortisol in saliva showed comparable performance across these methods, with sensitivity largely depending on antibody amount and probe stability (Fig. 9D).
Sweat is an emerging non-invasive biofluid with great potential for disease diagnostics due to its easy collection and wide range of biomarkers [150-152]. These biomarkers, encompassing electrolytes, metabolites, proteins, and hormones, are intricately linked with the initiation and progression of various diseases [153]. The utilization of LFIA technology in sweat diagnostics confers notable advantages owing to its simplicity, rapidity, and cost-effectiveness. For instance, LFIA can swiftly quantify morphine levels in sweat for drug addiction screening while also detecting glucose and lactate for metabolic health assessment.
Chen et al. [21] developed a rapid morphine screening method using enhanced signal LFIA strips (Fig. 9E). SiO2@Au-1 was used for antibody labeling due to its stronger plasmonic signal, reducing antibody consumption while maintaining clear COL signals on the T-line. By controlling antibody use, even trace amounts of morphine could be detected, distinguishing negative from positive results (Fig. 9F).
Recent advancements in LFIA technology have improved signal response, antigen-antibody interactions, and material optimization. This review covers the signals, mechanisms, and recent developments of LFIA for detecting body fluids from both invasive (blood, CSF) and non-invasive (urine, saliva, sweat) sources. It also discusses factors influencing optical LFIA techniques, along with their challenges and prospects. Optical LFIA has made significant progress in clinical body fluid analysis, providing high sensitivity and specificity for rapid detection of pathogens, proteins, and biomarkers. These advances have been applied to diagnosing cancer and other conditions. The challenges and technical limitations left by these advances point us to many future directions and efforts in LFIA.
(ⅰ) Cost and material selection: AuNP-based LFIA has proven effective in clinical diagnostics, especially for rapid screening of infectious diseases like COVID-19 [31], due to its low cost and high sensitivity. AuNPs enhance detection performance through LSPR [14], making LFIA widely used. Future research should focus on diversifying materials to improve both sensitivity and cost-effectiveness. Developing new, cost-efficient nanomaterials or optimizing AuNPs synthesis could further expand LFIA clinical use.
(ⅱ) Multiplexing technology: Multiplexed LFIA enables simultaneous detection of multiple biomarkers, expanding its use in complex diseases like AD. However, increasing detection lines can complicate strip fabrication and cause cross-reactivity. Advancements in microfluidics and novel probes can improve accuracy, with future research focusing on optimizing assay design.
(ⅲ) Antibody-free detection: Traditional LFIA relies on antibodies, but challenges like batch variation and instability persist. Alternatives such as aptamers, cyclodextrins, and CRISPR/Cas systems could improve specificity, reduce costs, and enable rapid antibody-free detection, especially for clinical body fluid analysis.
(ⅳ) Regulatory approval and mass manufacturing: Obtaining certifications like Food and Drug Administration (FDA) approval or Conformity European (CE) marking can be time-consuming and costly, especially for small enterprises. Additionally, scaling up LFIA production while maintaining quality and performance consistency is difficult, as tests must be cost-effective for use in low-resource settings. Ensuring accurate, reliable performance across batches requires stringent quality control, as variations in raw materials or production processes can significantly impact test outcomes.
This review presents recent advancements, challenges, and trends in optical LFIA for biomarker detection in human body fluids. The enhancement of optical materials components in single and hyphenated optical signal technologies are discussed to improve the sensitivity and LOD through signal amplification strategies. Furthermore, their application in human body fluids is explored based on invasive and non-invasive sources, aiming to establish home self-testing capabilities and primary care coverage.
The authors declare that they have no known competing financial interests or personal relationships that could have appeared to influence the work reported in this paper.
Chen Liu: Writing – original draft, Software, Methodology, Conceptualization. Tianqi Zhao: Writing – original draft, Methodology, Conceptualization. Jialing Zhou: Software, Methodology, Formal analysis. Xiaoyun Hu: Software, Methodology. Dinghao Pan: Software, Conceptualization. Jinlong Li: Formal analysis, Data curation. Wei Li: Writing – review & editing, Supervision, Project administration. Zhihui Dai: Writing – review & editing, Supervision, Funding acquisition.
This was supported by the National Natural Science Foundation of China (Nos. 22234005, 22494632, 22404081) and the Natural Science Foundation of Jiangsu Province (Nos. BK20222015, BK20240534). The graphical abstract and Scheme 1 were drawn by Biorender.com.
Supplementary material associated with this article can be found, in the online version, at doi:
J. Abbasi, JAMA 322 (2019) 918.
X. Ying, W. Fu, L. Zhu, et al., Anal. Chem. 96 (2024) 10630–10638. doi: 10.1021/acs.analchem.4c01224
L. Zhang, S. Wan, Y. Jiang, et al., J. Am. Chem. Soc. 139 (2017) 2532–2540. doi: 10.1021/jacs.6b10646
L. Zhang, K. Cao, Y. Su, et al., Biosens. Bioelectron. 222 (2023) 114935.
S. Peng, M. Fan, C. Xiao, et al., Sens. Actuators B: Chem. 401 (2024) 135012.
A.S. Lee, S.M. Kim, K.R. Kim, et al., Sens. Actuators B: Chem. 379 (2023) 133245.
K. Wang, X. Liu, X. Liang, et al., Anal. Chem. 96 (2024) 3208–3216.
B. Pulendran, M.M. Davis, Science 369 (2020) eaay4014.
H. Narasimhan, Y. Wu, N.P. Goplen, J. Sun, Sci. Immunol. 7 (2022) eabm7996.
A. Clifford, J. Das, H. Yousefi, et al., J. Am. Chem. Soc. 143 (2021) 5281–5294. doi: 10.1021/jacs.0c13138
N. Yao, X. Li, Y. Tian, et al., Sens. Actuators B: Chem. 379 (2023) 133247.
W. Wang, L. Liu, J. Zhu, et al., ACS Nano 18 (2024) 6266–6275. doi: 10.1021/acsnano.3c10543
J. Zhang, F. Chai, J. Li, et al., Sci. Adv. 10 (2024) eadn5698.
S. Schobesberger, H. Thumfart, F. Selinger, et al., Anal. Chem. 96 (2024) 2900–2907.
T. Bai, L. Wang, M. Wang, et al., Biosens. Bioelectron. 208 (2022) 114218.
X. Gao, J. Boryczka, P. Zheng, et al., Biosens. Bioelectron. 177 (2021) 112967.
N. Suwantarat, J.B. Dalton, R. Lee, et al., Diagn. Microbiol. Infect. Dis. 82 (2015) 54–56.
A. Fleury, P. Sastre, E. Sciutto, et al., Exp. Parasitol. 171 (2016) 67–70.
M. Supianto, D.K. Yoo, H. Hwang, et al., ACS Sens. 9 (2024) 1321–1330. doi: 10.1021/acssensors.3c02250
C. Wang, Q. Yu, S. Zheng, et al., ACS Nano 18 (2024) 16752–16765. doi: 10.1021/acsnano.4c01824
Q. Chen, L. Yao, J. Xu, et al., Anal. Chim. Acta 1278 (2023) 341684.
J. Wang, C. Jiang, J. Jin, et al., Angew. Chem. Int. Ed. 60 (2021) 13042–13049. doi: 10.1002/anie.202103458
H. Tong, C. Cao, M. You, et al., Biosens. Bioelectron. 213 (2022) 114449.
W. Jung, J. Han, J.W. Choi, C.H. Ahn, Microelectron. Eng. 132 (2015) 46–57.
R. Kuai, L.J. Ochyl, K.S. Bahjat, et al., Nat. Mater. 16 (2017) 489–496. doi: 10.1038/nmat4822
S. Zhao, S. Wang, S. Zhang, et al., Chin. Chem. Lett. 29 (2018) 1567–1577.
F. Scholz, L. Rüttinger, T. Heckmann, et al., Biosens. Bioelectron. 164 (2020) 112324.
H.K. Oh, K. Kim, J. Park, et al., Biosens. Bioelectron. 205 (2022) 114094.
X. Gao, P. Zheng, S. Kasani, et al., Anal. Chem. 89 (2017) 10104–10110. doi: 10.1021/acs.analchem.7b03015
E. Sheng, Y. Lu, Y. Xiao, et al., Biosens. Bioelectron. 181 (2021) 113149.
R. Chen, C. Ren, M. Liu, et al., ACS Nano 15 (2021) 8996–9004. doi: 10.1021/acsnano.1c01932
B. Chovelon, V. Ranganathan, S. Srinivasan, et al., Anal. Chem. 96 (2024) 6875–6880. doi: 10.1021/acs.analchem.3c05472
W. Li, S. Yin, Y. Shen, et al., J. Am. Chem. Soc. 145 (2023) 3736–3747. doi: 10.1021/jacs.2c13222
Y. Shen, W. Li, Z. Zhou, et al., Angew. Chem. Int. Ed. 63 (2024) e202406332.
W. Li, Y. Shen, X. Gong, et al., Anal. Chem. 93 (2021) 16673–16682. doi: 10.1021/acs.analchem.1c04246
D.Y. Kong, N.S. Heo, J.W. Kang, et al., Anal. Bioanal. Chem. 414 (2022) 3257–3265. doi: 10.1007/s00216-022-03877-z
Z. Ren, L. Xu, L. Yang, Y. Cui, Anal. Chem. 95 (2023) 6646–6654. doi: 10.1021/acs.analchem.3c00057
T. Zhao, R. Abdurahman, R. Aiwaili, et al., Coord. Chem. Rev. 488 (2023) 215171.
J. Liang, L. Wu, Y. Wang, et al., Sens. Actuators B: Chem. 389 (2023) 133875.
L. Fan, W. Yan, Q. Chen, et al., Anal. Chem. 96 (2024) 401–408. doi: 10.1021/acs.analchem.3c04441
X. Yang, Y. Xu, X. Huang, et al., Anal. Chem. 95 (2023) 4543–4549. doi: 10.1021/acs.analchem.2c05698
X. Yang, J. Hang, W. Qu, et al., J. Am. Chem. Soc. 145 (2023) 16026–16036. doi: 10.1021/jacs.3c04250
M. Xu, C. Zhang, S. He, et al., ACS Nano 17 (2023) 8183–8194. doi: 10.1021/acsnano.2c12066
S. Atta, Y. Zhao, J.Q. Li, T. Vo-Dinh, Anal. Chem. 96 (2024) 4783–4790. doi: 10.1021/acs.analchem.3c04361
P. Liang, Q. Guo, T. Zhao, et al., Anal. Chem. 94 (2022) 8466–8473. doi: 10.1021/acs.analchem.2c01286
Z. Xie, S. Feng, F. Pei, et al., Anal. Chim. Acta 1233 (2022) 340486.
C. Wang, X. Cheng, L. Liu, et al., ACS Appl. Mater. Interfaces 13 (2021) 40342–40353. doi: 10.1021/acsami.1c11461
M. Yang, Y. Tang, L. Qi, et al., Anal. Chem. 93 (2021) 11956–11964. doi: 10.1021/acs.analchem.1c01829
D. Zhu, S. Fu, X. Zhang, et al., Trends Food Sci. Technol. 148 (2024) 104485.
B. İnce, İ. Uludağ, B. Demirbakan, et al., TrAC Trends Anal. Chem. 169 (2023) 117418.
P. Chowdhury, R. Lawrance, Z.Y. Lu, et al., TrAC Trends Anal. Chem. 177 (2024) 117798.
B. Ince, M.K. Sezgintürk, TrAC, Trends Anal. Chem. 157 (2022) 116725.
X. Nan, X. Yao, L. Yang, Y. Cui, Analyst 148 (2023) 4573–4590. doi: 10.1039/d3an00719g
Y. Ji, Y. Huang, Z. Cheng, et al., J. Agric. Food. Chem. 71 (2023) 10250–10268. doi: 10.1021/acs.jafc.3c02094
P. Sadeghi, H. Sohrabi, M.R. Majidi, et al., TrAC, Trends Anal. Chem. 176 (2024) 117722.
M. Chao, Q. Pan, G. Li, et al., Anal. Chem. 96 (2024) 7714–7722. doi: 10.1021/acs.analchem.4c00956
Y. Matsumura, Y. Enomoto, M. Takahashi, S. Maenosono, ACS Appl. Mater. Interfaces 10 (2018) 31977–31987. doi: 10.1021/acsami.8b11745
O.A. Goryacheva, C. Guhrenz, K. Schneider, et al., ACS Appl. Mater. Interfaces 12 (2020) 24575–24584. doi: 10.1021/acsami.0c05099
T. Ji, X. Xu, X. Wang, et al., ACS Nano 14 (2020) 16864–16874. doi: 10.1021/acsnano.0c05700
W.Page Faulk, G.Malcolm Taylor, Immunochemistry 8 (1971) 1081–1083.
S.K. Bikkarolla, S.E. McNamee, P. Vance, J. McLaughlin, Biosensors 12 (2022) 182. doi: 10.3390/bios12030182
Y. Liu, W. Wang, X. Feng, et al., Analyst 148 (2023) 1246–1252. doi: 10.1039/d3an00012e
M. Lin, H. Yang, Q. Li, et al., J. Colloid Interface Sci. 673 (2024) 893–900.
H. Wang, M. Jian, J. Fan, et al., Talanta 273 (2024) 125852.
J. Sun, F. Gao, Y. Song, et al., ACS Appl. Nano Mater. 6 (2023) 18729–18738. doi: 10.1021/acsanm.3c00178
B. Gosselin, G. Bruylants, I. Jabin, ACS Appl. Nano Mater. 7 (2024) 6169–6177. doi: 10.1021/acsanm.3c06070
X. Chen, S. Kang, M.A. Ikbal, et al., Biosens. Bioelectron. 202 (2022) 113971.
A. Sena-Torralba, D.B. Ngo, C. Parolo, et al., Biosens. Bioelectron. 168 (2020) 112559.
J.R. Choi, Z. Liu, J. Hu, et al., Anal. Chem. 88 (2016) 6254–6264. doi: 10.1021/acs.analchem.6b00195
K. Kim, D.K. Han, N. Choi, et al., Anal. Chem. 93 (2021) 6673–6681. doi: 10.1021/acs.analchem.0c05336
C. Lin, Z. Liu, F. Fang, et al., ACS Sens. 8 (2023) 3733–3743. doi: 10.1021/acssensors.3c01019
Y. Li, J. Ke, Q. Liu, et al., Sens. Actuators B: Chem. 345 (2021) 130380.
W. Li, X. Gong, X. Fan, et al., Chin. Chem. Lett. 30 (2019) 1775–1790.
Z. Chen, Z. Zhang, X. Zhai, et al., Anal. Chem. 92 (2020) 7226–7231. doi: 10.1021/acs.analchem.0c00784
Y. Pang, M. Lu, H. Rha, et al., Sci. China Chem. 67 (2024) 774–787. doi: 10.1007/s11426-023-1815-9
Y. Hang, J. Boryczka, N. Wu, Chem. Soc. Rev. 51 (2022) 329–375. doi: 10.1039/c9cs00621d
L. Bian, Z. Li, A. He, et al., Biomaterials 288 (2022) 121694.
L. Hao, W. Yang, Y. Xu, et al., Biosens. Bioelectron. 212 (2022) 114411.
T. Wang, M. Liu, J. Mao, et al., Chin. Chem. Lett. 35 (2024) 108385.
Y. Gao, J. Shi, C. Wu, et al., Anal. Chem. 96 (2024) 5694–5701. doi: 10.1021/acs.analchem.4c00716
J. Guo, Y. Zhou, J. Cheng, et al., Anal. Chem. 96 (2024) 4891–4900. doi: 10.1021/acs.analchem.3c05448
X. Su, X. Kong, K. Sun, et al., Angew. Chem. Int. Ed. 61 (2022) e202201630.
D. Liu, C. Ju, C. Han, et al., Biosens. Bioelectron. 173 (2021) 112817.
A. Roda, S. Cavalera, F. Di Nardo, et al., Biosens. Bioelectron. 172 (2021) 112765.
F. Chai, D. Wang, L. Zhu, et al., Anal. Chem. 94 (2022) 6628–6634. doi: 10.1021/acs.analchem.2c01177
D. Hong, K. Kim, E.J. Jo, M.G. Kim, Anal. Chem. 93 (2021) 7925–7932. doi: 10.1021/acs.analchem.1c00623
D. Hong, E.J. Jo, K. Kim, et al., Small 16 (2020) 2004535.
Y. Huang, Y. Ji, M. Zheng, et al., ACS Sens. 9 (2024) 2815–2825. doi: 10.1021/acssensors.3c02329
Y. Zhao, L. Shi, H. Miao, X. Jing, Anal. Chem. 93 (2021) 3250–3257. doi: 10.1021/acs.analchem.0c04856
C. Wang, C. Wang, X. Wang, et al., ACS Appl. Mater. Interfaces 11 (2019) 19495–19505. doi: 10.1021/acsami.9b03920
P. Wu, W. Zuo, Y. Wang, et al., Chem. Eng. J. 451 (2023) 139021.
D. Chen, C. Wu, H. Li, et al., J. Mater. Chem. C 11 (2023) 12649–12657. doi: 10.1039/d3tc02410e
Z. Wang, R. Zou, J. Yi, et al., Small 20 (2024) 2310869.
Q. Yu, J. Li, S. Zheng, et al., J. Hazard. Mater. 459 (2023) 132136.
L. Shi, Z. Wang, Y. Li, et al., J. Agric. Food Chem. 72 (2024) 4405–4414. doi: 10.1021/acs.jafc.3c09597
X. Li, D. Yu, H. Li, et al., Biosens. Bioelectron. 241 (2023) 115688.
N.P. Damayanti, L.L. Parker, J.M.K. Irudayaraj, Angew. Chem. Int. Ed. 52 (2013) 3931–3934. doi: 10.1002/anie.201209303
Y. Zhao, C. Xu, Adv. Mater. 32 (2020) 1907880.
M. Li, H. Lin, S.K. Paidi, et al., ACS Sens. 5 (2020) 1419–1426. doi: 10.1021/acssensors.0c00307
M. Zhao, Y. Yang, N. Li, et al., Langmuir 40 (2024) 4447–4459. doi: 10.1021/acs.langmuir.3c03772
Y. Shang, J. Wang, H. Xia, et al., Anal. Chem. 96 (2024) 6065–6071. doi: 10.1021/acs.analchem.4c00648
Z. Li, W. Zhang, Q. Zhang, et al., ACS Nano 17 (2023) 19359–19371. doi: 10.1021/acsnano.3c06930
X. Lin, P. Zhou, Q. Li, Y. Pang, Anal. Chem. 96 (2024) 10686–10695. doi: 10.1021/acs.analchem.4c01580
J. Hu, Y.Z. Jiang, M. Tang, et al., Anal. Chem. 91 (2019) 1178–1184. doi: 10.1021/acs.analchem.8b05154
Y.Y. Broza, X. Zhou, M. Yuan, et al., Chem. Rev. 119 (2019) 11761–11817. doi: 10.1021/acs.chemrev.9b00437
C.E. Teunissen, I.M.W. Verberk, E.H. Thijssen, et al., Lancet Neurol. 21 (2022) 66–77.
L. Zhang, X. Du, Y. Su, et al., J. Nanobiotechnol. 19 (2021) 366. doi: 10.3390/s21020366
Y. Liang, K. Xue, Y. Shi, et al., Anal. Chem. 95 (2023) 3434–3441. doi: 10.1021/acs.analchem.2c05164
C. Tlili, N.V. Myung, V. Shetty, A. Mulchandani, Biosens. Bioelectron. 26 (2011) 4382–4386.
T. Saleh, C.G. Kalodimos, Science 355 (2017) 247–248. doi: 10.1126/science.aal4632
J.L. Shifren, C.J. Crandall, J.E. Manson, JAMA 321 (2019) 2458–2459. doi: 10.1001/jama.2019.5346
I. Visan, Nat. Immunol. 19 (2018) 1148. doi: 10.1038/s41590-018-0244-6
V.G. Panferov, N.A. Ivanov, T. Mazzulli, et al., Angew. Chem. Int. Ed. 62 (2023) e202215548.
Z. Song, Y. Suo, S. Duan, et al., Biosens. Bioelectron. 224 (2023) 115063.
R. Xiao, L. Lu, Z. Rong, et al., Biosens. Bioelectron. 168 (2020) 112524.
Y. Cai, S. Zhang, C. Dong, et al., Anal. Biochem. 627 (2021) 114265.
C. Fang, J. Li, B. Lin, et al., Anal. Chem. 96 (2024) 721–729. doi: 10.1021/acs.analchem.3c03704
K. Shen, O. Chen, J.L. Edmunds, et al., Nat. Biomed. Eng. 7 (2023) 424–442. doi: 10.1038/s41551-023-01021-5
L. Sun, Y. Lei, Y. Wang, D. Liu, Chin. Chem. Lett. 33 (2022) 1946–1950.
P.J. Xie, M.L. Ye, Z.Y. Hu, et al., Chin. Chem. Lett. 22 (2011) 1485–1488.
J. Zhong, X. Chen, M. Zhang, et al., Chin. Chem. Lett. 31 (2020) 769–773.
D. Yates, Nat. Rev. Neurosci. 23 (2022) 393. doi: 10.1038/s41583-022-00610-8
Y. Du, S. Dong, Anal. Chem. 89 (2017) 189–215. doi: 10.1021/acs.analchem.6b04190
J. Ye, F. Li, T. Hua, et al., Nat. Commun. 15 (2024) 8375.
J. Yu, J. Liu, C.B. Ma, et al., Anal. Chem. 94 (2022) 600–605. doi: 10.1021/acs.analchem.1c03451
M. Nooruzzaman, K.E.E. Johnson, R. Rani, et al., Nat. Commun. 15 (2024) 7999.
G. Guo, T. Zhao, R. Sun, et al., Chin. Chem. Lett. 35 (2024) 109198.
Z. Rong, Z. Bai, J. Li, et al., Biosens. Bioelectron. 145 (2019) 111719.
R.W. Smithells, Lancet 315 (1980) 772–773.
D. Gao, J. Gao, F. Gao, et al., J. Mater. Chem. C 9 (2021) 16634–16644. doi: 10.1039/d1tc04568g
H. Zhao, E. Su, L. Huang, et al., Chin. Chem. Lett. 33 (2022) 743–746. doi: 10.3390/ijerph20010743
X. Wang, J. Zhao, W. Wang, et al., Sci. China Chem. 65 (2022) 1911–1920.
C.H. Chou, T.H. Huang, P.C. Hsieh, et al., Anal. Chim. Acta 1196 (2022) 339544.
G.S. Green, M. Fujita, H.S. Yang, et al., Nature 633 (2024) 634–645.
T. Zhu, H. Wang, Z. Jing, et al., Bioact. Mater. 8 (2022) 12–19. doi: 10.1167/tvst.11.5.12
J. Zhao, H.Y.Y. Nyein, L. Hou, et al., Adv. Mater. 33 (2021) 2006444.
H. Lee, Y.J. Hong, S. Baik, et al., Adv. Healthc. Mater. 7 (2018) 1701150.
R.R. Nair, J.M. An, J. Kim, D. Kim, Coord. Chem. Rev. 494 (2023) 215336.
C. Guo, X. Zhang, X. Hong, et al., Chin. Chem. Lett. 35 (2024) 108867.
Y. Sun, Y. Tang, L. Yu, et al., Sci. China Chem. 66 (2023) 3006–3023. doi: 10.1007/s11426-023-1727-9
Y. Mao, Y. Sun, J. Xue, et al., Anal. Chim. Acta 1178 (2021) 338800.
E. Lamprou, M. Sotiriou, P.M. Kalligosfyri, et al., Talanta 262 (2023) 124682.
G. Källenius, S.B. Svenson, H. Hultberg, et al., Lancet 318 (1981) 1369–1372.
S. Ghosh, M. Kumar, M. Santiana, et al., Nature 607 (2022) 345–350. doi: 10.1038/s41586-022-04895-8
M.D. Nguyen, K.N. Nguyen, S. Malo, et al., ACS Sens. 8 (2023) 4625–4635. doi: 10.1021/acssensors.3c01624
S. Song, S. Choi, S. Ryu, et al., Biosens. Bioelectron. 117 (2018) 385–391.
X. Su, X. Liu, Y. Ouyang, et al., Chem. Eng. J. 485 (2024) 149833.
F. Di Nardo, S. Cavalera, C. Baggiani, et al., ACS Appl. Mater. Interfaces 11 (2019) 32758–32768. doi: 10.1021/acsami.9b11559
G.L. Sorem, G. Terres, Nature 209 (1966) 1254–1255. doi: 10.1038/2091254a0
N. Davis, J. Heikenfeld, C. Milla, A. Javey, Nat. Biotechnol. 42 (2024) 860–871. doi: 10.1038/s41587-023-02059-1
Q. Chen, Y. Zhao, Y. Liu, Chin. Chem. Lett. 32 (2021) 3705–3717.
D. Han, X. Li, Z. Liang, et al., Chin. Chem. Lett. 34 (2023) 107722.
S. Dalirirad, A.J. Steckl, Sens. Actuators B: Chem. 283 (2019) 79–86.

Scheme 1 Schematic representation of optical LFIA from optical technology to body fluid sensing.

Figure 1 (A) Au@Ag core-shell nanoparticles were synthesized using the seeded growth mediated method with AuNPs as cores. (B) Schematic diagram of AuNPs-X. Copied with permission [66]. Copyright 2024, American Chemical Society. (C) Schematic of the plasmonic nanostructures “hot spots” LFIA. (D) Signal readout of the SERS. Copied with permission [16]. Copyright 2021, Elsevier. (E) Schematic of UCNPs LFIA. (F) Luminescence spectra of inner core and core/shell UCNPs. Copied with permission [59]. Copyright 2020, American Chemical Society.

Figure 2 (A) Schematic diagram of AG flowmetry lamination. (B) Photochemical system for the strategy to improve the quantum yield of AG and the chemical structures of CU, EM, CU-EM, and CUEM. Copied with permission [82]. Copyright 2022, John Wiley and Sons. (C) Schematic of the overall structure of ECL-LFI. (D) Configuration for ECL and FL measurement. Copied with permission [87]. Copyright 2020, John Wiley and Sons.

Figure 3 (A) Detection principles and typical results of COL and FL dual-modal LFIA. (B) Images of AIENB-based LFIA strips testing CRP. Copied with permission [40]. Copyright 2024, American Chemical Society. (C) The LFIA strip detector utilizes serum or saliva samples. (D) IgA-Anti-SARS-CoV-2 detection in saliva by (ⅰ) the COL and (ⅱ) CL. Copied with permission [84]. Copyright 2021, Elsevier. (E) Schematic of the synthesis of GNC and images of the COL and SERS-based LFIA. (F) Schematic diagram of COL-SERS. Copied with permission [44]. Copyright 2024, American Chemical Society. (G) Schematic of the structure and detection principle of LFIA. (H) Test results of visible light and infrared thermal images. Copied with permission [88]. Copyright 2024, American Chemical Society.

Figure 4 (A) Schematic of the FL-SERS bimodal aptamer used to detect MC-LR. Copied with permission [99]. Copyright 2020, American Chemical Society. (B) Schematic of the detection of viral antigens and their two detection signals using a portable Raman spectrometer and a thermal imaging camera, respectively. Copied with permission [39]. Copyright 2023, Elsevier. (C) Schematic diagram of the MAG SERS strip for detecting two respiratory viruses. Copied with permission [90]. Copyright 2019, American Chemical Society. (D) Analytical performance graph of LFIA with signal hyphenated: MAG and FL signals. Copied with permission [46]. Copyright 2022, Elsevier.

Figure 5 (A) Schematic illustration of the NIR-Emissive AIE Nanoparticle-Labeled LFIA. (B) LFIA optical detection image. Schematic of biomarkers for detection of Acute myocardial infarction (AMI). Copied with permission [31]. Copyright 2021, American Chemical Society. (C) Schematic of biomarkers for detection of PSA. (D) LFIA optical detection of f-PSA, c-PSA images. Copied with permission [128]. Copyright 2021, Elsevier. (E) Schematic of the biomarker column tower for detection of CEA and (F) image of LFA optical detection of CEA. Copied with permission [115]. Copyright 2020, Elsevier.

Figure 6 (A) Schematic of biomarkers for detection of CRP. (B) LFA optical detection of CRP images. Copied with permission [40]. Copyright 2024, American Chemical Society. (C) Schematic of biomarkers for detection of TBI. (D) LFA optical detection of TBI images in plasma. Copied with permission [29]. Copyright 2017, American Chemical Society. (E) Schematic of biomarkers for detection of cTnl. (F) LFA optical detection of cTnl images. Copied with permission [15]. Copyright 2022, Elsevier.

Figure 7 (A) Blood samples were enriched using mAb 1F12-modified MNPs and eluted for LFIA analysis. (B) Visual detection of Aβ42Ms and/or Aβ42Os in human blood samples by LFIA. Copied with permission [107]. Copyright 2021, BioMed Central. (C) Schematic of ELISA for BTP and sample dilution process of the BTP LFIA strip for rapid CSF leakage diagnosis. (D) T-line signal intensity as BTP concentration increases. Copied with permission [133]. Copyright 2022, Elsevier.

Figure 8 (A) The proposed LFA was developed for the detection of miRNA in urine. Copied with permission [142]. Copyright 2023, Elsevier. (B) Schematic illustrations of the MCI-LFIA biosensor using AuNF-PMBA NMs for bacterial UTI diagnosis: (ⅰ) Preparation of AuNF-PMBA NMs. (ⅱ) Principle of MCI-LFIA for bacterial detection Copied with permission [91]. Copyright 2023, Elsevier.

Figure 9 (A) LFIA biosensor for multiplex and ultrasensitive monitoring of EBOV, MPXV, and SARS-CoV-2 antigens. (B) Detection of SARS-CoV-2 SP at concentrations. Copied with permission [20]. Copyright 2024, American Chemical Society. (C) Antibody coupling to gold nanoparticles. (D) The probe encounters salivary cortisol “F” and binds to it. Copied with permission [148]. Copyright 2019, American Chemical Society. (E) Schematic of the stepwise-Au-decoration assisted dual-signal amplified LFIA. (F) Schematic diagram of the LFIA test procedure and results for fingerprint sweat samples. Copied with permission [21]. Copyright 2023, Elsevier.

 扫一扫看文章

扫一扫关注我们
 DownLoad:
 下载:
下载:
 下载:
下载: