Key Laboratory of Biological Targeting Diagnosis, Therapy and Rehabilitation of Guangdong Higher Education Institutes, The Fifth Affiliated Hospital, Guangzhou Medical University, Guangzhou 510700, China
b.
Department of Emergency, The Second Affiliated Hospital of Guangzhou Medical University, Guangzhou 510260, China
c.
Guangdong Provincial Key Laboratory of Molecular Target & Clinical Pharmacology, the NMPA and State Key Laboratory of Respiratory Disease, School of Pharmaceutical Sciences and the Fifth Affiliated Hospital, Guangzhou Medical University, Guangzhou 511436, China
Received Date:
19 September 2024 Accepted Date:
14 February 2025 Revised Date:
11 February 2025 Available Online:
15 January 2026
Abstract:
Metal ion homeostasis plays a pivotal role in maintaining cellular functions, and its disruption can initiate regulated cell death pathways. Despite its therapeutic potential, metal ion therapy for breast cancer has been hampered by inefficient ion delivery and the intrinsic resistance mechanisms of cancer cells. In this work, a cuproptosis amplifier of copper-telaglenastat coordinate (denoted as Cu-CB) is developed to trigger cell ferroptosis for synergistic breast cancer treatment. Telaglenastat (CB-839), a glutaminase inhibitor, is identified as an effective copper ionophore that facilitates the formation of Cu-CB. Specially, Cu-CB can promote the aggregation of lipoylated proteins to initiate cuproptosis, while also inhibiting glutathione (GSH) synthesis and downregulating glutathione peroxidase 4 (GPX4) to trigger ferroptosis. The interplay between these cuproptosis and apoptosis pathways, mediated by Cu-CB, significantly amplifies reactive oxygen species (ROS) production and lipid peroxidation, culminating in the synergistic suppression of breast cancer. Both in vitro and in vivo studies validate the superior antitumor effects of Cu-CB through the induction of cuproptosis and ferroptosis, which may provide a new insight for metal ion delivery systems and metal ion-based tumor therapies.
Metal ions are integral to breast cancer progression, yet their excessive accumulation can disrupt cellular homeostasis, triggering regulated cell death pathways [1–5]. This mechanism has garnered significant attention in cancer therapy, particularly in strategies aimed at inducing intracellular metal ion dyshomeostasis for tumor suppression [6–11]. Cuproptosis, a newly discovered cell death pathway, is triggered by the binding of copper ions to lipoylated proteins within the tricarboxylic acid (TCA) cycle, resulting in the aggregation of dihydrolipoamide S-acetyltransferase (DLAT) and the induction of proteotoxic stress [1,2]. Similarly, ferroptosis, another regulated cell death process, is initiated by the excessive accumulation of iron ions, which can elevate intracellular oxidative stress and drive phospholipid peroxidation [12–14]. Interestingly, recent studies have found a biological crosstalk between cuproptosis and ferroptosis, suggesting a promising strategy to enhance ferroptosis via cuproptosis for synergistic tumor treatment [15–17]. Traditionally, copper ion supplementation has demonstrated moderate tumor suppression, but the therapeutic efficacy remains suboptimal due to the presence of intracellular bio-reductants and metal-chelating agents. Among these, glutathione (GSH) is the most prevalent detoxifier within tumor cells, where it mitigates ferroptosis by maintaining cellular redox balance [18,19].
Additionally, the potent metal-chelating properties of GSH neutralize copper ions, thereby inhibiting cuproptosis [20,21]. Moreover, the limited expression of copper-transporting proteins in tumor cells further restricts copper ion uptake, leading to insufficient intracellular accumulation and heightened risk of systemic toxicity in normal tissues. Therefore, it is necessary to develop a cuproptosis inducer capable of initiating ferroptosis, while considering the challenges of copper ion transport and the therapeutic defense mechanism of tumors.
Breast cancer cells exhibit a pronounced dependency on amino acids to sustain their rapid proliferation, particularly characterized by glutamine-dependent metabolic reprogramming [22–26]. Glutaminase, overexpressed by tumor cells, is a hydrolytic enzyme that converts glutamine into glutamate, subsequently fueling the production of GSH [27,28]. GSH further supports the synthesis of glutathione peroxidase 4 (GPX4), the key enzyme responsible for reducing phospholipid peroxidation and neutralizing the effects of ferroptosis [29,30]. Therefore, aberrant glutamine metabolism presents a viable therapeutic target to enhance the interplay between cuproptosis and ferroptosis for breast cancer suppression. Recent studies have demonstrated that pharmacological inhibition of glutaminase can destabilize intracellular redox homeostasis, thereby exacerbating oxidative stress [31,32]. In particular, telaglenastat (CB-839) has shown potent and selective glutaminase inhibition, yielding promising preclinical results in augmenting the efficacy of chemotherapy, radiotherapy, and immunotherapy [33–36]. Moreover, the co-delivery of CB-839 and copper ions to tumor cells not only enhances their bioavailability but also disrupts the therapeutic defense of tumors, thus intensifying metal ion therapy. Notably, the presence of multiple amide and nitrogen-containing heterocyclic structures in CB-839 suggests potential coordination sites for copper ions. However, the role of CB-839 as a copper ionophore and its capacity to synergistically induce both cuproptosis and ferroptosis remain largely unexplored.
In this work, a cuproptosis amplifier of copper-telaglenastat coordinate (denoted as Cu-CB) was developed to trigger cell cuproptosis and ferroptosis for breast cancer treatment. Among which, the glutaminase inhibitor of telaglenastat (CB-839) served as an efficient copper ionophore, facilitating the formation of Cu-CB (Scheme 1A). Notably, Cu-CB could trigger the aggregation of lipoylated proteins to initiate cuproptosis and reduce GSH synthesis, leading to the downregulation of GPX4, thereby promoting ferroptosis. Importantly, the reduced GSH level and copper-induced GPX4 degradation facilitated the crosstalk between cuproptosis and ferroptosis, resulting in the enhanced reactive oxygen species (ROS) production and increased lipid peroxidation, which collectively leaded to a synergistic suppression of breast cancer (Scheme 1B). In vitro and in vivo studies confirmed the potent antitumor efficacy of Cu-CB, offering new insights into metal ion therapy by addressing therapeutic resistance in tumors.
Scheme 1
Scheme 1.
Schematic illustration of Cu-CB to trigger cuproptosis and cell ferroptosis for synergistic breast cancer suppression. (A) Cu-CB was prepared by the coordination effect between Cu2+ and CB-839 with the assistance of PVP. (B) Proposed mechanism of Cu-CB for tumor eradication. Cu-CB could passively target the tumor tissue after intravenous injection. Upon internalization by breast cancer cells, Cu-CB inhibited GSH synthesis and downregulated GPX4, triggering ferroptosis. Simultaneously, reduced GSH further promoted Cu2+ to induce DLAT aggregation and proteotoxic stress, initiating cuproptosis. This dual mechanism enabled Cu-CB to effectively induce both cuproptosis and ferroptosis, achieving synergistic therapy of breast cancer.
Concretely, Cu-CB was synthesized by mixing CB-839 with CuCl2·2H2O in a polyvinyl pyrrolidone (PVP) aqueous solution. As shown in Fig. S1 (Supporting information), increasing the feeding ratio of CuCl2·2H2O to CB-839 resulted in a gradual shift in the solution's color to gray-green, indicative of the formation of metal ion complexes. To optimize the size distribution of the resulting formulations, various feeding ratios of CuCl2 and CB-839 were assessed. As shown in Figs. 1A–D, although nanoparticles with suitable particle sizes were obtained at feeding ratios of 8:1 and 8:5, these formulations still contained significant large-grained assemblies. Additionally, the formulation prepared with a feeding ratio of 8:7 yielded particles that were excessively large, impairing their ability to achieve passive tumor targeting. In contrast, Cu-CB synthesized at a ratio of 8:3 exhibited a uniform particle size distribution, with an average diameter of 192.23 nm and surface charge of 6.65 mV (Fig. S2 in Supporting information). Transmission electron microscopy (TEM) images confirmed that Cu-CB was uniformly spherical and well-dispersed, with stable size and polydispersity index (PDI) in biological environment, highlighting their suitability for biomedical applications (Figs. 1E and F and Fig. S3 in Supporting information). Furthermore, inductively coupled plasma mass spectrometry (ICP-MS) and high-performance liquid chromatography (HPLC) analyses revealed that the entrapment efficiencies of copper and CB-839 within Cu-CB were about 16.0% and 31.5%, respectively. Moreover, the drug release kinetics of Cu-CB in various buffers were analyzed using HPLC (Fig. S4A in Supporting information). As shown in Fig. S4B (Supporting information), Cu-CB exhibited a modest cumulative release of less than 15% over 48 h in a neutral buffer system (pH 7.4). In an acidic microenvironment, a slightly enhanced drug release was observed. Notably, a pronounced release occurred at pH 6.5 in the presence of 10 mmol/L GSH, indicating a strong GSH-responsive drug release behavior of Cu-CB. To further confirm this, the drug release behavior was assessed in phosphate buffered saline (PBS) containing varying GSH concentrations. As shown in Fig. S4C (Supporting information), Cu-CB demonstrated negligible cumulative release in a neutral buffer. The addition of 0.1 mmol/L GSH increased the cumulative release rate to 14.9%. Strikingly, Cu-CB in PBS with 10 mmol/L GSH achieved the highest drug release rate, with approximately 38.7% of CB-839 released. These findings demonstrated the GSH-responsive drug release behavior of Cu-CB, Given the elevated expression of GSH in tumor cells, the GSH responsiveness of Cu-CB is advantageous to exert therapeutic functions.
Figure 1
Figure 1.
Preparation and characterization of Cu-CB. The size distribution of different formulations prepared by the feeding ratio of (A) 8:1, (B) 8:3, (C) 8:5, (D) 8:7. (E) The TEM image of Cu-CB. Scale bar: 200 nm. (F) The stability of Cu-CB. (G) UV–vis spectra of various agents. (H) FTIR spectra of CB-839 and Cu-CB. (I) XPS analysis of Cu-CB. XPS spectra of (J) Cu 2p, (K) N 1s and (L) S 2p.
Meanwhile, the copper ion coordination behavior of CB-839 was evaluated to understand the formation and functionality of the Cu-CB. As illustrated in Fig. 1G, ultraviolet-visible (UV–vis) spectroscopy revealed a blue shift in the maximum absorption peak of Cu-CB compared to that of CB-839, which might be attributed to ligand-metal charge transfer interactions between Cu2+ and CB-839. To further characterize Cu-CB, fourier-transform infrared spectroscopy (FTIR) and X-ray photoelectron spectroscopy (XPS) were carried out. As shown in Fig. 1H, the presence of CB-839 characteristic peaks in the Cu-CB FTIR spectrum confirmed the successful formation of the Cu-CB complex. XPS spectrum analysis confirmed the existence of Cu, S, N, O, F, and C elements in Cu-CB (Fig. 1I). Specifically, the Cu 2p XPS spectrum exhibited distinct Cu2+ 2p peaks at Cu 2p1/2 (952.08 eV) and Cu 2p3/2 (931.88 eV) (Fig. 1J). Additionally, the N 1s XPS spectrum displayed a peak at 398.98 eV corresponding to Cu-N bonding (Fig. 1K), while the S 2p XPS spectrum showed a peak at 163.63 eV indicative of Cu-S interaction (Fig. 1L) [37,38]. These results confirmed that CB-839 functioned as an effective copper ionophore for copper coordination, attributed to the coordination of Cu2+ with the nitrogen and sulfur atoms in CB-839. Furthermore, the binding energy for Cu-CB was calculated using density functional theory (DFT). As illustrated in Fig. S5 (Supporting information), Cu2+ could coordinate with the sulfur atom in thiadiazol group and the nitrogen atoms in both pyridazine and thiadiazol groups. The calculated binding energies were −0.210 eV and −2.270 eV, respectively, demonstrating that Cu2+ could effectively coordinate with CB-839 to form a stable complex.
To investigate the intracellular uptake behavior, Cu-CB was labeled with Cy5.5 to produce Cy5.5@Cu-CB for co-incubation with murine breast cancer (4T1) cells. As displayed in Figs. 2A–C, fluorescence intensity within 4T1 cells increased progressively with longer incubation time and higher drug concentrations. These results indicated the time- and concentration-dependent cellular uptake behavior of Cu-CB. Furthermore, Cy5.5@Cu-CB-treated cells showed much stronger intracellular fluorescence compared to cells treated with Cy5.5 alone (Fig. S6 in Supporting information). These results validated that the Cu-CB could promote drug internalization and improve drug delivery efficiency. To investigate whether normal cells could internalize Cu-CB, 3T3 cells treated with Cu-CB at indicated time points were observed by confocal laser scanning microscope (CLSM) (Fig. S7 in Supporting information). As time progressed, the fluorescence intensity gradually increased, illustrating the uptake of Cu-CB by normal cells. Subsequently, MTT assay and live/dead cell staining assays were carried out to investigate the anti-proliferation effect of Cu-CB. As illustrated in Fig. 2D, CuCl2 and CB-839 showed relatively low toxicity to 4T1 cells that the cell viabilities kept at 65.5% and 84.0%, respectively. The mixture of CuCl2 and CB-839 exhibited a higher concentration-dependent cytotoxicity. However, under the same dosages of CuCl2 and CB-839, Cu-CB achieved the best efficiency in growth inhibition that the cell viability was only 33.1%. Notably, Cu-CB had lower toxicity toward 3T3 cells compared to 4T1 cells, indicating that its selective toxicity for 4T1 cells (Fig. S8 in Supporting information). Similar results were also observed in live/dead cell staining assay (Fig. 2E). Among which, Cu-CB-treated cells displayed the most intense red fluorescence, signifying extensive tumor cell death. These findings collectively highlighted the superior anti-proliferation performance of Cu-CB.
Figure 2
Figure 2.
Antitumor study of Cu-CB in vitro. (A) CLSM images of 4T1 cells to observe the incubation time and drug dose dependent cellular uptake behavior after treatment with Cy5.5@Cu-CB. Scale bar: 50 µm. (B) Fluorescence quantitative analysis of 4T1 cells following treatment with Cu-CB for different time points (n = 3). (C) Fluorescence quantitative analysis of 4T1 cells following treatment with various concentrations of Cu-CB (n = 3). (D) Cell viability of 4T1 cells treated with different concentrations of drugs (n = 5). (E) Live/dead cell staining of 4T1 cells after treatment with PBS, CuCl2, CB-839, CuCl2 + CB-839 or Cu-CB. Scale bar: 200 µm. ***P < 0.001. The numerical results were presented as means ± standard deviation (SD).
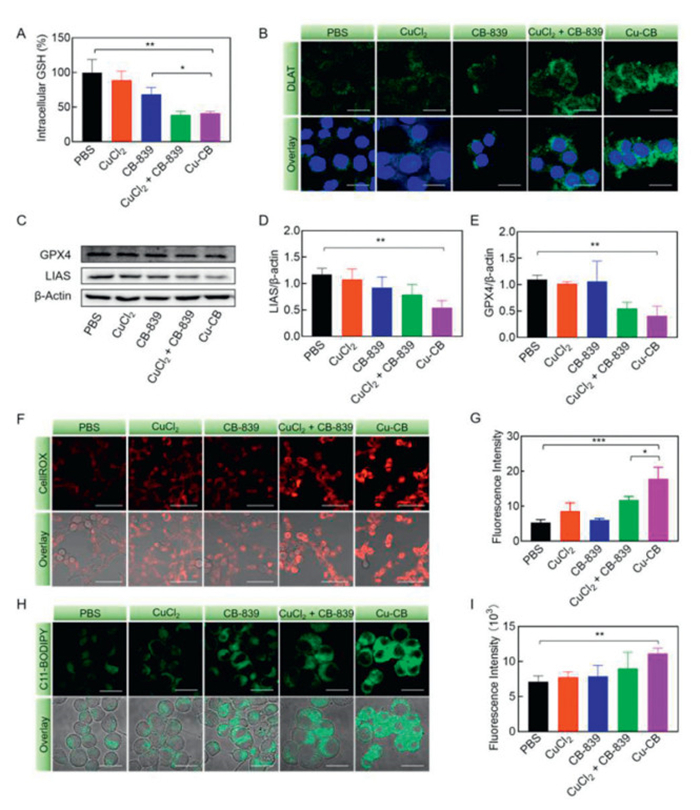
The elevated levels of GSH in tumor cells can act as a copper chelator, thereby diminishing the effectiveness of cuproptosis. CB-839, a glutaminase (GLS) inhibitor, should disrupt glutamine metabolism and subsequently inhibit GSH production. As shown Fig. 3A, treatment with CB-839 reduced intracellular GSH levels to 68.42%, reflecting a GLS inhibition behavior. Benefiting from the enhanced drug delivery efficiency, Cu-CB was able to further decrease GSH levels to 41.17%, representing a significant reduction compared to treatments with PBS and CB-839 alone.
Figure 3
Figure 3.
The antitumor mechanism of Cu-CB. (A) The intracellular GSH content of 4T1 cells after treatment with PBS, CuCl2, CB-839, CuCl2 + CB-839 or Cu-CB (n = 3). (B) DLAT immunofluorescence staining of 4T1 cells after different drug treatments. Scale bar: 20 µm. (C) Western blot analysis of GPX4 and LIAS. Quantitative analysis of the expression of (D) LIAS and (E) GPX4 (n = 3). (F) The ROS production and (G) quantitative fluorescence analysis of 4T1 cells after different drug treatments (n = 3). CellROX was used as the probe. Scale bar: 50 µm. (H) The lipid peroxides production and (I) quantitative fluorescence analysis of 4T1 cells after different drug treatments (n = 3). C11-BODIPY was used as the probe. Scale bar: 20 µm. *P < 0.05, **P < 0.01, ***P < 0.001. The numerical results were presented as means ± SD.
Cuproptosis, a newly identified form of programmed cell death, is characterized by excessive intracellular copper concentrations. During cuproptosis, Cu2+ binds directly to DLAT, causing it aggregation and triggering proteotoxic stress. To elucidate the mechanism of Cu-CB-induced cuproptosis, immunofluorescence staining was employed to evaluate DLAT expression. As illustrated in Fig. 3B, Cu2+ and CB-839 alone did not affect DLAT expression compared to PBS. However, Cu-CB treatment resulted in pronounced green fluorescence, demonstrating a significant aggregation of DLAT. The enhanced effect of Cu-CB compared to CuCl2 alone might be contributed to the copper ionophore of CB-839 to improve Cu2+ delivery. Similar results were also observed in Western blot analysis, which confirmed a significant inhibition of lipoyltransferase (LIAS) expression in Cu-CB treated cells (Figs. 3C and D). These results validated that Cu-CB effectively initiated the cuproptosis pathway by enhancing the delivery of Cu2+, thereby inducing tumor cell death through this mechanism.
Previous studies had revealed that copper could promote autophagic degradation of GPX4, and the depletion of GSH could also downregulate the GPX4 expression, which together resulted in ferroptosis [39,40]. As displayed in Figs. 3C and E, although CuCl2 and CB-839 treatment alone had nearly no effect on GPX4 expression, the combination of CB-839 and CuCl2 significantly inhibited GPX4 expression. Cu-CB reduced GPX4 protein expression by approximately 68.60%, highlighting a synergistic inhibitory effect of CB-839 and CuCl2 on GPX4 expression. The downregulation of GSH and GPX4 diminished the cellular antioxidant capacity, which might contribute to intracellular oxidative stress. To assess this effect, the intracellular ROS level was measured using CellROX as the probe. As depicted in Figs. 3F and G, tumor cells treated with CuCl2 or CB-839 alone showed weak red fluorescence, indicating minimal ROS production. In contrast, Cu-CB treatment resulted in markedly enhanced red fluorescence, signifying elevated ROS levels compared to the other treatments. Additionally, mitochondrial membrane potential was evaluated to assess mitochondrial function using rhodamine 123 as a probe. As shown in Fig. S9 (Supporting information), 4T1 cells treated with PBS had strong green fluorescence, while those treated with Cu-CB showed significantly reduced fluorescence. Quantitative analysis confirmed that the average fluorescence intensity in the Cu-CB group was 0.39-fold lower than in the PBS group. This reduction indicated that Cu-CB induced mitochondrial dysfunction, contributing to increased ROS production. Moreover, C11-BODIPY was employed to assess membrane lipid peroxidation induced by Cu-CB. CLSM imaging revealed a much brighter green fluorescence in the Cu-CB-treated group (Fig. 3H). Quantitative analysis of fluorescence intensity corroborated this observation, demonstrating a similar trend (Fig. 3I). Specifically, 4T1 cells treated with Cu-CB showed the strongest fluorescence intensity, which was 1.56-fold higher than that of PBS-treated cells. These results indicated that Cu-CB treatment leaded to substantial lipid peroxide accumulation, highlighting its role in promoting ferroptosis. The ferroptosis like pathway might result from the downregulation of GPX4 and the concomitant elevation of intracellular ROS.
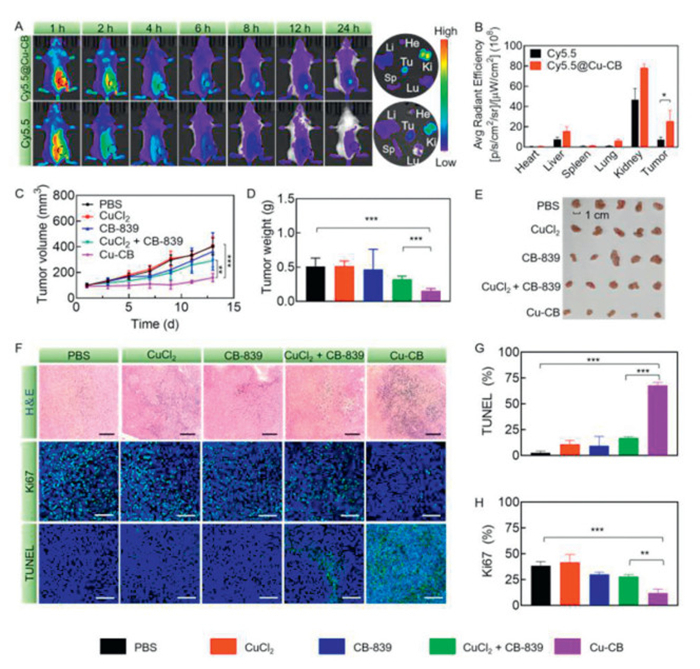
In this work, all the animal experiments were followed the guidelines of Institutional Animal Care and Use Committee (IACUC) of Animal Experiment Center of Guangzhou Medical University (GY2024–242). To evaluate the therapeutic potential of Cu-CB in vivo, its biodistribution was assessed using 4T1 tumor-bearing mice. Mice were administered with Cy5.5-labeled Cu-CB (Cy5.5@Cu-CB) via intravenous injection, and fluorescence imaging was performed at specified time points. As shown in Fig. 4A, the overall fluorescence signal decreased over time in both the two groups, but the signal at the tumor site notably increased only in the group of Cy5.5@Cu-CB. This observation was corroborated by ex vivo fluorescence imaging, which revealed that tumor tissues from Cy5.5@Cu-CB-treated mice exhibited significantly stronger fluorescence compared to those from Cy5.5-treated mice. Specifically, the fluorescence intensity in tumor tissues of the Cy5.5@Cu-CB group was 3.46-fold higher than that in the Cy5.5 group (Fig. 4B), demonstrating the effective passive targeting capability of Cy5.5@Cu-CB.
Figure 4
Figure 4.
Antitumor study of Cu-CB in vivo. (A) The biodistribution of Cy5.5@Cu-CB and Cy5.5 in 4T1 tumor-bearing mice. (B) Quantitative fluorescence analysis of Cy5.5 and Cy5.5@Cu-CB in major organs (n = 3). (C) The tumor volumes, (D) weights and (E) image of 4T1 tumor-bearing mice after treatment with PBS, CuCl2, CB-839, CuCl2 + CB-839 or Cu-CB (n = 5). (F) H&E, TUNEL and Ki67 staining of tumor tissues after different drug treatments. Scale bar: 100 µm. The positive rate of (G) TUNEL and (H) Ki67 in tumor tissues. *P < 0.05, **P < 0.01, ***P < 0.001. The numerical results were presented as means ± SD.
Benefiting from its elevated tumor targeting behavior, Cu-CB exhibited the most effective suppression of tumor growth (Fig. 4C). Similar results were also found in tumor weight analysis and imaging (Figs. 4D and E). Especially, the tumor weight inhibition rate for the Cu-CB group was 69.90%, significantly higher than that observed in other treatment groups. Conversely, tumors in the CuCl2 and PBS-treated groups grew rapidly, indicating low in vivo cytotoxicity of CuCl2. CB-839, which inhibited glutaminase activity, led to only a modest reduction in tumor volumes. The combination of CuCl2 and CB-839 demonstrated a relatively good therapeutic effect, but due to the low specificity of free drugs for tumor tissues, they had suboptimal antitumor effect. These results demonstrated the superiority of Cu-CB in suppressing breast cancer, likely due to its synergistic cuproptosis-ferroptosis mechanism and enhanced drug delivery efficiency. Subsequently, tumor tissues were extracted and collected for DLAT and GPX4 immunofluorescence staining. As illustrated in Figs. S10 and S11 (Supporting information), the strongest red fluorescence of DLAT and weakest green fluorescence of GPX4 were observed in Cu-CB group, indicating that Cu-CB could simultaneously induce cuproptosis and ferroptosis in vivo. Moreover, tumor tissues were also performed for hematoxylin and eosin (H&E), terminal deoxynucleotidyl transferase-mediated dUTP nick-end labeling (TUNEL), and Ki67 staining (Fig. 4F). The H&E staining images revealed that Cu-CB induced the highest level of tumor cell apoptosis, with extensive loss of nuclei. TUNEL staining showed the strongest signal and a high positive rate of 67.78%, indicating significant apoptosis (Fig. 4G). Additionally, Ki67 staining of Cu-CB-treated tumor tissue demonstrated a low percentage of Ki67-positive cells (12.10%), reflecting a substantial reduction in tumor cell proliferation (Fig. 4H). These findings suggested that Cu-CB effectively induced tumor cell death while simultaneously inhibiting tumor proliferation.
To investigate whether Cu-CB could inhibit metastatic progression, a 4T1 metastasis model was established and received different treatments. As shown in Fig. S12A (Supporting information), neither CuCl2, CB-839, nor the combination of CuCl2 and CB-839 effectively inhibited tumor growth. In contrast, Cu-CB treatment significantly delayed tumor progression, and the tumor volume was 0.27 times that of PBS group. Similar results were observed for tumor images and weights (Figs. S12B and C in Supporting information). These findings highlighted the superior efficacy of Cu-CB in suppressing breast cancer. At the end of the experiment, the mice were euthanized, and lung tissues were collected for analysis. The number of metastatic nodules in the Cu-CB group did not differ significantly from that in the PBS group, indicating that Cu-CB-mediated therapeutic effects were insufficient to inhibit metastatic progression (Figs. S12D and E in Supporting information). Recent studies reported that cuproptosis induced by nanomedicines could lead to antigen release and activate the immune cascade [8,41]. However, the immunosuppressive tumor microenvironment often leaded to therapy failure and tumor recurrence. Therefore, the poor therapeutic outcome in lung metastasis following Cu-CB treatment might be attributed to the immunosuppressive nature of the breast cancer microenvironment.
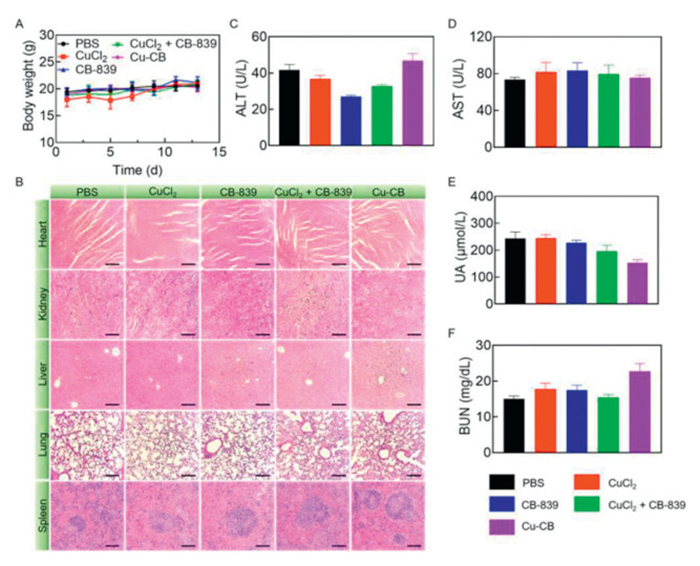
To assess the biosafety of Cu-CB, the body weights of 4T1 tumor-bearing mice were monitored throughout the treatment period. As shown in Fig. 5A, the mean body weights of the mice gradually increased, suggesting no significant adverse effects on general health. Additionally, major organs were examined via H&E staining, revealing no noticeable morphological changes or signs of inflammation (Fig. 5B). These results indicated a minimal systemic toxicity of Cu-CB. Furthermore, the biochemical parameters of alanine aminotransferase (ALT), aspartate aminotransferase (AST), blood urea nitrogen (BUN), and uric acid (UA) remained within normal reference ranges, demonstrating that Cu-CB did not cause serious damage to liver or kidney function (Figs. 5C–F). Also, all measured hematological parameters were found to be within normal ranges, suggesting that Cu-CB had acceptable blood compatibility (Fig. S13 in Supporting information). The above results indicated that Cu-CB not only provided effective tumor treatment but also had minimal side effects on normal tissues.
Figure 5
Figure 5.
Biosafety analysis of Cu-CB. (A) The body weights of 4T1 tumor-bearing mice after treatment with PBS, CuCl2, CB-839, CuCl2 + CB-839 or Cu-CB (n = 5). (B) H&E staining of heart, liver, spleen, lung and kidney. Scale bar: 200 µm. (C) ALT, (D) AST, (E) UA and (F) BUN serum levels from biochemical tests of 4T1 tumor-bearing mice after treatment with PBS, CuCl2, CB-839, CuCl2 + CB-839 or Cu-CB (n = 3). The numerical results were presented as means ± SD.
To summarize, a cuproptosis amplifier of copper-telaglenastat coordinate (Cu-CB) was fabricated to trigger cell ferroptosis and cuproptosis for synergistic breast cancer suppression. Among which, CB-839 served as an effective copper ionophore, facilitating the preparation of Cu-CB with optimal particle size and uniform nano-morphology. Additionally, Cu-CB accelerated the intracellular delivery of Cu2+ and showed GSH-responsive drug release behavior. More importantly, Cu-CB could induce a cuproptosis-like cell death by enhancing DLAT aggregation. This process also decreased GSH synthesis, leading to the downregulation of GPX4 and the initiation of ferroptosis. Ultimately, the synergistic induction of cuproptosis and ferroptosis by Cu-CB markedly suppressed breast cancer growth while maintaining minimal side effects on normal tissues. This work might provide a new insight into metal ion delivery using molecular drugs, which also offered a synergistic mechanism for metal ion therapy.
Declaration of competing interest
The authors declare that they have no known competing financial interests or personal relationships that could have appeared to influence the work reported in this paper.
This work was supported by the National Natural Science Foundation of China (Nos. 82302355, 32371394), Guangdong Basic and Applied Basic Research Foundation (No. 2023A1515012628), the Characteristic Innovation Projects of General Colleges and Universities in Guangdong Province (No. 2024KTSCX120), the Science and Technology Program of Guangzhou (Nos. 2024A04J3324, 2024A03J0078).
Supplementary materials
Supplementary material associated with this article can be found, in the online version, at doi:10.1016/j.cclet.2025.110959.
[1]
P. Tsvetkov, S. Coy, B. Petrova, et al., Science 375 (2022) 1254–1261. doi: 10.1126/science.abf0529
[2]
L. Chen, J. Min, F. Wang, Signal Transduct. Target. Ther. 7 (2022) 378.
H. Zu, Y.X. Wu, H.H. Meng, et al., ACS Nano 18 (2024) 23941–23957. doi: 10.1021/acsnano.3c10588
Scheme 1
Schematic illustration of Cu-CB to trigger cuproptosis and cell ferroptosis for synergistic breast cancer suppression. (A) Cu-CB was prepared by the coordination effect between Cu2+ and CB-839 with the assistance of PVP. (B) Proposed mechanism of Cu-CB for tumor eradication. Cu-CB could passively target the tumor tissue after intravenous injection. Upon internalization by breast cancer cells, Cu-CB inhibited GSH synthesis and downregulated GPX4, triggering ferroptosis. Simultaneously, reduced GSH further promoted Cu2+ to induce DLAT aggregation and proteotoxic stress, initiating cuproptosis. This dual mechanism enabled Cu-CB to effectively induce both cuproptosis and ferroptosis, achieving synergistic therapy of breast cancer.
Figure 1
Preparation and characterization of Cu-CB. The size distribution of different formulations prepared by the feeding ratio of (A) 8:1, (B) 8:3, (C) 8:5, (D) 8:7. (E) The TEM image of Cu-CB. Scale bar: 200 nm. (F) The stability of Cu-CB. (G) UV–vis spectra of various agents. (H) FTIR spectra of CB-839 and Cu-CB. (I) XPS analysis of Cu-CB. XPS spectra of (J) Cu 2p, (K) N 1s and (L) S 2p.
Figure 2
Antitumor study of Cu-CB in vitro. (A) CLSM images of 4T1 cells to observe the incubation time and drug dose dependent cellular uptake behavior after treatment with Cy5.5@Cu-CB. Scale bar: 50 µm. (B) Fluorescence quantitative analysis of 4T1 cells following treatment with Cu-CB for different time points (n = 3). (C) Fluorescence quantitative analysis of 4T1 cells following treatment with various concentrations of Cu-CB (n = 3). (D) Cell viability of 4T1 cells treated with different concentrations of drugs (n = 5). (E) Live/dead cell staining of 4T1 cells after treatment with PBS, CuCl2, CB-839, CuCl2 + CB-839 or Cu-CB. Scale bar: 200 µm. ***P < 0.001. The numerical results were presented as means ± standard deviation (SD).
Figure 3
The antitumor mechanism of Cu-CB. (A) The intracellular GSH content of 4T1 cells after treatment with PBS, CuCl2, CB-839, CuCl2 + CB-839 or Cu-CB (n = 3). (B) DLAT immunofluorescence staining of 4T1 cells after different drug treatments. Scale bar: 20 µm. (C) Western blot analysis of GPX4 and LIAS. Quantitative analysis of the expression of (D) LIAS and (E) GPX4 (n = 3). (F) The ROS production and (G) quantitative fluorescence analysis of 4T1 cells after different drug treatments (n = 3). CellROX was used as the probe. Scale bar: 50 µm. (H) The lipid peroxides production and (I) quantitative fluorescence analysis of 4T1 cells after different drug treatments (n = 3). C11-BODIPY was used as the probe. Scale bar: 20 µm. *P < 0.05, **P < 0.01, ***P < 0.001. The numerical results were presented as means ± SD.
Figure 4
Antitumor study of Cu-CB in vivo. (A) The biodistribution of Cy5.5@Cu-CB and Cy5.5 in 4T1 tumor-bearing mice. (B) Quantitative fluorescence analysis of Cy5.5 and Cy5.5@Cu-CB in major organs (n = 3). (C) The tumor volumes, (D) weights and (E) image of 4T1 tumor-bearing mice after treatment with PBS, CuCl2, CB-839, CuCl2 + CB-839 or Cu-CB (n = 5). (F) H&E, TUNEL and Ki67 staining of tumor tissues after different drug treatments. Scale bar: 100 µm. The positive rate of (G) TUNEL and (H) Ki67 in tumor tissues. *P < 0.05, **P < 0.01, ***P < 0.001. The numerical results were presented as means ± SD.
Figure 5
Biosafety analysis of Cu-CB. (A) The body weights of 4T1 tumor-bearing mice after treatment with PBS, CuCl2, CB-839, CuCl2 + CB-839 or Cu-CB (n = 5). (B) H&E staining of heart, liver, spleen, lung and kidney. Scale bar: 200 µm. (C) ALT, (D) AST, (E) UA and (F) BUN serum levels from biochemical tests of 4T1 tumor-bearing mice after treatment with PBS, CuCl2, CB-839, CuCl2 + CB-839 or Cu-CB (n = 3). The numerical results were presented as means ± SD.


 DownLoad:


 下载:
下载:


 下载:
下载:
