Department of Materials Science and Engineering, Fujian Key Laboratory of Surface and Interface Engineering for High Performance Materials, College of Materials, Xiamen University, Xiamen 361005 China
Received Date:
30 November 2024 Accepted Date:
12 February 2025 Revised Date:
23 January 2025 Available Online:
15 May 2026
Abstract:
Solvated-ion co-intercalation mechanism with high-rate capability properties makes graphite anode reconsider as optional anode for sodium-ion batteries and capacitors. The size effect has been widely investigated for various transition metal oxide materials, but such influences on the co-intercalation mechanism remain largely unexplored. In this study, natural graphite anodes with different particle sizes ranging from 25 µm to 1.7 µm for [Na(diglyme)x]+ co-interaction are systematically investigated through detailed kinetics analysis and in-situ X-ray diffraction characterization. Importantly, we find that the reaction pathways of the co-intercalation and co-extraction are quite different. The reduced graphite size results in the loss of phase transitions during the co-extraction process and then the disappearance of the sharp anodic redox peak. The small-sized graphite anodes display boosted capacitor-like responses and provide additional surface adsorption with a slightly increased capacity. Finally, a hybrid sodium-ion capacitor (SIC), using graphite anode and activated carbon cathode, is assembled without complex presodiation treatments. Such optimized hybrid SICs deliver high energy densities of 60 Wh/kg at 240 W/kg and high power density of ~16,000 W/kg with 32 Wh/kg, and ultralong 30,000 stable cycles. This work provides fundamental insights into the Na+-solvent co-intercalation mechanism with tunable capacitor-like kinetics, representing a promising direction for high-power sodium-ion storage.
Electrochemical energy storage (EES) is highly important for electric vehicles and power grids [1,2]. Among various electrochemical energy storage technologies, sodium-ion batteries (SIBs) and sodium-ion capacitors (SICs) have received widespread attention, especially for large-scale energy storage, owing to the sustainability and abundance of sodium resources compared with lithium resources [3-5]. The qualities of electrical girds from intermittent solar or wind energies are highly dependent on EES systems [6,7]. The high energy density of SIBs is utilized to store energy for peak‐load shifting [2,5]. While, the high-power SICs can be designed to smooth the output power and adjust the loadings frequently [8]. According to the operation mechanism of SICs, the primary issue is the mismatched kinetics between electric double-layer capacitance (EDLC)-type activated carbon (AC) cathodes and intercalation-type anodes [9]. Hard carbon anodes have a high capacity of 300–400 mAh/g, but their rate performance is limited by sluggish "intercalation and filling" processes [10,11]. Some alloying-type anodes exhibit high theoretical capacities, but large volume changes lead to unsatisfactory rates and cycling performance [12]. Therefore, the major limitations of SICs are high-rate and long-cycling anodes and the manufacturing technique of devices with advanced energy and power densities and facile assembly processes.
Graphite has been widely commercialized as anode materials for lithium-ion batteries (LIBs), forming the graphite intercalation compounds (GICs) of LiC6 during desolvated Li+ intercalation and extraction with a high capacity of 372 mAh/g [13-15]. Despite its high reversibility for Li+ intercalation, graphite is known to be electrochemically inactive for Na+ intercalation [16]. This is attributed mainly to the positive formation energy of the Na+ binary graphite intercalation compounds, which severely hinders the sodiation process [17-19]. Remarkably, graphite can reversibly accommodate the co-intercalation of [Na(diglyme)x]+, forming ternary GICs (t-GICs) [20]. Previous studies have indicated that such co-intercalation behavior of graphite in ether electrolytes is accompanied by hybrid capacitive and intercalation reactions, resulting in greater rates than those resulting from net Na+ intercalation into hard carbons [21,22]. These properties make the co-intercalation mechanism very promising for the development of high-power SIBs and high-energy SICs.
Reducing the particle size is widely used to increase the diffusion kinetics [23-25]. For example, the decreased particle size of graphite anodes and optimized spatial distribution of particles at the electrode level have improved the rate performance for Li+ intercalations [26,27]. Additionally, by further reducing the particle size to nanosize, the active materials could play a transition of the electrochemical behavior, that is, from battery-type to capacitive-dominated reactions [28-30]. These nanosized materials suppress phase transformation and increase surface pseudocapacitive charge storage, which are named "extrinsic pseudocapacitive materials" [29,31,32]. One example was nanoscale LiCoO2 with a particle size of < 10 nm, which displayed a capacitive profile with a linear dependence on charge storage within the potential window [33]. However, the size effect of graphite anodes on co-intercalation mechanisms remains largely unexplored.
In this work, we systematically investigate the electrochemical co-intercalation properties of graphite with particle sizes ranging from 25 µm to 1.7 µm. A size-induced transition from battery-type intercalation to capacitor-like reaction of graphite anodes during the [Na(diglyme)x]+ co-intercalation process is reported for the first time, as demonstrated by in situ X-ray diffraction (XRD) and detailed kinetic analysis. The G-1.7 µm particle undergoes a capacitive-controlled process during the co-extraction process, which results in a typical broadened cyclic voltammetry (CV) shape and increased rate capability compared with those of larger-sized graphite. Finally, owing to the unique fast co-intercalation mechanism, the hybrid SIC, which uses graphite-1.7 µm as the negative electrode and AC as the positive electrode, is assembled without any pre-sodiation treatments. The optimized hybrid SICs display a high energy density of 60 Wh/kg and a high power density of 16,000 W/kg (based on the total weight of the cathode and anode materials) and 30,000 stable cycles. Such size-decreased highly reversible graphite anodes unlock the potential of high-power sodium-ion storage devices.
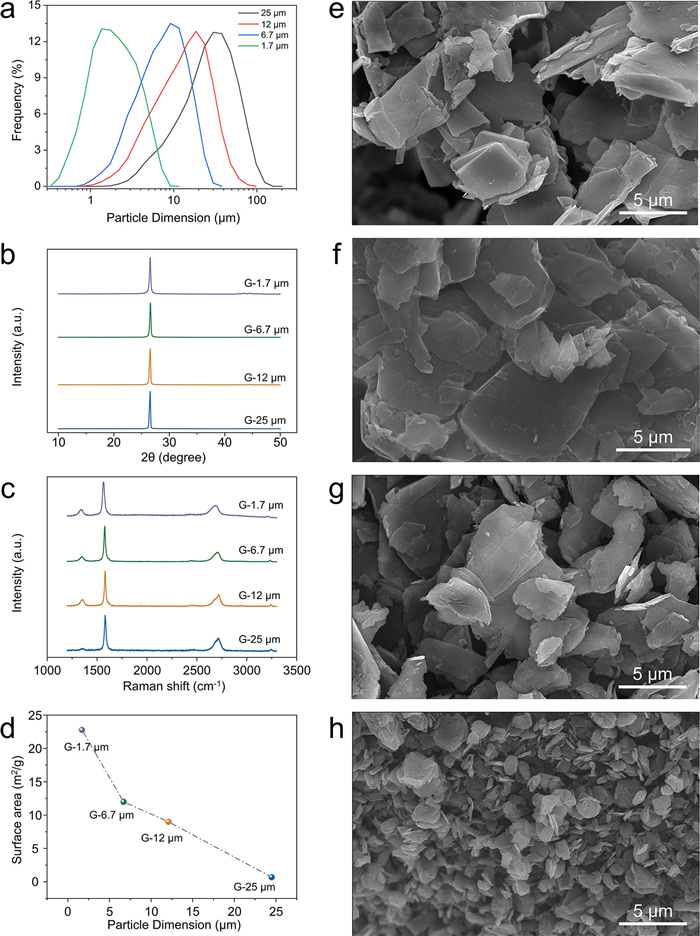
Laser scattering measurements were applied to identify the particle sizes of different natural graphite powders (Fig. 1a). The different graphite powders clearly have distinct particle size distributions. The average particle size of D50 is used to name the samples as G-25 µm, G-12 µm, G-6.7 µm and G-1.7 µm, respectively. The XRD patterns of the different-sized graphite powders are shown in Fig. 1b. All the diffraction peaks correlate to the hexagonal crystal system without any impurities or peak shifts. The four graphite samples have the same d002 spacing of 3.35 Å. The ID/IG values for G-25 µm, G-12 µm, G-6.7 µm and G-1.7 µm are 0.13, 0.22, 0.16, and 0.26, respectively (Fig. 1c). The Brunauer‒Emmett–Teller (BET) surface areas were obtained from nitrogen adsorption isotherms (Fig. 1d). The corresponding BET surface areas from small to large sizes are 22.2, 13.6, 11.2 and 4.6 m2/g, corresponding to G-25 µm, G-12 µm, G-6.7 µm and G-1.7 µm, respectively (Fig. S1 in Supporting information). The size and morphology of the graphite were further determined from the scanning electron microscope (SEM) images (Figs. 1e-h). The morphologies are all flake shape. Under the same magnification with the scan bar of 5 µm, it clearly shows the reduced flakes’ size for the G-25 µm (Fig. 1e), G-12 µm (Fig. 1f), G-6.7 µm (Fig. 1g) and G-1.7 µm (Fig. 1h). On the basis of the above material characterization, it can be concluded that the four powders have different flake sizes but the same crystalline graphite properties.
Figure 1
Figure 1.
Materials characterization of natural graphite powders. (a) Particle size intensity distribution curves from laser scattering measurements, (b) XRD patterns, (c) Raman spectra and (d) BET surface areas of different natural graphite samples. SEM images of the (e) G-25 µm, (f) G-12 µm, (g) G-6.7 µm and (h) G-1.7 µm powders.
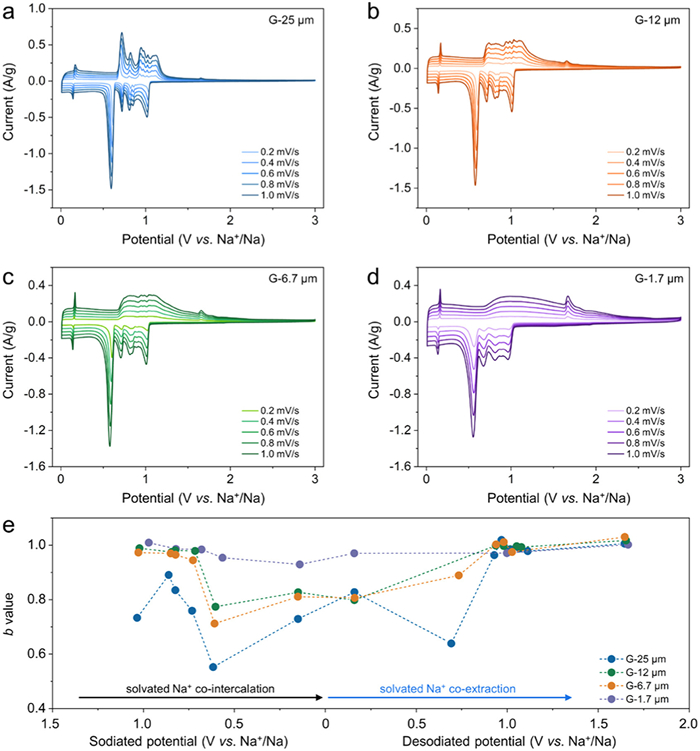
The electrochemical performance of different graphite samples was measured via coin cells (2032-type), while the sodium metal was used as the counter and reference electrode and 1 mol/L NaPF6 in diglyme as the electrolyte. Fig. 2a shows the typical CV curves for [Na(diglyme)x]+ co-intercalation into the natural G-25 µm anode, which is consistent with previously reported results [34,35]. Several redox peaks indicate multiple transformations of graphite intercalation compounds (GICs) from stage > 3 to stage 1. In particular, the pair of shape peaks at 0.60/0.72 V vs. Na+/Na at 1 mV/s corresponds to stages 2 to 1 transformation. The shapes of CV curves clearly change for small-sized graphite anodes. Several cathodic peaks are still observed for the G-12 µm (Fig. 2b), G-6.7 µm (Fig. 2c) and G-1.7 µm (Fig. 2d) anodes, but they broadened with decreasing particle sizes. Interestingly, the anodic peaks at ~0.7 V vs. Na+/Na disappeared, and the other anodic peaks in the potential window of 0.6−3 V became much smoother. The storage capacities of CV curves can be calculated by integrating i − t curves on the basis of the equation: Q=∫t1t2idt (Fig. S2 in Supporting information). Even with the disappearance of shape peaks for the small-sized graphite (Figs. 2b–d), the sodiation and desodiation capacities are equal, indicating that the loss of shape anodic peaks does not affect the capacity.
Figure 2
Figure 2.
CV curves of the (a) G-25 µm, (b) G-12 µm, (c) G-6.7 µm and (d) G-1.7 µm electrodes at different sweep rates of 0.2–1.0 mV/s. (e) The fitted b-values of the (de)sodiation peaks of different-sized graphite electrodes.
With increasing sweep rates, the four graphite anodes show slight peak shifts (Figs. 2a–d), indicating rapid kinetics [36]. CV measurements can also be used to analyze charge storage behavior. In this analysis, the corresponding current (i) follows the power law (Eq. 1):
i=aνb
(1)
where the b-value of 0.5 refers to a semi-infinite diffusion-controlled process, and the b-value of 1 indicates capacitor-like kinetics [29].
The linear fitting plots of the four samples are shown in Fig. S3 (Supporting information), and the calculated b-values vs. potential profiles are summarized in Fig. 2e. For G-25 µm, the b-values at sodiated peak of 0.60 V and desodiated peak of 0.72 V vs. Na+/Na are 0.55 and 0.64, respectively, indicating that the stage 2 to stage 1 transition is a diffusion-controlled process [29]. The other peaks are between 0.5 and 1, indicating hybrid reaction kinetics. Remarkably, with decreasing graphite size, the b-values significantly increase. Comparing the co-intercalation and co-extraction processes of different-sized graphite anodes, it reveals the separation reaction pathway of the solvated Na+ in and out of the reduced sizes of the graphite layers. Interestingly, the b-values are very close to 1 for the G-1.7 µm anode, indicating that the capacitor-like process becomes dominant when the size of the graphite flakes is largely reduced to ~1.7 µm. Meanwhile, a gradual increase in the intensity of the anodic peak at ~1.7 V vs. Na+/Na was observed as the particle size decreased from 25 µm to 1.7 µm. This peak might result from the structural rearrangement of the graphite stacking model after the complete extraction of solvated Na+ [37,38]. The smaller graphite particles, undergo a higher degree of structural rearrangement, contributing to the increased intensity of such anodic peaks.
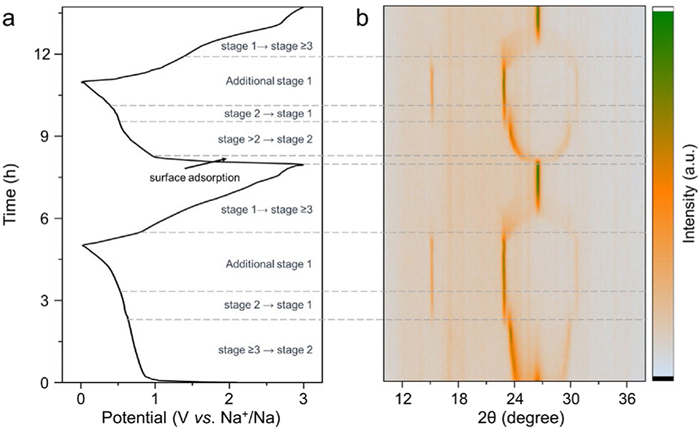
The in situ XRD patterns of the G-1.7 µm anode were further investigated (Fig. 3) and compared with those previously reported for natural graphite [37]. The initial XRD patterns show the multistage phase transitions of the graphite anode during solvated-Na+ co-intercalation [22,37]. The definition of the stage number n refers to the number of graphene layers between adjacent sodium layers. Each stage state corresponds to distinct diffraction peaks, and according to Bragg’s law (2dsinθ = nλ). When the diffraction peak no longer shifts with the intercalation of solvated Na+, it indicates that each graphene layer is fully occupied by solvated Na+[39]. In the potential range of 3−0.7 V vs. Na+/Na, it transitions from stage n > 2 to stage 2. Then, at the plateau of ~0.6 V vs. Na+/Na, the transition to stage 1 is complete. Subsequently, additional stage 1 takes place in the range of 0.6–0.01 V vs. Na+/Na. These phase transitions result in a gradual expansion of the graphite interlayer spacing to 11.68 Å, which is consistent with previous research [37]. However, in the stage 1 to stage ≥3 processes, the corresponding XRD patterns exceptionally weakened in intensity, indicating the loss of the two-phase transition in this co-extraction process. Therefore, the loss of the two-phase transition leads to an unsymmetrical CV shape with the disappearance of the sharp cathodic peak (Fig. 2d) and increased b-values for the capacitor-like responses (Fig. 2e). Additionally, during the early stage of the second sodiation process in the potential range of 3 − 1 V vs. Na+/Na, the diffraction peak of (002) for graphite remains at 26.5° without phase transitions, indicating that the predominant surface adsorption reactions contribute to the increased capacity of the smaller graphite anodes (as discussed in detail in Fig. 4).
Figure 3
Figure 3.In situ XRD results of the G-1.7 µm electrode: (a) Corresponding charge‒discharge profiles and (b) corresponding in situ XRD patterns during the initial 2 cycles.
Figure 4.
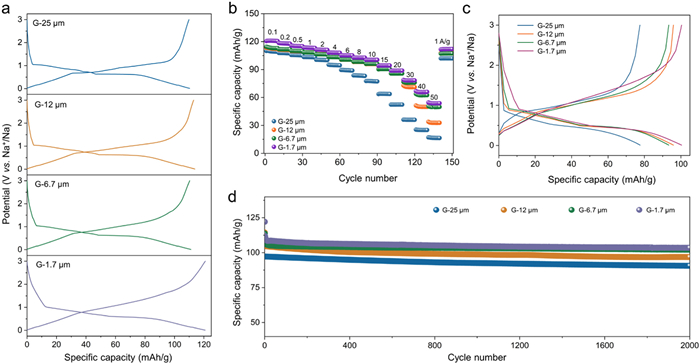
Electrochemical performance of different-sized graphite anodes. (a) The (dis)charge profiles of the four graphite anodes at 0.1 A/g. (b) Rate performance for the G-25 µm, G-12 µm, G-6.7 µm and G-1.7 µm anodes. (c) The (dis)charge profiles of the four graphite anodes at 10 A/g. (d) Cycling performance at a specific current of 2 A/g for the G-25 µm, G-12 µm, G-6.7 µm and G-1.7 µm anodes.
The changed CV shape (Fig. 2) and the in-situ XRD patterns of the G-1.7 µm anode (Fig. 3) indicate different reaction pathways for the co-intercalation and co-extraction processes. The co-intercalated solvated [Na(diglyme)x]+ gradually expands the layer spacings from 3.35 Å to 11.68 Å with multistep phase transitions. In contrast, for the co-extraction processes, the solvated [Na(diglyme)x]+ ions are scrambling to move out from the expanded graphite layers. In particular, when the graphite size is reduced, the degree of these asymmetric processes increases.
The sodium-ion storage performance of the four graphite anodes was further measured via the galvanostatic charge and discharge (GCD) method. Fig. 4a shows the GCD profiles of the four graphite anodes. The specific capacity and shape of the charge/discharge profiles are affected by the particle size. Notably, the discharge profiles are very similar, but the charge profiles become more slope-like in shape, which is consistent with the CV analysis. On the basis of the initial GCD profiles (Fig. S4 in Supporting information), the initial coulombic efficiencies (ICEs) of the four graphite anodes are stable at ~92.5%. Owing to the co-intercalation of solvated Na+ from the edges of graphite flakes [[39], [40]], the graphite size does not strongly affect the ICE. Additionally, the small-sized graphite anodes display enhanced capacities, from 110 mAh/g for the G-25 µm anode to 113 mAh/g for the 12 µm anode, 115 mAh/g for the G-6.7 µm anode and 120 mAh/g for the G-1.7 µm anodes. According to the discharge profiles (Fig. 4a), the increased capacities are mainly from the enlarged adsorption capacities in the potential window of 3−1 V vs. Na+/Na.
The rate performance of different sizes of graphite (Fig. 4b) was further evaluated. Reducing the particle size can shorten the diffusion distance and increase the rate capability [23,24]. The G-1.7 µm anode shows the best rate performance among the four samples. At a current density of 10 A/g, the specific capacities of G-25 µm, G-12 µm, G-6.7 µm, and G-1.7 µm anodes are 78, 95, 93, and 100 mAh/g, respectively (Fig. 4c). Even at 20 and 50 A/g, the G-1.7 µm anode delivers the specific capacities of 89 and 54 mAh/g, respectively. In addition, all four graphite anodes display negligible capacity loss after 2000 cycles at 2 A/g (Fig. 4d), indicating that the graphite size has no influence on the cycling performance.
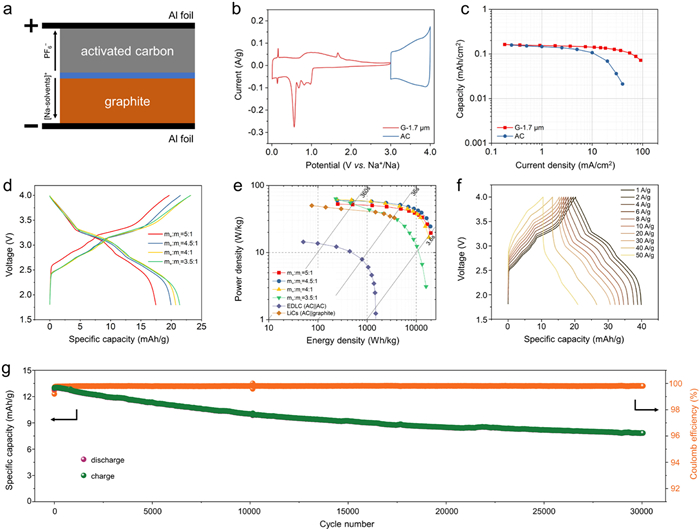
Owing to the rapid co-intercalation reaction of the G-1.7 µm anode with boosted capacitor-like responses, a hybrid SIC was assembled (Fig. 5a). Using EDLC-type adsorption PF6− on the AC cathode and co-interaction of [Na(diglyme)x]+ into graphite (Fig. 5b), the SICs can be directly assembled without any pre-sodiation treatments. To meet the requirements for practical applications, the commercialized AC thick-film electrode with a single-sided thickness of ~100 µm and a mass loading of ~5.0 mg/cm2 is used. The EDLC-type AC cathode electrode has excellent high-rate performance, showing matched kinetics between the cathode and anode (Fig. 5c).
Figure 5
Figure 5.
High performance hybrid sodium-ion capacitors. (a) Schematic of the hybrid SIC, composed of positive AC and negative graphite electrodes (b) CV curves of graphite anode (G-1.7 µm) and AC cathode. (c) Comparison of the rate capabilities of the AC positive electrode and G-1.7 µm negative electrode. (d) Charge‒discharge profiles of SICs at different mass ratio of cathode and anode. (e) Ragone plots of the hybrid SIC (G-1.7 µm||AC) and reported commercial LICs. (f) Related charge and discharge curves of the hybrid SIC. (g) Cycling performance of hybrid SICs.
The mass ratio of the cathode and anode materials critically influences the energy density and power density of SICs. An ideal capacitor design should ensure that the capacities of the cathode and anode materials are well-matched to achieve optimal energy density. When the mass ratio between cathode and anode is imbalanced, the "excess" electrode results in the underutilization of the capacity or the decomposition of electrolyte under an unmatched potential window. Therefore, the m+:m− ratios ranging from 5:1, 4.5:1, 4:1, and 3:1 were meticulously controlled, and their electrochemical performances were systematically compared. The capacity, energy density and power density are calculated based on the total weight of the cathode and anode materials. Fig. 5d shows the related GCD profiles with different mass ratios at 0.5 mA/cm2. It is revealed a negative correlation between the mass ratio of the cathode material and the SICs capacity. As the mass ratio of the cathode material decreases, the SICs capacity increases significantly, accompanied by a rise in the discharge working potential. Specifically, for SICs with m+:m− ratios of 5:1, 4.5:1, 4:1, and 3:1, the corresponding capacities are 17, 20, 21 and 22 mAh/g, respectively.
Rogan plots of hybrid SICs with different mass ratios are compared in Fig. 5e. The SIC of m+:m− = 4.5:1 exhibits the best combination of both energy density and power density. It shows the energy densities of 60, 45, 32 and 24 Wh/kg at the power densities of ~240,9000, 16,000 and 19,400 W/kg, respectively, highlighting the excellent rapid charging and high power delivering performance. In comparison, commercial LICs (AC||graphite) exhibited an energy density of only 44.7 Wh/kg at a power density of ~300 W/kg [41]. The charge and discharge curves (Fig. 5f) also support the feasibility of high-power performance. The hybrid SIC displays a capacity retention of 60.8% after 30,000 cycles at 8 A/g (corresponding to a (dis)charging time of 10 s, that is ~360 C) (Fig. 5g).
In summary, the [Na(diglyme)x]+ co-interaction into natural graphite anodes with different particle sizes ranging from 25 µm to 1.7 µm are systematically investigated through detailed kinetics analysis and in-situ XRD characterization. On the basis of these results, we provide new insight into the co-interaction mechanism of graphite. In addition to the reduced particle sizes increasing the rate performance, importantly, the reaction pathways of the co-intercalation and co-extraction are different. When the graphite size is largely reduced to 1.7 µm, the degree of asymmetry increases, leading to the loss of phase transitions during the co-extraction process and the disappearance of the sharp anodic redox peak observed in the CV curves. Kinetics analysis indicates that the smaller-sized graphite significantly increases the capacitor-like responses and additional surface adsorption reactions with increased capacity. Finally, the G-1.7 µm anode is used for developing a hybrid SIC, with the waiving of complex presodiation treatment. Remarkably, the optimized hybrid SIC delivers high energy density of 62 Wh/kg at 240 W/kg and high power density of ~16,000 W/kg with an energy density of 32 Wh/kg. Additionally, the hybrid SIC shows ultralong 30,000 stable cycles. This work provides fundamental insight into the Na+-solvent co-intercalation mechanism with tunable capacitor-like kinetics, which is promising for developing low-cost sodium-ion storage devices with both high energy and high power densities.
Declaration of competing interest
The authors declare that they have no known competing financial interests or personal relationships that could have appeared to influence the work reported in this paper.
CRediT authorship contribution statement
Xiaojuan Huang: Writing – original draft, Visualization, Methodology, Formal analysis, Data curation, Conceptualization. Zerui Yan: Writing – original draft, Methodology, Investigation, Formal analysis, Data curation. Xiaoqing Chang: Validation, Data curation, Conceptualization. Dafu Tang: Software, Formal analysis, Data curation. Qiulong Wei: Writing – review & editing, Writing – original draft, Supervision, Resources, Investigation, Funding acquisition, Formal analysis, Data curation, Conceptualization.
Acknowledgments
This work was supported by the National Natural Science Foundation of China (Nos. 22179113 and 22479123) and the Fundamental Research Funds for the Central Universities (No. 20720230028).
Supplementary materials
Supplementary material associated with this article can be found, in the online version, at doi:10.1016/j.cclet.2025.110953.
J. Liu, T. Yin, B. Tian, et al., Adv. Energy Mater. 9 (2019) 1900579. doi: 10.1002/aenm.201900579
[38]
H. Andersen, L. Djuandhi, U. Mittal, et al., Adv. Energy Mater. 11 (2021) 2102693. doi: 10.1002/aenm.202102693
[39]
H. Kim, J. Hong, G. Yoon, et al., Energy Environ. Sci. 8 (2015) 2963–2969. doi: 10.1039/C5EE02051D
[40]
B. Jache, P. Adelhelm, Angew. Chem. Int. Ed. 126 (2014) 10333–10337. doi: 10.1002/ange.201403734
[41]
L. Caizán-Juanarena, M. Arnaiz, E. Gucciardi, et al., Adv. Energy Mater. 11 (2021) 2100912. doi: 10.1002/aenm.202100912
Figure 1
Materials characterization of natural graphite powders. (a) Particle size intensity distribution curves from laser scattering measurements, (b) XRD patterns, (c) Raman spectra and (d) BET surface areas of different natural graphite samples. SEM images of the (e) G-25 µm, (f) G-12 µm, (g) G-6.7 µm and (h) G-1.7 µm powders.
Figure 2
CV curves of the (a) G-25 µm, (b) G-12 µm, (c) G-6.7 µm and (d) G-1.7 µm electrodes at different sweep rates of 0.2–1.0 mV/s. (e) The fitted b-values of the (de)sodiation peaks of different-sized graphite electrodes.
Figure 3In situ XRD results of the G-1.7 µm electrode: (a) Corresponding charge‒discharge profiles and (b) corresponding in situ XRD patterns during the initial 2 cycles.
Figure 4
Electrochemical performance of different-sized graphite anodes. (a) The (dis)charge profiles of the four graphite anodes at 0.1 A/g. (b) Rate performance for the G-25 µm, G-12 µm, G-6.7 µm and G-1.7 µm anodes. (c) The (dis)charge profiles of the four graphite anodes at 10 A/g. (d) Cycling performance at a specific current of 2 A/g for the G-25 µm, G-12 µm, G-6.7 µm and G-1.7 µm anodes.
Figure 5
High performance hybrid sodium-ion capacitors. (a) Schematic of the hybrid SIC, composed of positive AC and negative graphite electrodes (b) CV curves of graphite anode (G-1.7 µm) and AC cathode. (c) Comparison of the rate capabilities of the AC positive electrode and G-1.7 µm negative electrode. (d) Charge‒discharge profiles of SICs at different mass ratio of cathode and anode. (e) Ragone plots of the hybrid SIC (G-1.7 µm||AC) and reported commercial LICs. (f) Related charge and discharge curves of the hybrid SIC. (g) Cycling performance of hybrid SICs.

 DownLoad:

 下载:
下载:


 下载:
下载:
