Beijing Key Laboratory of Construction Tailorable Advanced Functional Materials and Green Applications, School of Materials Science and Engineering, Beijing Institute of Technology, Beijing 100081, China
b.
Scientific-Practical Materials Research Centre, National Academy of Sciences of Belarus, Minsk 220072, Belarus
* Corresponding author. E-mail address: yjli@bit.edu.cn (Y. Li). 1 These authors contributed equally to this work.
Received Date:
11 December 2024 Accepted Date:
19 January 2025 Revised Date:
11 January 2025 Available Online:
15 May 2026
Abstract:
The replacement of Pt/C catalysts with Pt-based alloy catalysts was considered a promising strategy to reduce platinum-group-metal (PGM) content in proton exchange membrane fuel cell. However, inexpensive transition metal atoms in Pt-based alloy catalysts are subject to metal dissolution issues, leading to stability issues of oxygen reduction reaction (ORR) catalysts. In this work, a PtCuNi/C-WO3-x catalyst is designed employing non-stoichiometric WO3-x with abundant oxygen vacancies (Ovac). The WO3-x can dramatically improve the stability of PtCuNi without sacrificing the activity. Theoretical calculation suggests a decreased vacancy formation energy of W in WO3-x at the presence of Ovac, as well as increased vacancy formation energies of Pt/Cu/Ni in PtCuNi alloy particles with the existence of surface W dopant. Combined with the experimental discovery of slower dissolution rates of metals in PtCuNi/C-WO3-x catalyst, a dissolution-induced stability enhancement mechanism is proposed, whereby facilitated dissolution of W atoms from WO3-x bulk could re-deposit on Pt-alloy surface and inhibit the dissolution of catalytically active metal atoms, revealing a dynamic process that enhances the stability. The PtCuNi/C-WO3-x also shows great potential to be used as cathode catalyst in membrane electrode assembly for high-temperature proton exchange membrane fuel cells.
Proton exchange membrane fuel cell (PEMFC), with the merits of fast start-up, low operating temperature, and high-power density, has been deployed as power conversion technology for transportation and portable applications [1-3]. However, the large-scale commercialization of PEMFCs still faces challenges [4,5]. One of them is to lower the cost by reducing the loading of PGM catalyst while maintaining their catalytic performance towards the oxygen reduction reaction (ORR) at the cathode [6,7]. Some PGM-based alloy catalysts, by alloying Pt with inexpensive transition metal atoms (Cu [8,9], Co [10,11], Ni [12-14], Fe [15,16], etc.), have demonstrated enhanced activities compared with the commercial Pt/C catalysts [17,18]. However, the transition metal atoms suffer from chemical and electrochemical dissolution from the bulk after long-term operation, which devastates the catalyst structure and their degradations [19-21]. Furthermore, the dissolved transition metal atoms will re-deposit on the catalyst surface, masking the active sites of the catalyst [22,23]. Therefore, the stability issue of alloy catalysts has always been a key obstacle to their commercialization.
Tungsten (W), a corrosion resistant transition metal, has the advantages of low cost and high electrochemical stability, which has received widespread attention in the field of electrocatalysis [24,25]. Sachin et al. [26] successfully loaded Pt nanoparticles (NPs) on the tungsten oxide nanorods, which demonstrated excellent electrochemical stability at potential window (1.0–1.5 V) of carbon corrosion. Tungsten oxide (WOx), as a semiconductor material with poor conductivity, may increase the electrical resistance in the catalyst [27]. Besides, in acidic media, there is still a risk of dissolution of WO3, which will first form hydrogen tungsten bronze (HxWO3) and dissolve in electrolyte, resulting in the loss of Pt loaded on it [28]. A recent work has shown that when W atoms are doped on the surface of Pt-based particles, the ORR activity and catalyst stability can both be improved, because the W atoms doped on alloy particles surface can synergistically interact with neighboring atoms to mitigate the adsorption energies of oxygen intermediates on Pt [29], and effectively suppress their leaching through serving as pinning points on undercoordinated sites to stabilize the step edges [30]. Wang et al. [31] doped W atoms onto the surface of a PtNi catalyst, improving both its performance and stability. Furthermore, a single-atom network of W formed on the carbon-based support was discovered to promote the proton transport in the cathode in membrane electrode assembly. However, the synthetic strategies to dope or alloy W atoms in Pt-based NPs are not only limited but also complex and inefficient.
Therefore, to incorporate W species in Pt alloy catalysts without affecting their ORR activity, it is of high necessity to develop strategies to dope W atoms in a straightforward approach. Non-stoichiometric WO3 with oxygen vacancies have attracted broad attention due to high electrical conductivity and unique electronic structure [24,32]. However, it has also been discovered that WO3 with oxygen vacancies are slightly vulnerable in terms of thermodynamic stability, leading to slow structural destruction and hence W dissolution in electrochemical reactions [33,34].
In this work, inspired by the slow dissolution kinetics of non-stoichiometric oxygen vacancy-containing WO3-x, a new nano-structure design strategy is developed for Pt-alloy catalysts, e.g., PtCuNi/C, to enhance their stability. Tungsten oxide WO3-x with controlled oxygen vacancies are synthesized using hydrothermal method. The PtCuNi/C-WO3-x catalyst was prepared by a two-step self-assembly method, with the advantages of simplicity and low cost. The first-principles density functional theory calculation indicates that oxygen vacancies on the WO3-x surface can de-stabilize the W atoms compared with those on Ovac-free WO3. The accelerated degradation testing (ADT) shows that Ovac can trigger the slow dissolution of W atoms at operation electrochemical potentials which could re-deposit onto PtCuNi surface. The W atoms can suppress further dissolution of the Pt-based NPs, and stabilize the PtCuNi/C catalyst in a dynamic way. The enhanced dynamic stability of Pt-alloy catalyst enabled by incorporating Ovac-containing WO3-x provides a new method to stabilize the Pt-based alloy ORR catalyst.
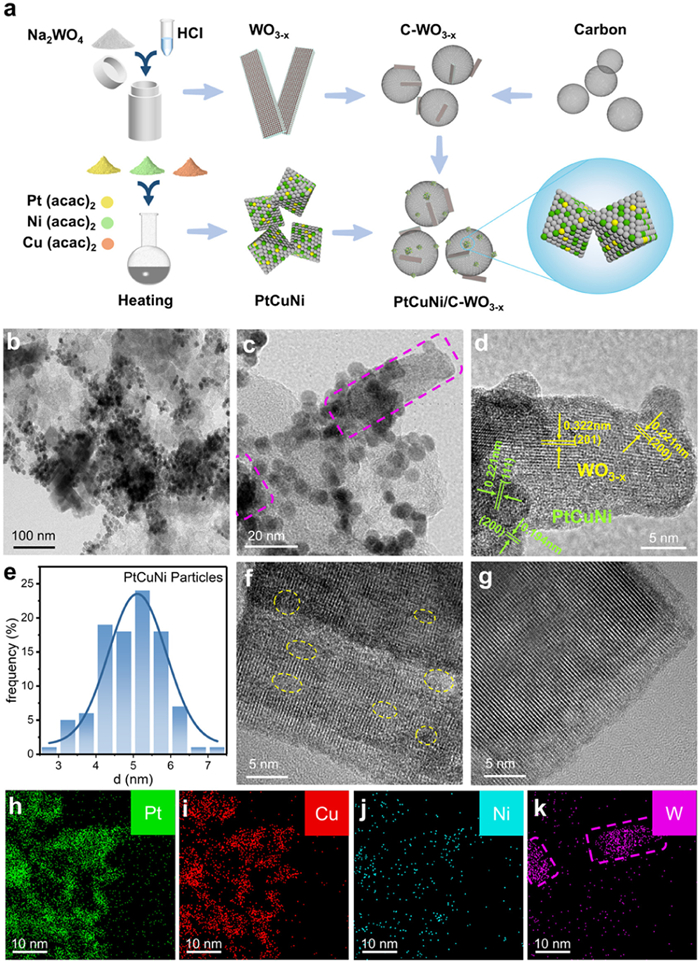
The catalysts were synthesized through a straightforward two-step solution method as shown in Fig. 1a. Briefly, the wet chemical method reduction protocol was used to obtain uniformly sized PtCuNi alloy NPs (Fig. S1a in Supporting information), wherein the BDO serves as the reducing agent, PVP as capping agent and NaBr as structure-directing agent. Two types of tungsten oxide (WO3, WO3-x) are synthesized by hydrothermal methods (Figs. S1d and e in Supporting information). The PtCuNi/C-WO3 and PtCuNi/C-WO3-x were prepared through a two-step self-assembly method. Tungsten oxide and carbon black were assembled in liquid phase through capillary action to prepare the carbon support, followed by the loading of alloy NPs on the composite support in the same way to prepare the PtCuNi/C-WO3 and PtCuNi/C-WO3-x catalyst. The TEM image (Fig. 1b) shows that PtCuNi NPs and WO3-x synthesized by wet chemical method were successfully loaded on the carbon surface. It is worth noting that the PtCuNi particles tend to be loaded around tungsten oxide during the self-assembly process as a result of the electrostatic interaction between PtCuNi particles and tungsten oxide.
Figure 1
Figure 1.
(a) Schematic illustration of synthesis procedures for PtCuNi/C-WO3-x catalyst. (b, c) Particle distribution, (d) high resolution TEM image, (e) particle size distribution of PtCuNi particles. High resolution TEM images of (f) WO3-x and (g) WO3, (h-k) Element mapping images (Pt, Cu, Ni and W) of PtCuNi/C-WO3-x.
The high-magnification TEM image (Fig. 1c) shows the micro-structure of PtCuNi particles loaded on the surface of tungsten oxide with oxygen vacancies. The lattice fringes in tungsten oxide (Fig. 1d and Fig. S2 in Supporting information) show lattice spacings of 0.322 and 0.211 nm, corresponding to (201) and (200) crystallographic planes of hexagonal tungsten oxide [35]. The lattice spaces of 0.221 and 0.194 nm in PtCuNi particles correspond to (111) and (200) crystallographic planes of face-centered cubic (fcc) PtCuNi [36-38]. XRD spectra (Fig. S3 in Supporting information) display (111) and (200) peaks of fcc-PtCuNi at 41.8° and 48.4°. Compared with commercial Pt/C, the positive shift of the (111) peak confirms the successful alloying of Pt [39,40]. There is no splitting of (111) peak, indicating the uniform alloying in the catalyst. ICP results (Table S1 in Supporting information) show the Ni content < 1%, suggesting the dominant metals of Pt and Cu in the alloy NPs. The size distribution histogram of 100 randomly selected PtCuNi particles (Fig. 1e) confirm that the size of PtCuNi NPs falls within 4–6 nm. The high-resolution TEM image of WO3-x (Fig. 1f) shows many breakpoints in the lattice fringes, due to the increased surface defects in WO3-x. This is speculated to be related to the absence of oxygen, in contrast to the faultless lattice fringes in home-made WO3 (HM-WO3) in Fig. 1g. Figs. 1h-k show the element mapping images using energy-dispersive X-ray spectroscopy (EDX) with HADDF-STEM. The Pt, Cu, and Ni are uniformly distributed through the catalyst, with W centralized only on WO3-x.
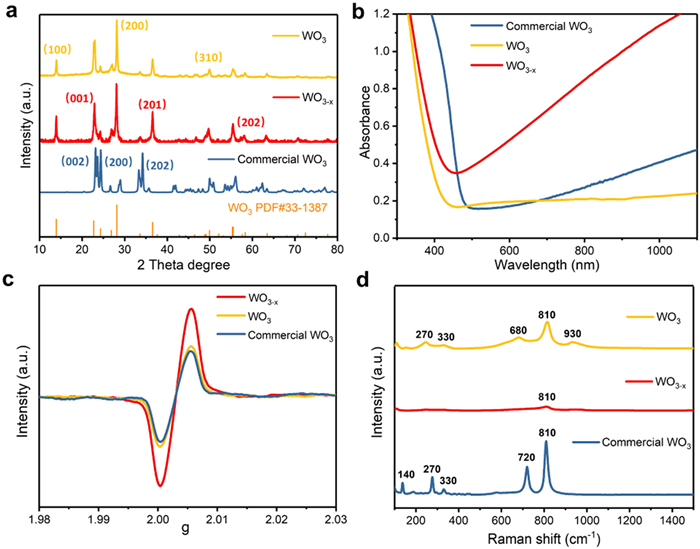
To gain insights into the structural differences in WO3 induced by the oxygen vacancies, further characterizations are carried out specifically on WO3. The diffraction peaks at 13.94°, 22.92°, 28.06° and 36.58° (2θ) in XRD patterns (Fig. 2a) can be ascribed to interferences of the (100), (001), (200) and (201) crystallographic planes of hexagonal HM-WO3, respectively, indicating that the crystal structure is not affected by the non-stoichiometry. However, for the commercial WO3, its XRD pattern suggests a monoclinic crystallographic structure [35]. Besides, the diffraction peaks of WO3-x are slightly broader than those of HM-WO3 in the range of 20°−30°, which also confirm that defects may exist in WO3-x and affect the integrity of the crystal structure. The ultraviolet visible (UV) spectra (Fig. 2b) shows that the WO3-x has an obvious absorption band at 800–1100 nm compared with HM-WO3 and commercial WO3 (c-WO3), which could be associated with the localized surface plasmon resonance (LSPR) caused by the oxygen vacancies which could lead to a strong light absorption in the visible to near-infrared region [41,42]. Electron paramagnetic resonance (EPR) is commonly used to investigate the oxygen vacancies in inorganic materials. The EPR spectra in Fig. 2c shows a main resonance line located at the electron g-factor of around 2.003, which is originated from the unpaired electrons trapped on oxygen vacancies [43]. It confirms that the synthesized WO3-x contains more unpaired electrons concentration induced by oxygen vacancies compared with the HM-WO3 and c-WO3. In addition, Raman spectrometry was conducted to further verify the existence of oxygen vacancies (Fig. 2d). The c-WO3 shows a vibration peak at 810 cm [44] which corresponds well to the tensile vibration of W(Ⅵ)-O. The smaller size of HM-WO3 and WO3-x leads to the decreased peak at 810 cm. It is worth noting that both of HM-WO3 and WO3-x show a new board peak at 930 cm caused by the tensile vibration of W(Ⅵ)=O of the terminal O atom [45]. Guillen et al. [44] reported that with the increased oxygen vacancy (Ovac) content, the scattering of Raman spectrum was also increased by the multivalence-state tungsten species (W6+, W5+ and W4+), which may result in the weak response of vibration intensity of the chemical bond in the Raman spectrum. Therefore, the attenuated peaks of WO3-x in the Raman spectrum indicate the presence of the multivalence-state tungsten species in WO3-x induced by Ovac. The results of UV–vis absorption, EPR and Raman spectrum all demonstrate the existence of oxygen vacancy in WO3-x.
Figure 2
Figure 2.
(a) XRD patterns, (b) ultraviolet-visible absorption spectrum (UV), (c) electron paramagnetic resonance spectrum (EPR) and (d) Raman spectrum of WO3, WO3-x and commercial WO3.
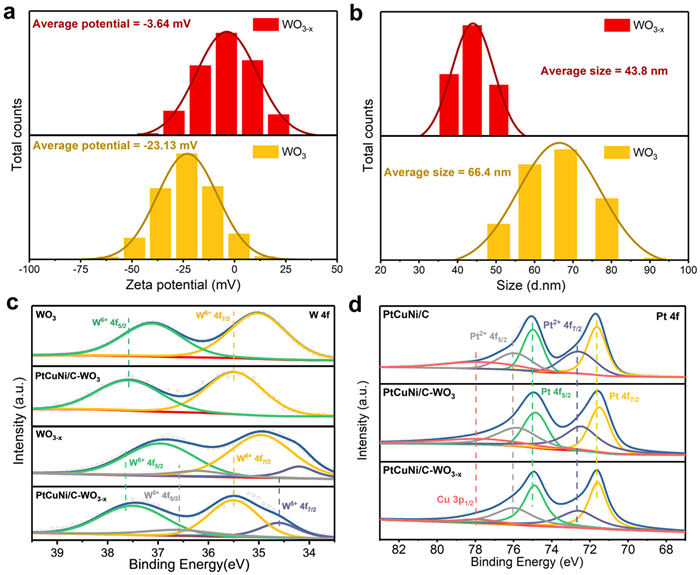
The zeta potential and particle size of WO3-x and HM-WO3 were measured by granulometer (Fig. 3a). The HM-WO3 has a negative surface potential of −23.13 mV, while WO3-x possesses a more electrically neutral potential at −3.64 mV. Due to the large number of unpaired electrons on WO3-x surface, it tends to attract the positive charge in the solution, resulting in a positive shift of surface potential, consistent to the previous studies which discovered higher surface potential on metal oxides with the presence of Ovac [46-48]. In addition, the average sizes of WO3-x and HM-WO3 (equivalent to spheres) were measured by dynamic light scattering (Fig. 3b), which were 43.8 and 66.4 nm, respectively. The XPS of W 4f show (Fig. 3c) W6+ 4f5/2 and W6+ 4f7/2 peaks in both HM-WO3 and WO3-x at 37±0.1 eV and 35.0 ± 0.1 eV with two additional sub-peaks at 36.2 ± 0.1 eV and 34.2 ± 0.1 eV of W5+ 4f5/2 and W5+ 4f7/2 in WO3-x. This further verifies the existence of Ovac in WO3-x. The W 4f peaks, upon integration to PtCuNi and carbon, shift to obviously higher binding energies. As for XPS of Pt 4f shown in Fig. 3d, the stronger doublet peaks located at 71.6 ± 0.1 eV and 75±0.1 eV can be assigned to the Pt0 4f7/2 and Pt2+ 4f7/2, while the other doublet locates at 72.6 ± 0.1 eV and 76±0.1 eV are associated to Pt0 4f5/2 and Pt2+ 4f5/2. In addition, the Cu0 3p1/2 peak can be found at 78.4 ± 0.1 eV [49]. Obviously, the peaks of Pt0 and Pt2+ shift to lower binding energies upon the addition of the HM-WO3, suggesting that a strong interaction established between W and Pt resulted from the electron transfer from W atoms to Pt atoms. Theoretically, the WO3-x with Ovac is expected to possess more electrons to donate to Pt atoms. It is interesting that, compared to the PtCuNi/C-WO3-x, PtCuNi/C-WO3 seems to show stronger interaction between alloy surface and HM-WO3. Based on the Zeta potential result, it is speculated that the surface of WO3-x is more likely to adsorb positively charged species [50], which not only increases the zeta potential but also weakens the electronic interaction between W and Pt atoms.
Figure 3
Figure 3.
The (a) zeta potential and (b) particle size distribution diagrams of WO3-x and WO3. (c) W 4f XPS spectrum of WO3, WO3-x, PtCuNi/C-WO3, and PtCuNi/C-WO3-x. (d) Pt 4f XPS spectrum of PtCuNi/C, PtCuNi/C-WO3, and PtCuNi/C-WO3-x.
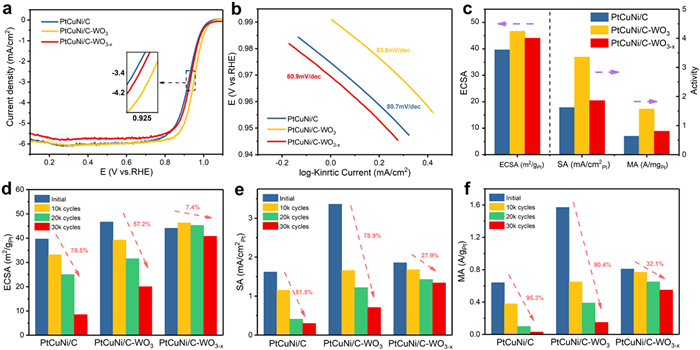
The initial ORR activity and stability of the catalysts were evaluated. During the test, the ink solution dissolved with the sample was uniformly dropped on the surface of the glassy carbon electrode (GCE) to ensure the formation of a uniform film (20 µgPt/cm2). The LSV curves (Fig. 4a) show a positive shift of half-wave potential (E1/2) for catalysts with WO3 and WO3-x, which can be attributed to the electronic interaction between WO3 and PtCuNi. The E1/2 decreased in the order of PtCuNi/C-WO3 > PtCuNi/C-WO3-x > PtCuNi/C, which is consistent with the shift of Pt 4f binding energy in the XPS spectra and proving that the enhanced ORR is related to the interaction strength between W and Pt. The Tafel slope is slightly lower after the inclusion of WO3, while the difference is not significant between WO3 and WO3-x (Fig. 4b).
Figure 4
Figure 4.
The initial (a) LSV and (b) Tafel plots of PtCuNi/C, PtCuNi/C-WO3 and PtCuNi/C-WO3-x, and (c) statistical results of ECSAs, SAs and MAs. (d-f) Statistic data summary of ECSAs, SAs and MAs after ADT tests.
CV curves are used to calculate their ECSAs (Fig. S4a in Supporting information). The hydrogen desorption areas (0.05–0.3 V vs. RHE) of PtCuNi/C-WO3-x and PtCuNi/C-WO3 are slightly larger than PtCuNi/C. It has been reported in previous studies [28] that WO3 reacts with protons into hydrogen tungsten bronze (HxWO3) which can transformed back to WO3 by losing protons as Eqs. 1 and 2:
To eliminate the influence on ECSA from the proton adsorption and desorption on tungsten oxide, CV scans were performed for WO3-x and HM-WO3 with equal mass in the PtCuNi/C-WO3-x and PtCuNi/C-WO3 (Fig. S4b in Supporting information). It can be calculated that the ECSA contribution from the protonation/de-protonation in HM-WO3 is only 0.37 m2/g (HM-WO3) and 0.3 m2/g (WO3-x), respectively, which can almost be ignored. As shown in Fig. 4c, the ECSAs are increased to 46.68 and 44.08 m2/g for PtCuNi/C-WO3 and PtCuNi/C-WO3-x, respectively, compared to that PtCuNi/C at 39.69 m2/g, which is attributed to synergistic effect due to formation of an interface between the PtCuNi and tungsten oxide [51]. Additionally, PtCuNi/C-WO3 demonstrates the best initial specific activity (SA) and mass activity (MA) of which are 3.36 mA/cm2 and 1.57 A/mgPt, respectively. The activities of PtCuNi/C-WO3-x, calculated to be 1.86 mA/cm2 (SA) and 0.81 A/mgPt (MA), are higher than W-free PtCuNi/C and commercial Pt/C (c-Pt/C) (Fig. S5 in Supporting information).
To investigate the impact of WO3 on the stability of the catalyst, the potential is cycled within 0.6–0.95 V vs. RHE, at a sweep rate of 100 mV/s for 30,000 cycles. The are determined at intervals of 10,000 cycles (Fig. S6 in Supporting information). After the ADT tests, the ECSAs losses of PtCuNi/C and PtCuNi/C-WO3 reached 78.5% and 57.2%, repectively, compared to the initial ECSAs, along with 81.5% and 78.9% decayed SAs, 96.3% and 90.4% decayed MAs. It is noteworthy that after 10,000 cycles, the ECSA of the PtCuNi/C-WO3-x catalyst slightly increases. This phenomenon can be attributed to the leaching of Cu and Ni atoms from the alloy particles, which results in the surface roughening and the exposure of additional platinum active sites. Surprisingly, although the initial performance of PtCuNi/C-WO3-x is lower than PtCuNi/C-WO3, the PtCuNi/C-WO3-x shows an excellent stability by losing only 7.4%, 27.9% and 32.1% in ECSA, SA and MA, respectively, with much lower degradation than PtCuNi/C, PtCuNi/C-WO3 and c-Pt/C (Figs. 4d-f and Fig. S5). This could be attributed to the rearrangement of metal atoms on the catalyst surface during ADT cycling [30], with trace W atoms migrating from the WO3 surface to the PtCuNi alloy particles, which enhances the interaction between W and Pt, Cu, and Ni atoms, preventing further dissolution of Pt, Cu, and Ni atoms [26]. Compared to WO3, the higher density of defects on the surface of WO3-x caused by oxygen vacancies, which results in easier dissolution of surface tungsten atoms and accelerates tungsten atomic rearrangement during the ADT tests [33,34].
To explore the influence of the WO3-x content on the stability of PtCuNi alloy catalysts, three catalysts with different WO3-x contents, PtCuNi/C-WO3-x-L (3.97 wt% W), PtCuNi/C-WO3-x (5.70 wt% W), and PtCuNi/C-WO3-x-H (8.68 wt% W), are further synthesized and evaluated. The W contents in catalysts are measured by inductively coupled plasma optical emission spectro- metry (ICP-OES), with detailed data provided in Table S1 (Supporting information).
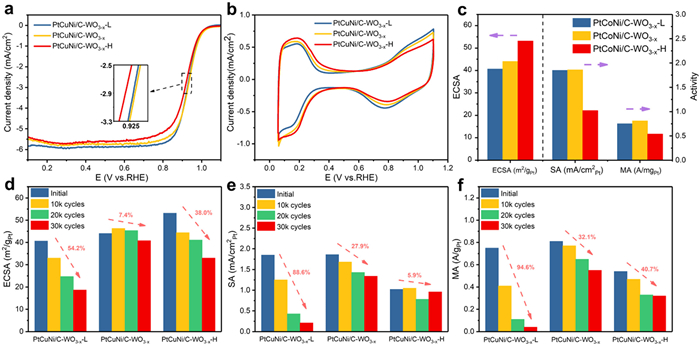
Fig. 5a shows that the half-wave potential improved from 0.926 V to 0.931 V as the W content increased from 3.97 wt% to 5.70 wt%. However, with a further increase of W content to 8.68 wt%, the half-wave potential of the catalyst decreased to 0.919 V, which is even lower than the 0.920 V of PtCuNi/C. This is due to the increase in charge transfer resistance of the catalyst, caused by the excessive addition of WO3-x with low electrical conductivity. It is worth noting that with the increased W content, the synergistic effect in the catalyst becomes more intense, resulting in an intensified hydrogen underpotential adsorption/desorption (Fig. 5b). Nonetheless, the increased ECSA does not contribute to the ORR performance. To further verify the relationship between the content of WO3-x and the stability of the catalyst, ECSA, SA and MA of the above catalysts were determined (Fig. S7 in Supporting information) at intervals of 10,000 cycles. Figs. 5c-f illustrate that the initial electrochemical performance of PtCuNi/C-WO3-x-L is close to PtCuNi/C-WO3-x, with SA of 1.85 mA/cm2 and MA of 0.75 A/mgPt. After ADT test, the ECSA, SA, and MA of PtCuNi/C-WO3-x-L dropped by 54.2%, 88.6%, and 94.6%, respectively. A small amount of WO3-x can effectively improve the beginning-of-life (BOL) performance but with very little contribution to enhance stability. Besides, the PtCuNi/C-WO3-x-H shows declines of 38%, 5.9%, and 40.7% in ECSA, SA, and MA, respectively. Notably, the loss of SA for PtCuNi/C-WO3-x-H is even lower than that of PtCuNi/C-WO3-x, suggesting that a higher adding amount of WO3-x can effectively enhance the stability of the catalytic sites in ORR. The losses in ECSA and MA are slightly higher than PtCuNi/C-WO3-x, which could be attributed to the re-arrangement of surface atoms during ADT cycling, leading to excessive W doping on the PtCuNi particles covering the active sites. In conclusion, the amount of added WO3-x influences the stability catalysts with a volcano-shaped trend, whereby the PtCuNi/C-WO3-x (5.70 wt% W) with intermediate amount of WO3-x exhibits the optimal performance.
Figure 5
Figure 5.
The initial (a) LSV and (b) CV plots of PtCuNi/C-WO3-x-L, PtCuNi/C-WO3-x and PtCuNi/C-WO3-x-H, and (c) statistical results of ECSAs, SAs and MAs. (d-f) Statistic data summary of ECSAs, SAs and MAs after ADT tests.
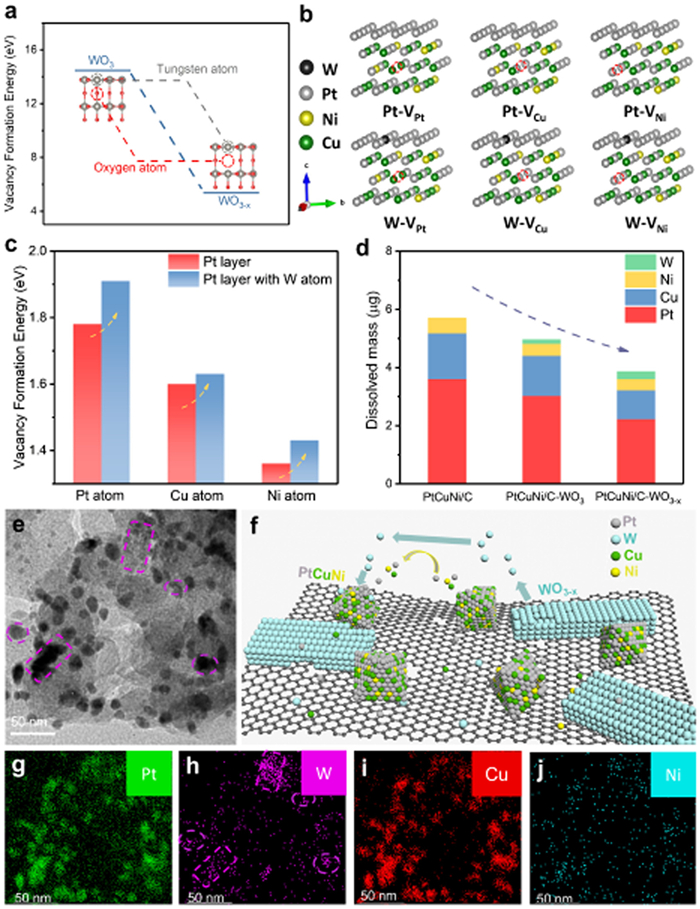
As previously mentioned, it is speculated that the dissolving W atoms from the surface of tungsten oxide could deposite on the surface of alloy NPs, and inhibit the leaching of metal atoms by interacting with the inner layer of Pt, Cu, Ni atoms. In this regard, WO3-x is more effective in improving stability, because the W atoms around the Ovac sites are more unstable, rendering a faster kinetics in W dissolution and re-deposition processes. To assess the possibility of W dissolution from the WO3, physical models of WO3 and WO3-x were established (Fig. 6a) to calculate the vacancy formation energy of W. The WO3 and WO3-x surface was modeled by a slab structure with two layers of atoms, representing the (200) face of the crystal with hexagonal structure and each layer contains 6 tungsten atoms, which are connected by oxygen atoms (Fig. S8 in Supporting information). Besides, one oxygen atom in WO3-x is removed to simulate an Ovac sites. The calculation reveals that the vacancy formation energy of W atoms surrounding Ovac sites in WO3-x (5.74 eV) is only about one-third of the W atoms in WO3 (14.24 eV) with structural integrity. The big difference in vacancy formation energy indicates that the presence of neighboring Ovac site could lead to the structural distortion to the near-surface W atoms, which could drive the dissolution of W from the surface, hence releasing W from the WO3-x.
Figure 6
Figure 6.
(a) The vacancy formation energies of W atom in WO3 and WO3-x. (b) Calculated models for (c) vacancy formation energies of atom (Pt, Cu and Ni). (d) Dissolved mass comparison of PtCuNi/C, PtCuNi/C-WO3 and PtCuNi/C-WO3-x. (e) High resolution TEM image of PtCuNi/C-WO3-x after ADT test. (f) The schematic diagram of metal particle dissolution and re-deposition in ADT testing. (g-j) Element mapping images (Pt, Cu, Ni and W) of PtCuNi/C-WO3-x after ADT test.
To further understand the influencing of W on the stability of PtCuNi NPs, the PtCuNi alloy surface was modeled by a slab structure with four layers of atoms, which represents the (111) face of the crystal with face-centered cubic (FCC) structure. The topmost layer was only composed of Pt and the Pt, Cu, Ni atoms were randomly distributed in the second to fourth layers. In order to more intuitively compare the effect of W on the stability of alloy particle without changing the crystal structure, a surface platinum atom was replaced with W atom to calculate the vacancy formation energy of Pt, Cu, and Ni atoms at inner-layer (Fig. 6b). The vacancy formation energies of inner-layer Pt, Cu, and Ni atoms increase by 0.13 eV, 0.03 eV, and 0.07 eV with the presence of W atom on the outermost layer which is deposited onto the surface from WO3 surface (Fig. 6c). It suggests that the re-deposition of W atoms on the surface of PtCuNi NPs can effectively suppress the loss of internal metallic atoms in the bulk. To validate the implication from the theoretical calculations, the dissolution rates of Pt, Cu, and Ni were determined by measuring the metal concentration in the collected electrolyte by ICP-OES after ADT cycling at high catalyst loadings (200 µg/cm2) for PtCuNi/C, PtCuNi/C-WO3 and PtCuNi/C-WO3-x. It was found that the amount of W dissolved from PtCuNi/C-WO3-x is twice that from PtCuNi/C-WO3, while the total dissolution amount of other metals is 36.7% lower than that dissolved from PtCuNi/C (Fig. 6d).
By collecting all the catalysts from the ADT tests, the TEM image of PtCuNi/C-WO3-x in Fig. 6e, with purple circles indicating the PtCuNi particles and purple squares highlighting the nano WO3-x, shows slight size increase of PtCuNi after the ADT, but with different rates. As shown in Fig. S9 (Supporting information), the average alloy NPs size increased from 4.95 nm to 7.25 nm (PtCuNi/C), 7.11 nm (PtCuNi/C-WO3), and 6.25 nm (PtCuNi/C-WO3-x) after ADT tests, clearly showing the higher growth resistance of the catalyst with the WO3-x. This is due to the Oswald curing of metal nanoparticles with potential cycle (Fig. 6f) [52]. The elements mapping image showing distributions of Pt, W, Cu, and Ni in Figs. 6g-j of PtCuNi/C-WO3-x reveal the overlapping regions of all elements around the PtCuNi particles, especially, highlighted by purple circles in Fig. 6h, which further confirms the occurrence of W dissolution from WO3-x/WO3 and their re-deposition on PtCuNi surface. One may also notice the morphological variations of PtCuNi NPs along with their size growth, implying that the W atoms are stabilizing the PtCuNi NPs in a dynamic way, by stabilizing the surface structure instead of the bulk. To evaluate the practical viability of PtCuNi/C-WO3-x as cathode catalyst, membrane electrode assembly (MEA) were prepared by using them as cathode layer for high-temperature proton exchange membrane fuel cells (HT-PEMFC). As shown Fig. S10 (Supporting information), when evaluating the MEA performance at 140 ℃ without back pressure, the peak power of the MEA with PtCuNi/C-WO3 reached 272 mW/cm2 with H2_O2 and 92 mW/cm2 with H2-Air) which are 64.4% and 48% higher than the MEA with c-Pt/C cathode.
In summary, a new strategy for enhancing the stability of Pt alloy catalysts has been proposed, by taking advantage of the instability of W atoms in non-stoichiometric WO3-x. The PtCuNi/C-WO3-x catalyst was synthesized by two-step self-assembly method. The electronic interaction between WO3-x and PtCuNi NPs is confirmed to slightly enhance the ORR activity. More importantly, the PtCuNi/C-WO3-x catalyst with non-stoichiometric WO3-x shows dramatically improved stability. Theoretical calculation shows that the vacancy formation energy of W atoms surrounding Ovac sites in WO3-x is much lower than that in intact WO3. Meanwhile, with the presence of W atoms on the Pt-alloy surface, the vacancy formation energies of all metals are increased. Therefore, WO3-x could release W atoms at the presence of oxygen vacancies, allowing W atoms to dissolve and deposit on the Pt-alloy surface and further blocking dissolution of internal atoms in the alloy NPs, hence improving the stability in a dynamic manner. The experimentally discovered lower dissolution rate of metals in PtCuNi/C-WO3-x confirms the enhanced stability facilitated by the Ovac-enabled W dissolution. The dissolution-induced stability enhancement strategy may shed light to the design of highly stable PGM-based alloy catalyst for high-temperature proton exchange membrane fuel cells (HT-PEMFC) and other related applications.
Declaration of competing interest
The authors declare that they have no known competing financial interests or personal relationships that could have appeared to influence the work reported in this paper.
The authors acknowledge the Experimental Center of Advanced Materials (ECAM) for the technical support on material characterization. Y. Li acknowledges the financial support from the National Natural Science Foundation of China (Nos. 52171199, 22479011 and 52211530442).
Supplementary materials
Supplementary material associated with this article can be found, in the online version, at doi:10.1016/j.cclet.2025.110889.
[1]
A. Rodríguez-Castellanos, J.L. Díaz-Bernabé, S. Citalán-Cigarroa, O. Solorza-Feria, 6 - Development and applications of portable systems based on conventional PEM fuel cells, in: P. Ferreira-Aparicio, A.M. Chaparro (Eds.), Portable Hydrogen Energy Systems, Academic Press, 2018, pp. 91–106.
Figure 1
(a) Schematic illustration of synthesis procedures for PtCuNi/C-WO3-x catalyst. (b, c) Particle distribution, (d) high resolution TEM image, (e) particle size distribution of PtCuNi particles. High resolution TEM images of (f) WO3-x and (g) WO3, (h-k) Element mapping images (Pt, Cu, Ni and W) of PtCuNi/C-WO3-x.
Figure 3
The (a) zeta potential and (b) particle size distribution diagrams of WO3-x and WO3. (c) W 4f XPS spectrum of WO3, WO3-x, PtCuNi/C-WO3, and PtCuNi/C-WO3-x. (d) Pt 4f XPS spectrum of PtCuNi/C, PtCuNi/C-WO3, and PtCuNi/C-WO3-x.
Figure 4
The initial (a) LSV and (b) Tafel plots of PtCuNi/C, PtCuNi/C-WO3 and PtCuNi/C-WO3-x, and (c) statistical results of ECSAs, SAs and MAs. (d-f) Statistic data summary of ECSAs, SAs and MAs after ADT tests.
Figure 5
The initial (a) LSV and (b) CV plots of PtCuNi/C-WO3-x-L, PtCuNi/C-WO3-x and PtCuNi/C-WO3-x-H, and (c) statistical results of ECSAs, SAs and MAs. (d-f) Statistic data summary of ECSAs, SAs and MAs after ADT tests.
Figure 6
(a) The vacancy formation energies of W atom in WO3 and WO3-x. (b) Calculated models for (c) vacancy formation energies of atom (Pt, Cu and Ni). (d) Dissolved mass comparison of PtCuNi/C, PtCuNi/C-WO3 and PtCuNi/C-WO3-x. (e) High resolution TEM image of PtCuNi/C-WO3-x after ADT test. (f) The schematic diagram of metal particle dissolution and re-deposition in ADT testing. (g-j) Element mapping images (Pt, Cu, Ni and W) of PtCuNi/C-WO3-x after ADT test.

 DownLoad:

 下载:
下载:


 下载:
下载:
