School of Materials and Chemistry, University of Shanghai for Science and Technology, Shanghai 200093, China
b.
Department of Chemistry, State Key Laboratory of Molecular Engineering of Polymers, Shanghai Key Laboratory of Molecular Catalysis and Innovative Materials, iCHEM, Fudan University, Shanghai 200433, China
c.
Key Laboratory for Advanced Technology in Environmental Protection of Jiangsu Province, Yancheng Institute of Technology, Yancheng 224051, China
d.
Department of Applied Physics, The Hong Kong Polytechnic University, Hong Kong 999077, China
Received Date:
30 November 2024 Accepted Date:
14 January 2025 Revised Date:
03 January 2025 Available Online:
15 May 2026
Abstract:
Semiconducting metal oxide based gas sensors exhibit great promise for convenient detection of acetone, a biomarker gas in the exhaled breath of type-Ⅰ diabetes patients. However, the detection usually suffers the interference from exhaled moisture. To overcome this challenge, in this work, a novel hierarchical heterojunction structure consisting of SnO2 nanofiber core and Co3O4 nanosheet shell (denoted as SnO2@Co3O4 core-shell composite) was proposed for fabricating acetone sensor with excellent humidity resistance. Compared with SnO2 nanofibers and Co3O4 nanosheets, the SnO2@Co3O4 showed the highest sensing response, with a response value (Rg/Ra) of 11.27-50 ppm acetone at 110 ℃. In addition, the hierarchical SnO2@Co3O4 core-shell structure shows fast response/recovery speed (19/43 s), lower detection limit (125 ppb), excellent selectivity and stability in a humidity environment (relative humidity 30%-90%) with a relative change of only 3%. The enhanced gas sensing performance toward acetone is attributed to the synergistic effect between the two components, the unique core-shell hierarchical structure and the rich oxygen vacancy density. Density functional theory calculations reveal that the SnO2@Co3O4 has higher acetone adsorption energy than the two components. In addition, a novel SnO2@Co3O4 gas sensing module and smart portable sensor device enable efficient real-time monitoring of acetone concentrations on a smartphone via Bluetooth communication.
Acetone, as an important organic raw material and a good solvent, is widely used in industrial and laboratory processes [1]. The symptoms such as dizziness, burning sensation, pharyngitis, bronchitis, fatigue, irritability and even dermatitis will occur after prolonged exposure to acetone [2,3]. More importantly, acetone, a by-product of human fat metabolism, easily enters the lungs through the blood, which could serve as an essential biomarker for the detection of diabetes. Based on clinical studies, the exhaled acetone concentration of patients with type-Ⅰ diabetes is greater than 1.8 ppm, while that of healthy individuals is < 0.9 ppm [4]. Therefore, designing an acetone gas sensor with high humidity resistance, high sensitivity and low detection limit (below 1 ppm) is extremely desirable. However, the traditional gas detection technology is based on large-scale instruments, and the detection is complicated and time-consuming, which hinders its wide applicability [5].
Chemiresistive metal oxide semiconductor (MOS) gas sensors have enabled the development of portable and inexpensive breath acetone detectors due to their inherent low power consumption [6,7]. So far, chemiresistive sensors based on MOS, such as SnO2, In2O3 and WO3, have been widely reported for acetone detection with high sensitivity, fast response/recovery rates, and low detection limits (LOD) [8,9,16]. However, these sensors require high operating temperatures and low humidity resistance, which greatly hinders practical applications. The complexity of human respiratory gases makes selective detection of acetone still a major challenge [10,11]. Low operating temperature, low power consumption and high humidity resistance will become the development trend of gas sensors in the future. Therefore, it is very meaningful to design new materials to improve the gas sensitivity of acetone detection [12].
The construction of hierarchical structures and core-shell heterostructures have been proven to optimize its gas sensing performance [13]. Uniform distribution of secondary nanomaterials can be achieved, thus obtaining greater surface area and synergistic effect in the heterojunction, further improving detection limits, and humidity resistance [14]. For example, Zhang et al. fabricated Mn3O4/Zn2SnO4 heterojunctions with dense branched structures to achieve fast (4 s), high-sensitive (7.3) detection of acetone at 240 ℃, with remarkable stability (only a 5% decrease after 20 days) [15]. The enhanced gas sensitivity can be ascribed to efficient charge transfer and the unique core-shell structure. Our group has previously reported works on core-shell structures, such as In2O3@SnO2, SnO2@SnO2, and SnO2@MoS2 [16-19]. However, due to lattice mismatch, designing and constructing layered core-shell heterogeneous shell materials remains a challenge in sensing material preparation [20].
Ferromagnetic metal oxides are also used as materials to enhance gas sensitivity because of the large dipole of acetone gas and its ability to interact with these materials [21,22]. For example, Co3O4 is a common ferromagnetic metal oxide with a narrow indirect band gap (1.6–2.2 eV) and strong oxygen adsorption capacity. This is mainly due to the ease with which divalent Co2+ ions can be oxidized to higher-valence Co ions [23,24]. Co3O4 is also a promising candidate material for humidity-resistant gas sensing [23-25]. For ferromagnetic Co3O4 nanomaterials, high temperatures can cause agglomeration between nanoparticles, leading to an increase in particle size and a reduction in the specific surface area. The high-temperature agglomeration hinders the development of Co3O4 in the field of gas sensors [26,27]. For Co3O4 nanosheets derived from Co-MOFs, the structure largely inherits the unique properties of the host MOF and typically features adjustable structures, high specific surface area, and rich pore structures [28]. This unique structure allows gas molecules to effectively diffuse and increases the density of surface reaction sites, thereby enhancing the sensor response [29]. Additionally, due to the diversity of MOFs, it is possible to precisely customize the composition of MOF derivatives by pre-modifying or post-modifying MOFs to promote the construction of heterojunctions and Schottky potentials [30,31]. Therefore, it is of great significance to develop core-shell structures with high humidity resistance based on ferromagnetic material properties [32,33].
In this study, a facile and controllable multicomponent method was proposed to prepare novelty 3D SnO2@Co3O4 core-shell nano-heterostructures. Specifically, SnO2@Co3O4 nanostructures were prepared by assembling Co-MOF nanosheets array on SnO2 electrospun nanofibers (NFs) and further heat treatment. The p-n heterojunction is formed between the pure Co3O4 (p-type) and SnO2 (n-type) compositions, which further enrich the active center and gas adsorption space of the material, and promote the reaction rate of the target gas with chemisorbed oxygen ions. SnO2@Co3O4 nanocomposite exhibit a higher response of 11.27@50 ppm acetone, which is 2.31/6.96-fold higher than that of pure Co3O4 NSs and SnO2 NFs, respectively. In addition, SnO2@Co3O4 also shows excellent gas selectivity and stability in a humidity environment (relative humidity 30%−90%) with a relative change of only 3%. Acetone is initially converted to the intermediate CH3CO+ and CH3+, and finally decomposed into CO2 and H2O, which promotes the understanding of the insufficient sensing mechanism of acetone gas sensors. In addition, density functional theory (DFT) calculations confirm that SnO2@Co3O4 exhibits higher acetone adsorption energy than the pure component, thus enhancing the acetone sensing performance.
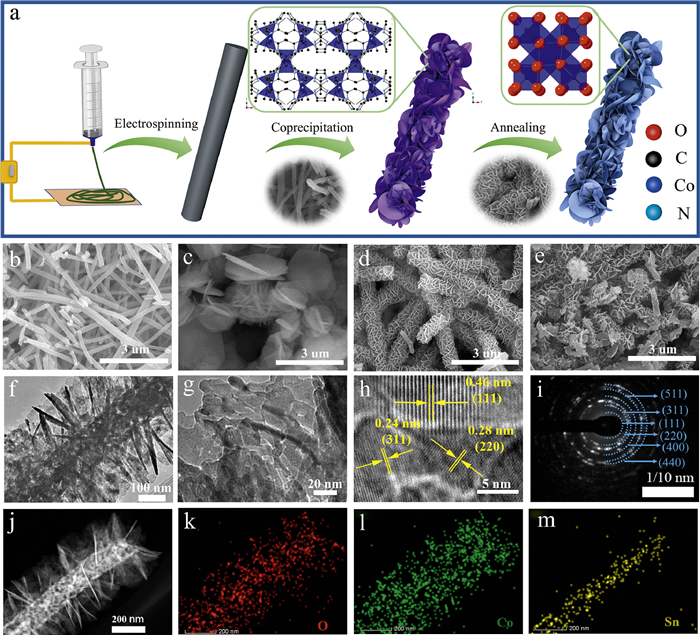
The SnO2@Co3O4 samples were prepared by assembling Co-MOF nanosheets arrays on SnO2 electrospinning nanofibers and further heat treatment (Fig. 1a). Scanning electron microscope (SEM) and low-magnification transmission electron microscope (TEM) characterization reveal that the pure SnO2 NFs displayed a smooth surface and uniform nanofiber shape with a diameter of about 250 ± 10 nm (Fig. 1b). The Co-MOF nanosheets have a certain thickness (200 ± 10 nm) and a tendency to agglomerate (Fig. 1c). The smooth flakes of Co-MOF were uniformly grown on the SnO2 nanofibers with an average thickness of about 50 ± 3 nm (Fig. 1d). For contrast, the sample of SnO2@Co3O4 nanocomposites achieved by calcination became rougher on its surface and thinner in thickness (30 ± 5 nm) due to the evaporation of organic ligands (Fig. 1e). Furthermore, TEM images clearly showed the structure of the SnO2@Co3O4 is a core-shell structure with a core of SnO2 NFs and an outer shell of Co3O4 NSs (Figs. 1f and g). Furthermore, high-resolution TEM (HRTEM) images exhibit clear crystalline lines for SnO2@Co3O4 nanocomposites, suggesting their crystalline nature. It can be clearly observed the lattice fringes with d = 0.46, 0.28, and 0.24 nm from Fig. 1h, which correspond to the (111), (220), and (311) crystal plane of Co3O4, respectively [36], manifesting the formation of cobalt oxide. As the surface of SnO2 NFs is coated with Co3O4 NSs, the lattice spacing of SnO2 cannot be identified. Selected area electron diffraction (SAED) patterns also show (111), (220) and (311) crystal planes, matching XRD and HRTEM (Fig. 1i). The EDX element mapping further reveals the distribution of the three elements (Figs. 1j-m). It is quite clear that O, Co and Sn overlapped each other in space and are homogeneously distributed, further illustrates the formation of SnO2@Co3O4 nanocomposites and provides support for the growth of Co3O4 nanosheets on each SnO2 nanofibers (Figs. 1j-m).
Figure 1
Figure 1.
(a) Fabrication process of the 3D hierarchical core-shell SnO2@Co3O4 nanocomposites. SEM images of (b) SnO2 NFs, (c) Co-MOF NSs, (d) SnO2@Co-MOF, (e) SnO2@Co3O4, (f, g) TEM images of SnO2@Co3O4. (h, i) HR-TEM and SAED image of SnO2@Co3O4, and (j-m) EDX elemental mapping images.
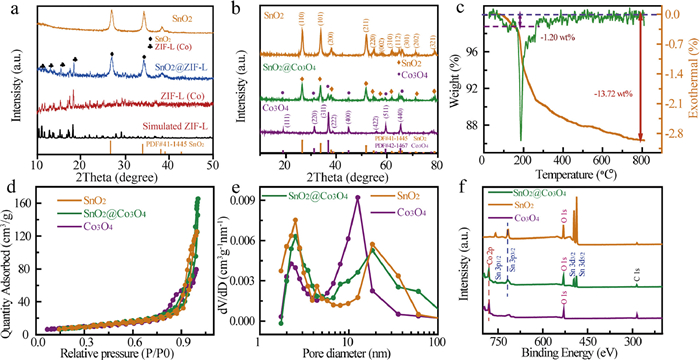
To further reveal their phase composition and crystalline structure of SnO2@Co3O4 samples, X-ray diffraction (XRD) partterns of SnO2@Co3O4 nanocomposites well matched with those standard diffraction peaks of pure SnO2 NFs (JCPDS No. 41–1445) and Co3O4 NSs (JCPDS No 42–1467) (Figs. 2a and b) [16,34]. No other peaks were observed, which indicated the formation of the high purity the SnO2@Co3O4 nanocomposites. The TG-DSC curve of SnO2@Co-MOF obviously showed the major mass change of the sample at high temperature in two stages (Fig. 2c): The first stage occured below 150 ℃ (weight loss of about 1.20 wt%) corresponding to the desorption of the adsorbed water [35]. The second stage significant weight loss of Co-MOF took place at 200 ℃ and the weight loss of Co-MOF was 11.52 wt% up to 800 ℃. The organic ligand was evaporated and Co-MOF was oxidized to Co3O4 until complete oxidation [36]. To demonstrate the structural effects of the SnO2@Co3O4 nanocomposites, the Brunauer–Emmett–Teller (BET) and Barrett–Joyner–Halenda (BJH) methods were used to investigate the specific surface area and pore distribution from the nitrogen adsorption-desorption measurement [37]. As shown in Fig. 2d, the isotherm curves of SnO2 NFs, SnO2@Co3O4 nanocomposite and Co3O4 NSs located in the relative pressure (P/P0) range of 0.88–1, 0.6–1 and 0.65–1 for the three materials resembling a typical H3-type hysteresis loops, respectively, which indicated the presence of mesoporous. The SnO2@Co3O4 nanocomposite achieved the largest specific surface area of 35.29 m2/g, which is higher than that of pure Co3O4 NSs (28.75 m2/g) and SnO2 NFs (29.98 m2/g), respectively (Table S1 in Supporting information), indicating that the heterojunction can improve the specific surface area. Based on the BJH method, the two pore size distribution were centered at around 2 nm and 15 nm (Fig. 2e). An appropriate pore size also facilitates the diffusion of the gas, leading to an appreciation of the gas sensitivity of the material.
Figure 2
Figure 2.
(a) XRD patterns of the SnO2 NF, ZIF-L, and SnO2 NF@ZIF-L. (b) XRD patterns of SnO2, SnO2@Co3O4, and Co3O4. (c) TG-DSC of SnO2@Co-MOF. (d, e) Nitrogen gas adsorption-desorption isotherms and BJH pore size distribution of the SnO2, SnO2@Co3O4 and Co3O4. (f) XPS survey spectrum of SnO2, SnO2@Co3O4, and Co3O4, respectively.
The compositions and surface chemical states of these sensitive materials were characterized by X-ray photoelectron spectra (XPS). The XPS spectrum validates the coexistence and the surface electronic state of Co, Sn, O and C elements for pure SnO2 NFs, pure Co3O4 NSs, and SnO2@Co3O4 nanocomposites. As shown in Fig. 2f, the full spectrums of three samples indicate the formation of SnO2, Co3O4 and SnO2@Co3O4 nanocomposites, which is consistent with the results of EDX, XRD and HRTEM characterizations. Notably, no other impurity peaks were found except for the carbon peak, which was attributed to carbon-based contaminants [22,37]. Fig. S2a (Supporting information) shows the Sn 3d spectrum of SnO2@Co3O4 have two characteristic XPS peaks at 495.5 eV and 487.0 eV, which were belonged to Sn 3d3/2 (495.5 eV) and Sn 3d5/2 (487.0 eV) of SnO2@Co3O4, respectively [16]. The binding energy difference between the characteristic peaks of Sn 3d3/2 and Sn 3d5/2 is 8.50 eV. The above result is also consistent with the standard data in the earlier report for Sn4+ in SnO2, indicating that the Sn4+ of the SnO2@Co3O4 nanocomposites is in a fully oxidized state. As shown in Fig. S2b (Supporting information), the Co 2p peaks of Co3O4 NSs and SnO2@Co3O4 nanomaterials, and both the Co 2p3/2 and Co 2p1/2 can be divided into two peaks of Co3+ and Co2+. Two characteristic SnO2@Co3O4 peaks of Co 2p3/2 are located in 779.4 eV (Co3+) and 780.5 eV (Co2+), respectively (Fig. S2b) [38,33]. The slight shift of 0.2 eV and 0.1 eV in the binding energy of SnO2@Co3O4 nanomaterials was attributed to the availability of electronic interactions between SnO2 and Co3O4 in the nanocomposites [25,37], compared with SnO2 and Co3O4, respectively.
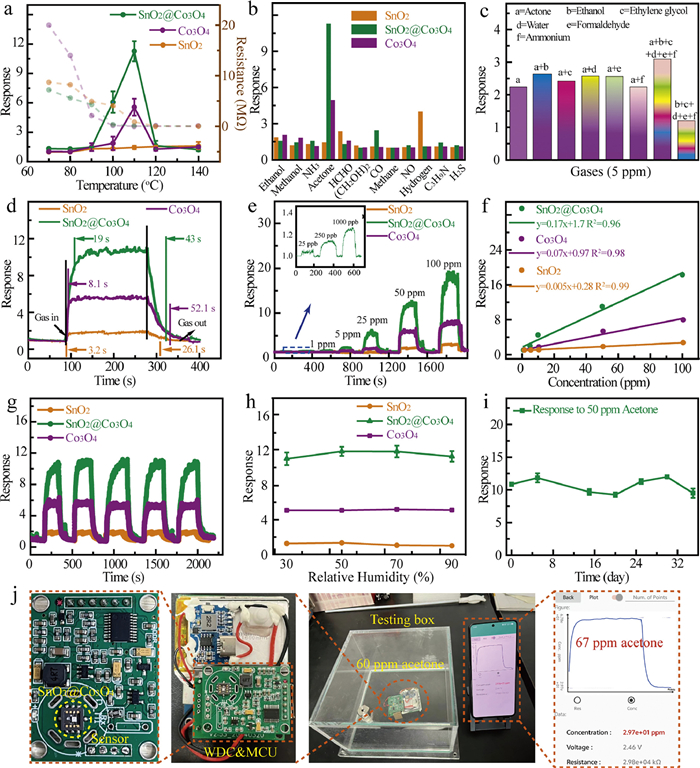
The SnO2@Co3O4 materials are promising sensing materials for chemoresistive gas sensors due to their high specific surface area and unique core-shell hierarchical structure. The working temperature of the gas sensor has an important effect on the adsorbed oxygen and the resistance of its surface, which is closely related to the sensing behavior of the sensor. In particular, it is caused by the competition between the growth of the surface reaction rate and the drop in the number of active sites when gas molecules get adsorbed at high temperatures. Three sensors based on as obtaied samples (Co3O4, SnO2 and SnO2@Co3O4) were tested under the temperature ranges of 70–140 ℃. Fig. 3a shows that the response gradually increases with temperature, but the response of gas sensor decreases when the temperature exceeds 110 ℃. At low temperatures, acetone molecules do not gain enough energy to overcome the activation energy barrier and thus react with oxygen adsorbed on the surface of the sensitive material. When the optimal operating temperature is reached, the adsorption and desorption of acetone molecules on the material surface reach equilibrium, and the reaction rate reaches a maximum value. By contrast, if the temperature is too high, the desorption process of acetone molecules may dominate the reaction, resulting in a reduced gas-sensitive response [39,40]. The SnO2@Co3O4 nanocomposite exhibited the maximum response values of 11.27-50 ppm acetone, which is 2.31/6.96-fold than the response of pure Co3O4 NSs (4.88) and SnO2 NFs (1.62), respectively. This is due to the increase of oxygen vacancy on the surface of the core-shell structure, which is conducive to the adsorption of acetone. Besides, the sensing behavior of SnO2@Co3O4 nanocomposite to the potential interfering gases was studied, including ethanol, formaldehyde, methanol, ammonia, hydrogen, hydrogen sulfide, nitric oxide and carbon monoxide. As shown in Fig. 3b, the SnO2@Co3O4 nanocomposites exhibited great selectivity to acetone, and the higher acetone response (11.27), which was about 5/19-fold higher than that of C2H5OH and H2O, respectively. In addition, to simulate the sensor’s tolerance to interferences in real exhaled breath, the gas sensors also were measured in a mixture atmospheres. The response of the sensors in the atmosphere mixed with a variety of interfering gases was not significantly different from that in the atmosphere only containing acetone (Fig. 3c). From the test results, SnO2@Co3O4-based acetone sensor can effectively endure the impact of interference gases in human exhaled air. The above sensor materials are expected to be helpful for the selective detection of acetone in human exhaled air.
Figure 3
Figure 3.
(a) Response of SnO2, SnO2@Co3O4, and Co3O4 toward 50 ppm of acetone at operation temperature ranging from 70 ℃ to 140 ℃, the gas response unit of SnO2 NFs is Ra/Rg and the gas response unit of SnO2@Co3O4, and Co3O4 NSs is Rg/Ra. (b) The selectivity (50 ppm of ethanol, methanol, NH3, acetone, HCHO, (CH2OH)2, CO, methane, NO, hydrogen, C3H9 N and H2S), (c) The gas responses of 3D hierarchical SnO2@Co3O4 core-shell nanofiber to mixture vapors at 110 ℃. (d) Response/recovery time and dynamic resistance curves to 50 ppm acetone. (e) Dynamic response variation curves of the sensors based on SnO2, SnO2@Co3O4, and Co3O4 when exposed to acetone with increasing concentration at 110 ℃. (f) The relationship of these gas sensors toward different acetone gas concentration (0.125–100 ppm) at 110 ℃. (g) The reproducibility of SnO2, SnO2@Co3O4, and Co3O4 toward 50 ppm of acetone at 110 ℃. (h) Response of three materials to 50 ppm acetone at different humidity at 25 ℃. (i) The long-term stability of SnO2@Co3O4 sensitive materials. (j) Optical photograph of smart lab-made wireless sensor connected to the smartphone via Bluetooth, and the dynamic concentration curve to 60 ppm acetone.
Importantly, SnO2@Co3O4 nanocomposites sensor has a short response/recovery time of about 19 s/43 s (Fig. 3d). The large specific surface area and pore structure of the SnO2@Co3O4 nanocomposite are beneficial to the transportation of gas [17,19,37]. Fig. 3e depicts the dynamic response curves of the acetone sensors with increaseing concentration of acetone from 100 ppb to 100 ppm. All the response of the sensors displayed a steady-step growth with the trend of increasing acetone concentration. More importantly, the SnO2@Co3O4-based sensor could achieve remarkably improved response to acetone, even more evident at high concentrations. As shown in the inset of Fig. 3e, the limit of detection (LOD) of SnO2@Co3O4 based sensor was 1.05–125 ppb of acetone. In addition, it can be seen from Fig. 3f that all samples showed good linear relationships in the range of acetone concentration from 0.125 ppm to 100 ppm for Co3O4, SnO2@Co3O4 and SnO2. To compare the acetone sensor performance, acetone sensors based on similar sensor materials are listed in Table S2 (Supporting information). The SnO2@Co3O4 nanomaterials based sensor shows a lower operating temperature, lower detection limit, and higher response in comparison to other sensors. Stability toward acetone gas sensing was also an important index of gas sensing for practical application. The response of the sensor to 50 ppm acetone fluctuates slightly around 11 during the dynamic 5 cycles test, indicating reliable repeatability (Fig. 3g). Furthermore, the response value was almost unchanged when the relative humidity was varied from 30% to 90% (Fig. 3h). The response of SnO2@Co3O4 to acetone at different concentrations and humidity, and the three sensor materials showed little change in response to acetone, indicating that the sensor has good humidity resistance with a net loss of only 3% [41]. For the long-term stability measurement, the three sensors were monitored for response to 50 ppm acetone weekly for a month (Fig. 3i). Obviously, the response values of the sensors displayed no apparent wave after 30 days, which demonstrated good long-term stability and built the solid foundation for practical application and commercial promotion. Inspired by the excellent comprehensive gas-sensing properties of SnO2@Co3O4 material, we designed a low-power intelligent wireless gas-sensing module, which is connected to the mobile phone through Bluetooth to realize fast sensing response and real-time reading of acetone concentration (Fig. 3j). When the module detector is placed in a transparent box with a simulated ambient acetone concentration of 60 ppm, the device can quickly read out a concentration of about 67 ppm on the phone, which is very close to the actual concentration. Thus, it paves the way for the manufacture of high-performance intelligent gas sensors through the hierarchical heterojunction structure strategy.
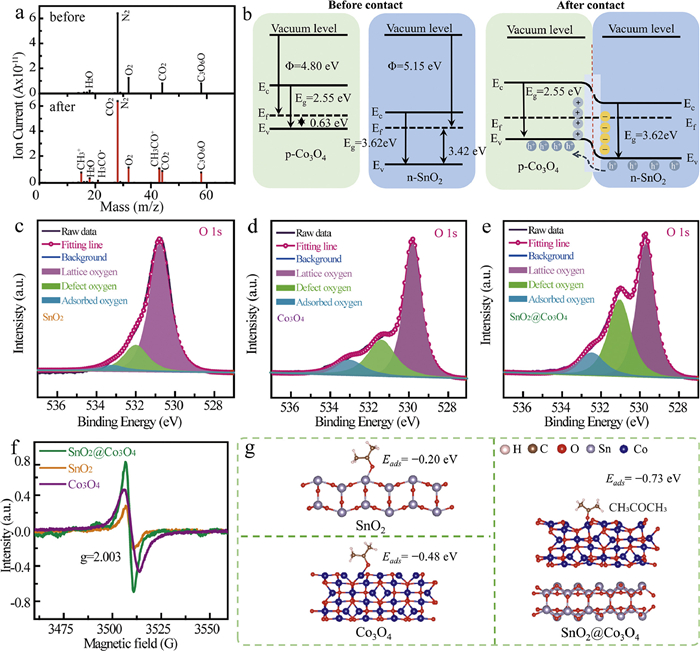
The resistance changes of MOS materials in gas sensing process depend on chemical adsorption of oxygen on its surface and the interaction of oxygen species with the target gas. Oxygen molecules are also attached to the oxygen vacancies of the sensitive materials trapping electrons to create different oxygen species when the sensing coating comes in contact with air [42,43]. This process leads to the formation of a hole accumulation layer and the reduction of resistance for p-type materials. The oxygen species is closely related to the operating temperature of the gas sensor, all the gas sensing experiments were carried out at 110 ℃, so the adsorbed oxygen on the sensor material surface existed in the form of O‒. Since electrons in the sensor material are captured by oxygen, the concentration of holes in Co3O4 expands with a decreased resistance. When the SnO2@Co3O4 nanocomposite gets exposed to acetone as a sensing coating, the acetone molecules will adhere and activate with O- on the surface of the sensitive material ((1), (2), (3)). The formation of adsorbed oxygen on the surface of SnO2@Co3O4 nanocomposite (p-type MOS) leads to an increase in the hole aggregation layer due to the binding of electrons, and when the SnO2@Co3O4 is exposed to acetone the release of electrons causes the compounding of holes and thus leads to an increase in resistance (Fig. S3 in Supporting information). To further confirm the sensing mechanism, Time-resolved in situ Fourier transform infrared (in situ FTIR) spectroscopy and On-line mass spectrometry were adopted to analyze the products of the surface catalysis reaction. As shown in Fig. S5 (Supporting information), two signal peaks from 1725 cm-1 to 1705 cm-1 (middle) and 1325 cm-1 to 1215 cm-1 (strong) are attributed to the C=O ketone carbonyl group, which is a saturated ketone. The two signal peaks at 3000–2850 cm-1 and 1465–1340 cm-1 belong to C-H stretching vibration and bending vibration, respectively [44]. It is further proved that the acetone is gradually decomposed, and the content of C=O and C-H on acetone is gradually reduced. The signal peaks at 769–659 cm-1 are attributed to the O-H out-of-plane bending vibration of the alcohol. The O-H stretching vibrations at 3400 cm-1 are attributed to H2O and the signal peaks at 3500–3800 cm-1 are attributed to the -OH bond of H2O. Similarly, the stretching vibration absorption peak at 2349 cm-1 is CO2 gas [45]. It is further proved that the content of -OH, O-H and CO2 increases after acetone decomposition, which proves that H2O and CO2 are formed. Similarly, the collected gas products were analyzed by online-MS. As shown in Fig. S4 (Supporting information) and Fig. 4a, compared with the blank sample, after the sensor material was in contact with acetone vapor, the content of intermediate CH3C+O and C+H3 increased significantly (Eqs. 4–6), while the content of O2 molecule decreased slightly. In this sense, the gaseous products may produce CO2 and H2O after deep oxidation (Eq. 7). Hence, the reaction process is generated intermediate CH3CO+, CH3+. The final products of the reaction are CO2 and H2O. The above process is presented in the following chemical reaction equation [31,32].
O2(g)→O2(ads)
(1)
O2(ads)+e−→O2−(ads)
(2)
O2−(ads)+e−→2O−(ads)
(3)
C3H6O(g)+O−(ads)→CH3CO++CH3O−+e−
(4)
CH3CO+→CH3++CO(g)
(5)
CO(g)+O−(ads)→CO2(g)+e−
(6)
C3H6O+8O−(ads)→3CO2(g)+3H2O(g)+8e−
(7)
Figure 4
Figure 4.
(a) On-line MS spectra of SnO2@Co3O4 before and after contacting with acetone vapor at 110 ℃. (b) the energy band structure diagram of Co3O4 and SnO2 before and after contact. (c-e) O 1s XPS spectra of SnO2, Co3O4, and SnO2@Co3O4, respectively. (f) ESR spectra of SnO2, SnO2@Co3O4 and Co3O4, respectively. (g) The geometric binding configuration model of SnO2, Co3O4 and SnO2@Co3O4 combined with acetone molecules.
Compared with pure Co3O4 NSs and SnO2 NFs, the improved acetone sensitive performance of 3D hierarchical SnO2@Co3O4 can be ascribed to the following reasons: (1) The formation of p-n heterojunctions between Co3O4 NSs (p-type) and SnO2 NFs (n-type) can effectively improve the gas sensing properties. The UPS analysis was carried out to investigate the electron transfer behavior between Co3O4 and SnO2. As illustrated in Fig. S7 (Supporting information), the cutoff energy and HOMO energy of SnO2 NFs were 16.07 and 3.42 eV, respectively. In addition, that of Co3O4 NSs were 16.42 and 0.63 eV. Thus, the work function of the Co3O4 and SnO2 were 4.80 and 5.15 eV, respectively (Fig. 4b) [46]. The band gaps of SnO2 and Co3O4 were obtained by UV–vis spectroscopy (Fig. S6 in Supporting information) were 3.62 and 2.55 eV, respectively [47,48]. The electrons in SnO2 NFs would transfer to Co3O4 NSs, while the holes are migrated in the opposite direction when they establish contact, thus forming a depletion layer at the contact [49]. The presence of p-n heterojunction is expected to assist in achieving higher hole-electron separation at the interface, allowing electrons to be more easily trapped by the adsorbed oxygen [50,51]. (2) In the test process of gas sensor, the adsorption and reaction of target gas and oxygen are carried out on the material surface, so the specific surface area has a great influence on the gas sensing performance of the material [45]. It can be proven from Table S1 (Supporting information) and Fig. 2 that the specific surface area of the SnO2@Co3O4 is the largest in comparison to two components, and that means the amount of adsorbed oxygen would be increased along with the active sites, which is beneficial to enhance the response of target gas with adsorbed oxygen ions. Meanwhile, the three-dimensional hierarchical structure is formed by the ordered arrangement of Co3O4 nanosheets on the nanofibers (Fig. 1f), which effectively avoids the agglomeration between the Co3O4 nanosheets and facilitates the diffusion and transport of the target gas [16,17]. (Ⅲ) O2-TPD was further carried out to study the chemical adsorption oxygen on the sensitive material (Fig. S8 in Supporting information). The desorption spectrum can be divided into three regions. α-O corresponds to oxygen adsorbed on the sample surface and can be obtained at relatively low temperatures (below 400 ℃). β-O can be attributed to surface lattice oxygen with a temperature range from 400 ℃ to 600 ℃. γ-O can be attributed to deep lattice oxygen at temperatures higher than 600 ℃ [52]. The peaks at 219, 211, and 185 ℃ could be attributed to the desorption of loosely bounded surface oxygen such as the adsorption on the surface of SnO2@Co3O4, Co3O4 and SnO2, respectively [53]. The peak intensity and peak area of the SnO2@Co3O4 nanocomposite are higher than those of pure Co3O4 NSs and SnO2 NFs. The peaks at 398, 313, and 360 ℃ would be attributed to surface lattice oxygen [54]. As shown in Figs. 4c-e, three characteristic peaks represent the O 1s peaks of pure SnO2 NFs, pure Co3O4 NSs and SnO2@Co3O4, respectively, and each characteristic peak can be coherently fitted to three corresponding peaks including adsorbed oxygen (Oads), lattice oxygen (Olat) and defect oxygen (Odef). The Olat peak at 529.7 ± 1.1 eV (O 1s) represents the O2‒ ion of the lattice in the three samples, and the Odef peak at 531.1 ± 0.9 eV represents the O2‒ ion in the anoxic region of the matrix [18,52]. While the Oads peak at 532.5 ± 0.7 eV could be associated with the chemisorbed oxygen species (O2, H2O and CO2) on the surface of the three samples [55,56]. In particular, the percentage of Oads for SnO2@Co3O4 (12.49%) was the highest value in comparison to the percentage of Oads for pure SnO2 NFs and pure Co3O4 NSs were 5.58% and 11.70%, respectively (Table S3 in Supporting information). In addition, the ESR spectra of the different samples were demonstrated in Fig. 4f. It was evident that the ESR intensity of the SnO2@Co3O4 core-shell structure was the highest among the three samples, and the relative oxygen vacancy concentration of the nanocomposite is also the highest. Therefore, SnO2@Co3O4 core-shell structure can provide additional Oads and Odef, which is conducive to the reaction of the target gas with oxygen, as well as increasing the active site on the surface, which is conducive to the acetone sensing performance. The density functional theory (DFT) calculations were carried out on the adsorption of one acetone molecule on SnO2@Co3O4, SnO2, and Co3O4. The effect of material on gas adsorption energy (ΔEads) was further demonstrated. Fig. 4g shows the optimal structure of one acetone molecule adsorbed on the surface of SnO2@Co3O4, SnO2, and Co3O4. The results of DFT calculation show that the maximum adsorption energy of SnO2@Co3O4 for acetone (ΔEads = −0.73 V) is much higher than that of pure SnO2 (−0.20 eV) and Co3O4 (−0.48 eV). Therefore, it is further proved that the enhancement of acetone sensing performance can be attributed to heterostructure construction.
In summary, the SnO2@Co3O4 core-shell heterostructures were prepared via the assembly of Co-MOF nanosheets arrays on SnO2 nanofibers followed by further heat treatment. SnO2@Co3O4 nanocomposite provide p-n heterojunction, and the unique core-shell hierarchical structure with significantly enhanced oxygen vacancy (Ov), and as a result, the obtained SnO2@Co3O4 materials exhibited a high specific surface area (35.29 m2/g), and outstanding gas sensing performance to acetone with high selectivity, higher sensitivity, higher response, lower detection limit (125 ppb) and good long-term stability under a relatively low work temperature (110 ℃). In addition, due to the existence of unique core-shell hierarchical structure, the obtained sensor materials showed excellent humidity resistance even under high humidity conditions (30%−90%) with a net loss of only 3%. DFT calculations show the SnO2@Co3O4 has higher acetone adsorption energy than the two components. Therefore, the exploration of this work opens up the possibility to economically produce various functional hierarchical heterojunction structure with specific compositions for diverse applications, and has a wide range of applications in chemical sensing, heterogeneous catalysis, energy conversion, and storage.
Declaration of competing interest
The authors declare that they have no known competing financial interests or personal relationships that could have appeared to influence the work reported in this paper.
The authors greatly appreciate the financial support from National Natural Science Foundation of China (Nos. 62471303, 62071300, 22176127, 22125501, U22A20152, 22301181, 22406130), Shanghai Sailing Program (Nos. 23YF1429000, 22YF1430400), the Science and Technology Commission of Shanghai Municipality (No. 2024ZDSYS02). We also acknowledge the USST Center for Instrumental Analysis for their support in materials characterization.
Supplementary materials
Supplementary material associated with this article can be found, in the online version, at doi:10.1016/j.cclet.2025.110863.
[1]
L. Zhao, C. Yu, C. Xin, et al., Adv. Funct. Mater. 34 (2024) 2314174. doi: 10.1002/adfm.202314174
[2]
Z. Liu, H. Lv, S. Li, et al., J. Mater. Chem. A 12 (2024) 6318–6328. doi: 10.1039/d4ta00080c
Figure 1
(a) Fabrication process of the 3D hierarchical core-shell SnO2@Co3O4 nanocomposites. SEM images of (b) SnO2 NFs, (c) Co-MOF NSs, (d) SnO2@Co-MOF, (e) SnO2@Co3O4, (f, g) TEM images of SnO2@Co3O4. (h, i) HR-TEM and SAED image of SnO2@Co3O4, and (j-m) EDX elemental mapping images.
Figure 2
(a) XRD patterns of the SnO2 NF, ZIF-L, and SnO2 NF@ZIF-L. (b) XRD patterns of SnO2, SnO2@Co3O4, and Co3O4. (c) TG-DSC of SnO2@Co-MOF. (d, e) Nitrogen gas adsorption-desorption isotherms and BJH pore size distribution of the SnO2, SnO2@Co3O4 and Co3O4. (f) XPS survey spectrum of SnO2, SnO2@Co3O4, and Co3O4, respectively.
Figure 3
(a) Response of SnO2, SnO2@Co3O4, and Co3O4 toward 50 ppm of acetone at operation temperature ranging from 70 ℃ to 140 ℃, the gas response unit of SnO2 NFs is Ra/Rg and the gas response unit of SnO2@Co3O4, and Co3O4 NSs is Rg/Ra. (b) The selectivity (50 ppm of ethanol, methanol, NH3, acetone, HCHO, (CH2OH)2, CO, methane, NO, hydrogen, C3H9 N and H2S), (c) The gas responses of 3D hierarchical SnO2@Co3O4 core-shell nanofiber to mixture vapors at 110 ℃. (d) Response/recovery time and dynamic resistance curves to 50 ppm acetone. (e) Dynamic response variation curves of the sensors based on SnO2, SnO2@Co3O4, and Co3O4 when exposed to acetone with increasing concentration at 110 ℃. (f) The relationship of these gas sensors toward different acetone gas concentration (0.125–100 ppm) at 110 ℃. (g) The reproducibility of SnO2, SnO2@Co3O4, and Co3O4 toward 50 ppm of acetone at 110 ℃. (h) Response of three materials to 50 ppm acetone at different humidity at 25 ℃. (i) The long-term stability of SnO2@Co3O4 sensitive materials. (j) Optical photograph of smart lab-made wireless sensor connected to the smartphone via Bluetooth, and the dynamic concentration curve to 60 ppm acetone.
Figure 4
(a) On-line MS spectra of SnO2@Co3O4 before and after contacting with acetone vapor at 110 ℃. (b) the energy band structure diagram of Co3O4 and SnO2 before and after contact. (c-e) O 1s XPS spectra of SnO2, Co3O4, and SnO2@Co3O4, respectively. (f) ESR spectra of SnO2, SnO2@Co3O4 and Co3O4, respectively. (g) The geometric binding configuration model of SnO2, Co3O4 and SnO2@Co3O4 combined with acetone molecules.

 DownLoad:

 下载:
下载:


 下载:
下载:
