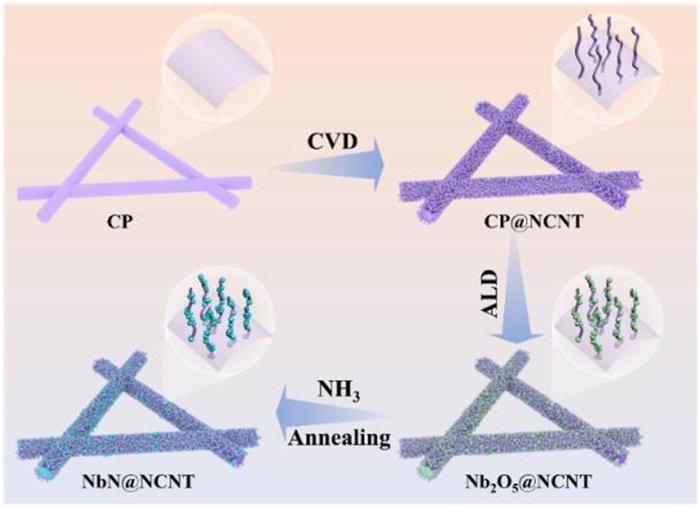
Figure 1.
Schematic illustration of NbN@NCNT host preparation.
NbN as cathode catalysis for lithium-sulfur batteries: Unlocking sulfur conversion kinetics
Rongjin Lin , Shuiping Cai , Chen Cheng , Changyong Zhao , Yingkang Tian , Xiaofei Yang , Xuejie Gao , Runcang Sun

Due to their low cost, exceptional theoretical energy density of 2600 Wh/kg, and environmental-friendly characteristic, LSBs have gained significant attention as a next-generation energy storage technology [1-4]. Nevertheless, LSBs also face several challenges that currently limit their practical applications. Challenges such as the poor sulfur conductivity, the volume expansion of sulfur and the shuttle effect of lithium polysulfides (Li2Sx, 4 ≤ x ≤ 8, LiPSs) remain significant barriers [5,6]. A variety of strategies have been proposed to overcome these challenges [7-9]. For example, Liu et al. [10] developed monodisperse molybdenum (Mo) nano-particles introduced in nitrogen-doped graphene (Mo@NG) and used them as efficient electrocatalysts to enhance the conversion of LiPSs. LSBs based on Mo@NG/S cathode had remarkable rate performance, high capacity and exceptional cycling stability. Among the strategies proposed, introducing materials with both catalytic and absorptive properties for the cathode have been considered an effective approach to enhance the utilization of sulfur and facilitate the reversible conversion between LiPSs and Li2S [11,12]. Carbon materials doped with non-metals (N, O, P, S, etc.) have been shown to significantly improve the anchoring and catalytic sites for LiPSs, thereby enhancing both the catalytic activity and absorption capacity of carbon materials [13,14]. Unfortunately, carbon materials doped solely with non-metal elements are still insufficient to stabilize the capacity of LSBs. To further enhance the performance of LSBs, introducing nano-catalysts or doping with metal elements into carbon materials, has proven effective in promoting the conversion between LiPSs and Li2S [15].
Recently, a number of polar metal-based compounds, including metal nitrides [16], metal oxides [17], and metal chalcogenides [18], have been incorporated into sulfur-based composite materials to catalyze the conversion of LiPSs through strong chemical interactions. Among metal-based compounds, metal oxides act as efficient catalysts to enhance sulfur utilization and facilitate redox reactions [19,20]. For example, Tian et al. [21] designed high-entropy oxide (HEO) nanofibers as a bi-directional catalytic platform for sulfur, which facilitated the re-oxidation of insoluble products and the reduction of soluble intermediates, and thereby enhancing cyclic stability. Unfortunately, the weak electrical conductivity of metal oxides hindered efficient electron transfer. In recent years, metal nitrides have attracted particular research interest due to their metallic properties, beneficial for reducing additional interface resistance and promoting rapid ion/electron transfer at the electrodes [22]. Metal nitrides exhibit strong adsorption capacity for LiPSs and high electrical conductivity. More importantly, they play a crucial role in enhancing the catalytic transformation of polysulfides by modulating the interaction between the metal d-orbital and the sulfur 3p-orbital [23]. Therefore, to enhance the performance of LSBs, it is essential to incorporate catalysts into the battery to suppress the shuttle effect and improve the kinetics of catalytic conversion. Shi et al. [24] found that NbN exhibits good electrical conductivity and excellent catalytic properties, which can promote the conversion of LiPSs, inhibit the shuttle effect, and enhance the performance of LSBs.
Herein, NbN embedded in nitrogen-doped carbon nanotubes (NbN@NCNT) was successfully synthesized as a sulfur host using a two-step atomic layer deposition (ALD) and NH3 annealing method. Firstly, Nb2O5 was loaded into nitrogen-doped carbon nanotubes (NCNT) via ALD (resulting in Nb2O5@NCNT), and then it was reduced to NbN through NH3 annealing method. Nb2O5@NCNT was used as a comparison sample. The catalytic-absorption synergistic effect of NbN and NCNT has been shown to enhance the conversion kinetics of liquid LiPSs to solid Li2S in S/NbN@NCNT electrodes, while simultaneously mitigating the shuttle effect. To demonstrate the function of NbN, XPS tests were performed on the cathodes with different voltage platforms. The results revealed that NbN exhibited excellent catalytic activity, which enhanced the conversion kinetics of LiPSs to Li2S on the S/NbN@NCNT, thereby inhibiting the shuttle effect. Consequently, the batteries assembled with S/NbN@NCNT showed higher sulfur utilization and better cycling stability. In particular, S/NbN@NCNT electrode delivered a higher initial specific discharge capacity of 1400.90 mAh/g at current density (2 mA/cm2). Even after 100 cycles, it still maintained a capacity of 1001.02 mAh/g. This work offered a rational design approach to enhance the cycling stability LSBs under high current density through catalytic adsorption, thereby promoting the application of high current density LSBs.
Materials: Nitrogen-doped carbon nanotubes (NCNT), niobium pentaoxide (Nb2O5), niobium nitride (NbN), N-methyl pyrrolidone (NMP) and lithium ditrifluoromethane sulfonylamide (LiTFSI) were purchased from Shanghai Aladdin Biochemical Technology Co., Carbon paper (CP) was purchased from Mycro Technologies Ltd. Polyvinylidene difluoride (PVDF), acetylene black and 1,3-dioxolane: 1,2-dimethoxyethane (DOL: DME, v: v = 1:1) were purchased Guangdong Canrd New Energy Technology Co., Sulfur was purchased from Sigma-Aldrich (Shanghai) Trading Co., Ltd. All reagents were used directly without undergoing any additional purification steps.
Synthesis of CP@NCNT: In accordance with previous studies [25,26], nitrogen-doped carbon nanotubes were synthesized on carbon paper (designated as CP@NCNT) via surface plasmon-assisted chemical vapor deposition (CVD). First, atomic layer deposition (ALD) was performed on CP using a Gemstar-8 ALD system (Arradiance, USA). In this process, Al2O3 was deposited on CP at 120 ℃ utilizing water and trimethylaluminum as precursors over 200 deposition cycles. Subsequently, the 2 × 8 cm2 of Al2O3-coated CP was placed to a vertical tube furnace, where the temperature was gradually increased from ambient temperature to 865 ℃ under an Ar gas flow at 200 mL/min. Next, a ferrocene catalyst solution (0.02 g/mL in acetonitrile) was injected into the quartz tube under an Ar atmosphere with the flow rate of 0.1 mL/min for 5 min. Subsequently, a 0.2 g/mL imidazole solution (solvent: acetonitrile) was introduced to the quartz tube at the minimal flow rate (0.1 mL/min), allowing the CP@NCNT bundles to grow for 30 min. After this, the system was cooled to room temperature. Typically, after 30 min, the length of the grown NCNT bundles ranged from 20 nm to 40 nm.
Synthesis of Nb2O5@NCNT: Ultrathin Nb2O5 films were directly deposited onto the CP@NCNT surface using ALD. Nb(OEt)5 and deionized water were employed as the sources of niobium and oxygen, respectively, to prepare Nb2O5@NCNT composite materials [27]. Before the ALD process, CP@NCNT was oxidized with concentrated nitric acid and deposited onto a silicon wafer to serve as the substrate. The ALD system (MNT Micro and Nanotech Co., Ltd.) was operated under low base pressure, maintained at 0.4 Torr, using a vacuum pump. Nitrogen gas flowing at 50 sccm was used as both the carrier and purge gas. Nb(OEt)5 was maintained at 160 ℃, while H2O was stored at ambient temperature. The ALD program was configured as follows: (1) A 1-s pulse of Nb(OEt)5; (2) a 40-s exposure of Nb(OEt)5 to CP@NCNT; (3) a 60-s purge to remove excess Nb(OEt)5 and byproducts; (4) a 4-s pulse of water vapor; (5) a 40-s exposure of H2O to CP@NCNT; and (6) a 60-s purge to eliminate residual H2O and byproducts. This six-step sequence constituted one ALD-Nb2O5 cycle. The process was repeated 60 times to achieve a uniform, continuous Nb2O5 film on the CP@NCNT surface.
Synthesis of NbN@NCNT: Following the ALD process, Nb2O5@NCNT was converted into NbN@NCNT through a condensation reaction in an NH3 atmosphere. The Nb2O5@NCNT sample was placed in a reaction vessel, and ammonia gas was introduced to create an ammonia-rich environment. The vessel was then heated to 700 ℃, where Nb2O5 reacted with NH3 at high temperature, producing NbN and water as a byproduct. Upon completion of the reaction, the product was allowed to condense for 15 min, resulting in the information of NbN@NCNT.
Sulfurization of cathode host: First, 100 mg of sulfur was dissolved in 5 mL of carbon disulfide (CS2) solvent. Subsequently, 117 µL of the above solvent was adsorbed on the prepared electrodes (with a surface area of 0.785 cm2). After the solvent was evaporated, the electrodes with sulfur loading of 3 mg/cm2 were obtained.
Electrochemical measurements: The electrochemical performance of the S/Nb2O5@NCNT and S/NbN@NCNT electrodes was evaluated using CR2032 coin cells, which were assembled in an Ar-filled glove box. Lithium metal served as anode, with the polypropylene membrane (Celgard 2500) placed between the anode and cathode to as the separator. The electrolyte was prepared by dissolving 1 mol/L lithium bis(trifluoromethylsulfonyl) imide (LiTFSI) in a 1:1 (v/v) mixture of DME and DOL, with 1 wt% LiNO3 added as an additive. The electrolyte-to-sulfur (E/S) ratio was kept at approximately 16 µL/mg for the cathodes, which contained a sulfur loading of 3 mg/cm2. Electrochemical impedance spectroscopy (EIS) was performed under open-circuit conditions with a frequency range spanning from 1.0 × 10⁵ Hz to 1.0 × 10⁻² Hz, using an Electrochemical Workstation. Cycling performance (CV) was tested using a versatile multichannel potentiostat VMP3 at a scan rate of 0.1 mV/s, within a voltage range of 1.7–2.8 V. Charge-discharge tests were performed at ambient temperature using the LAND CT-2001A and LAND CT-3001A systems, within the same voltage window. Unless stated otherwise, all capacities mentioned in this study were calculated with the sulfur mass and referenced to the voltage vs. Li+/Li.
Materials characterizations: The morphology and structure of the samples were analyzed using a Hitachi S-4800 field emission scanning electron microscope (FE-SEM) and a Hitachi HT7700 transmission electron microscope (TEM). The crystal structure was investigated on an X-ray diffractometer (XRD, D8 Advance). Thermogravimetric analysis (TGA) was performed in an Ar atmosphere to evaluate the thermal stability and sulfur content. The surface chemical composition was characterized using X-ray photoelectron spectroscopy (XPS) on an Escalab 250Xi spectrometer. Additionally, ultraviolet-visible (UV–vis) absorption spectra were recorded with a Cary 60 spectrophotometer.
Li2S nucleation measurements: To investigate the nucleation capability of Li2S on various electrode materials, the deposition capacity of Li2S was analyzed using standard CR2032 coin cells. To prepare a 0.5 mol/L Li2S8 solution, sulfur and Li2S were first mixed in a molar ratio of 7:1 and then dissolved in a mixture of DME and DOL (1:1, v/v) with 1.0 mol/L LiTFSI. Subsequently, 25 µL of the Li2S8 solution was applied to the cathode, and an equal volume of LiTFSI-based electrolyte was introduced to the anode. The assembled cells were then subjected to galvanostatic discharge at a current of 0.1 mA down to 2.06 V, followed by a potentiostatic hold at 2.05 V to promote Li2S nucleation, continuing until the current dropped below 10−5 A.
Adsorption of lithium polysulfides: In the adsorption experiments, Li2S4 solutions were prepared as followed. First, sulfur and Li2S powers were mixed in a 3:1 molar ratio, then dissolved in DME solvent and stirred at 80 ℃ for 10 h. Next, 30 mg of NCNT, Nb2O5@NCNT, or NbN@NCNT powder was added to 3 mL of 5 mmol/L Li2S4 solution and allowed to undergo static adsorption for 4 h.
Fig. 1 illustrated the preparation process of the NbN@NCNT composite material. Initially, NCNT were synthesized on carbon paper (designated as CP@NCNT) through surface plasma-enhanced chemical vapor deposition (CVD) [25,26]. To prepare Nb2O5-loaded NCNT (Nb2O5@NCNT), ALD technology was employed, using deionized water and Nb(OEt)5 as the oxygen and niobium precursors, respectively. The ALD process was repeated 60 cycles to ensure the deposition of a uniform and continuous Nb2O5 film on the surface of CP@NCNT [28]. Following the ALD process, NbN@NCNT was synthesized in two steps by annealing the Nb2O5@NCNT in an NH3 atmosphere. Initially, Nb2O5@NCNT was placed in a reaction vessel, and ammonia gas was introduced to create an ammonia-rich environment. The reaction vessel was then heated to 700 ℃. Under these conditions, Nb2O5 reacted with NH3, forming NbN and water as a byproduct. Once the reaction was complete, the product was left to cool for 15 min to obtain the NbN@NCNT. The Flexibility demonstration of Nb2O5@NCNT and NbN@NCNT host was presented in Fig. S1 (Supporting information). All the samples demonstrated excellent flexibility and mechanical properties, which contributed to the ductility of the positive electrode during the cycling process. This ductility effectively mitigated volume expansion during the charge and discharge.
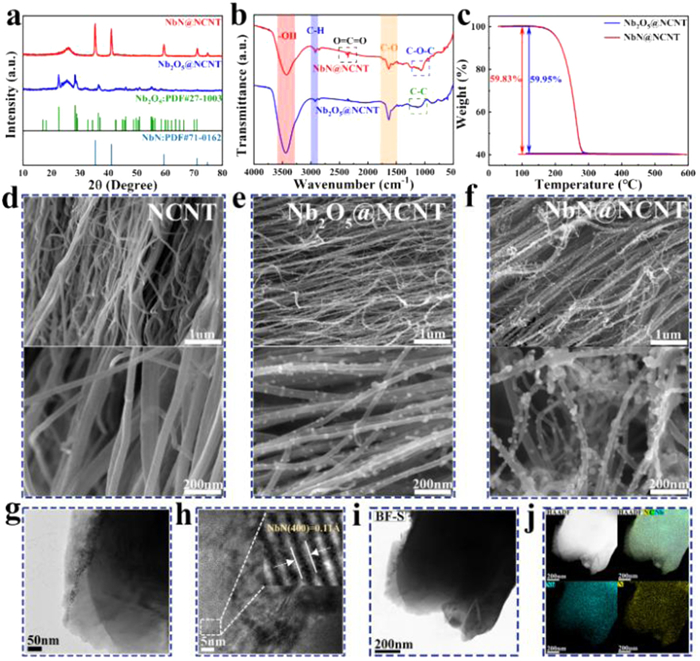
To confirm the successful synthesis of NbN@NCNT, its crystal structure was analyzed using X-ray diffraction (XRD), as presented in Fig. 2a. The Nb2O5@NCNT and NbN@NCNT samples exhibited XRD patterns that matched the standard cubic phases of Nb2O5 (PDF#27–1003) and NbN (PDF#71–0162), respectively. As displayed in the XRD pattern of Nb2O5@NCNT, two distinct peaks were observed at 2θ = 22.551° and 28.265°, corresponding to the (001) and (180) plane of Nb2O5 [29], respectively, which were consistent with the standard cards (PDF#27–1003). In the case of NbN@NCNT [30], peaks corresponding to the standard cards PDF#71–0162 were observed at 2θ = 35.373° for the (101) plane and 41.041° for the (200) plane. These results confirmed the successful synthesis of the NbN@NCNT composite material. To further investigate the internal chemical structure of Nb2O5@NCNT and NbN@NCNT, Fourier-transform infrared spectroscopy (FT-IR) was subsequently employed. As shown in Fig. 2b, NbN@NCNT retained some characteristic peaks of Nb2O5@NCNT at 2923 cm−1 and 1632 cm−1, which corresponded to C=C and C=O stretching, as well as C–H bending, respectively. Additionally, the NbN@NCNT exhibited characteristic stretching bands at 2348 cm−1 for O=C=O and at 1248 cm−1 for C=N, confirming the successful synthesis of NbN@NCNT. Furthermore, Fig. 2c showed the TG data of the two samples. The initial decomposition temperature of Nb2O5@NCNT and NbN@NCNT was 180 ℃. After measurement, the solid residue of NbN@NCNT was 59.95%, while that of Nb2O5@NCNT was 59.83%, indicating that both Nb2O5@NCNT and NbN@NCNT exhibited similar thermal stability within the same temperature range. The morphology of NCNT, Nb2O5@NCNT, and NbN@NCNT was observed using scanning electron microscopy (SEM) and transmission electron microscopy (TEM). As shown in the SEM images of Figs. 2d-f, all three samples exhibited a fibrous structure. However, the surface of the NCNT fibers was smooth, while the surface of the Nb2O5@NCNT and the NbN@NCNT fibers were rough, with noticeable particle adhesion. To further investigate the composition of particles attached to the surface of NbN@NCNT fibers, TEM tests were performed. The TEM image in Figs. 2g and h showed lattice fringes with a spacing of 0.11 Å, corresponding to the plane (400) of NbN. Additionally, the mapping in Figs. 2i and j illustrated the uniform distribution of C, Nb, and N on the NbN@NCNT surface. The above results confirmed that the particles attached to the NbN@NCNT fibers were NbN. Additionally, TEM images at different scales were presented in Fig. S2 (Supporting information), which showed the homogeneity and consistency of the NbN@NCNT particles were better.
To evaluate the adsorption capacity of the NCNT, Nb2O5@NCNT and NbN@NCNT samples towards LiPSs, adsorption experiments were conducted using yellow Li2S4 as a substitute for soluble LiPSs, followed by ultraviolet-visible (UV–vis) spectral detection. A 5 mL solution of Li2S4 was used as a reference, into which equal amounts of NCNT, Nb2O5@NCNT and NbN@NCNT were introduced to observe color changes. As illustrated in Fig. 3a, the Li2S4 solution adsorbed by the NbN@NCNT sample completely decolorized after soaking for 4 h. In contrast, a trace amount of yellow remained in the Li2S4 solution with NCNT and Nb2O5@NCNT, indicating that NbN@NCNT exhibited a stronger adsorption effect on Li2S4 compared to the Nb2O5@NCNT and NCNT, which was beneficial for the conversion kinetics of LiPSs to Li2S [15]. The adsorption capabilities were further compared using UV–vis spectroscopy. The results from the visible adsorption experiments were shown in Fig. 3a. In the UV spectral plot, the peak intensity of NbN@NCNT was lower compared to the other samples, indicating that NbN@NCNT exhibited a stronger adsorption capacity for LiPSs compared to both NCNT and Nb2O5@NCNT. Subsequently, the composition of the discharge products on the S/NbN@NCNT and S/Nb2O5@NCNT electrodes, after washing with DME solvent, was analyzed using X-ray photoelectron spectroscopy (XPS). As illustrated in Fig. 3b, the S 2p spectrum revealed the formation of the final product Li2S, indicating that after the electrochemical lithiation of the electrodes, Li2S8 was fully reduced and catalytically transformed into the final Li2S. This process was accompanied by the transfer of free Li+ from the lithium electrode to Li2S8 to compensate for the charge [27]. Furthermore, Fig. S3 (Supporting information) showed the C 1s spectra of NbN@NCNT at the original voltage as well as after discharging at 2.10 V and 1.70 V. The spectra revealed a main peak at 284.80 eV, corresponding to C–C or C–H bonding [31].
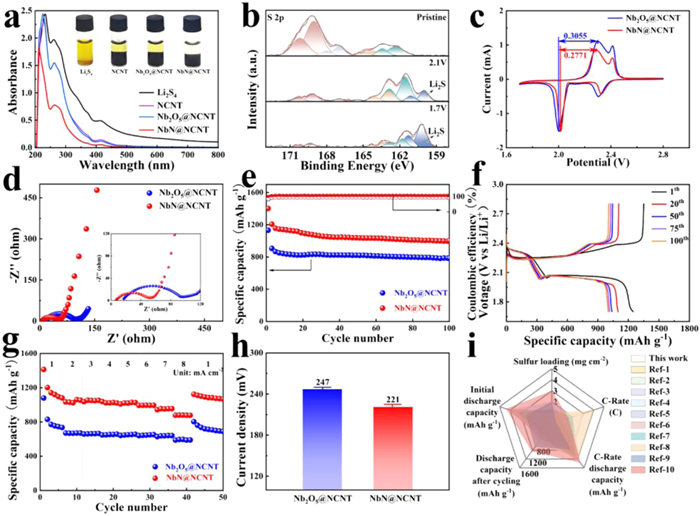
The electrochemical performance of NbN@NCNT impregnated with sulfur as cathode (S/NbN@NCNT) was tested to further verify the effect of NbN. And the Nb2O5@NCNT impregnated with sulfur (S/Nb2O5@NCNT) served as the counterparts. As showed in Fig. 3c, the cyclic voltammetry (CV) curves for the cells assembled with S/Nb2O5@NCNT and S/NbN@NCNT cathodes were presented within a voltage range from 1.70 V to 2.80 V. The initial reduction peak observed at 2.30 V in the S/NbN@NCNT cathode was corresponded to the conversion of S8 into higher-order soluble LiPSs. The subsequent peak around 2.0 V corresponds to the further reduction of these higher-order soluble LiPSs into lower-order insoluble polysulfides, such as Li2S2 and Li2S [32]. Additionally, the presence of double oxidation peak at 2.38 V and 2.46 V indicated the re-oxidation of short-chain lithium sulfides (Li2S2/Li2S) back to S8 [33]. In particular, the cathodic and anodic peaks observed for the S/NbN@NCNT were more distinct compared to those of the S/Nb2O5@NCNT, indicating the incorporation of NbN@NCNT enhanced reversibility and increased the number of electroactive sites. Furthermore, the potential difference between the cathodic and anodic peaks of the S/NbN@NCNT cathode near 2.0 V was 0.2771 V, significantly lower than that of S/Nb2O5@NCNT cathode (0.3055 V), suggesting that the NbN enhanced the electrochemical reaction kinetics. Concurrently, the curve area of the S/NbN@NCNT cathode was greater compared to the S/Nb2O5@NCNT cathode, indicating reduced polarization and a higher reversible specific capacity in LSBs [34]. Fig. S4 (Supporting information) presented the CV curves of S/Nb2O5@NCNT and S/NbN@NCNT cathodes at different scanning rates ranging from 0.1 mV/s to 0.5 mV/s. As displayed in the CV curves of S/NbN@NCNT, the position of the redox peaks shifted slightly at the scanning rate increased from 0.1 mV/s to 0.5 mV/s, indicating that the S/NbN@NCNT electrode exhibited good reversibility [35]. Furthermore, the electrochemical impedance spectroscopy (EIS) curves showed in Fig. 3d further supported this phenomenon. The initial ohmic resistance (Rs) of the S/NbN@NCNT electrode was approximately 8 Ω, whereas that of the S/Nb2O5@NCNT electrode was 17.22 Ω. Additionally, the charge transfer resistance (Rct) of the S/NbN@NCNT electrode, measured at 52 Ω, was significantly lower compared to the 95.69 Ω observed for the S/Nb2O5@NCNT electrode. The Rct was strongly linked to the reaction activation energy of the sulfur cathode. The reduced Rct observed for the S/NbN@NCNT cathode indicated that NbN@NCNT actively enhanced the electrochemical kinetics. This result confirmed that NbN@NCNT significantly enhanced the electron migration rate compared to Nb2O5@NCNT and catalyzed the reaction kinetics of sulfur species [36]. Based on the aforementioned findings, it was clear that NbN@NCNT had the potential to act as a catalyst for the electrochemical reaction, enhancing the electrochemical activity during the charging and discharging and, consequently, improving the overall reaction kinetics.
To better understand the catalytic and adsorption effects of NbN deposited on NCNT, two different cathodes, S/Nb2O5@NCNT and S/NbN@NCNT, were fabricated and assembled with LSBs for testing performance. As shown in Fig. 3e, the cycling performance of the S/NbN@NCNT and S/Nb2O5@NCNT cathodes at a current density of 2 mA/cm2 and a sulfur loading of 3 mg/cm2 was investigated. The electrolyte used in this study was 1 mol/L LiTFSI in DME/DOL (1:1, v/v) with 1 wt% LiNO3 additive, and the electrolyte/sulfur (E/S) ratio is controlled as around 16 µL/mg for cathodes. The S/NbN@NCNT cathode exhibited a high initial discharge specific capacity of 1400.90 mAh/g at 2 mA/cm2, outperforming the S/ Nb2O5@NCNT cathode, which exhibited a capacity of 1190.40 mAh/g. Furthermore, after 100 cycles in LSBs, the S/NbN@NCNT cathode maintained a capacity of 1001.02 mAh/g, while the S/Nb2O5@NCNT cathode retained only 798.30 mAh/g. The improved capacity could be attributed to the catalytic effect of NbN in the S/NbN@NCNT, promoting the transformation kinetics of Li2Sx during the charging and discharging process. Simultaneously, NbN@NCNT demonstrated an effective adsorption capacity for LiPSs, which helped mitigate the shuttle effect and enhance the utilization of sulfur. In LSBs, the capacity declined rapidly due to irreversible losses in the early cycles. During subsequent charging, higher-order polysulfides such as Li2S8 and Li2S6 were formed, leading to a decrease in the output capacity during later discharge cycles. Certain polysulfides remaining in the electrolyte during the charge-discharge process undergone side reactions that ultimately reduced capacity [34,36]. The electrochemical behavior of NbN was further studied through charge-discharge curve (Fig. 3f). In Fig. 3f, both the S/NbN@NCNT and S/Nb2O5@NCNT (Fig. S5 in Supporting information) cathodes exhibited two reduction plateaus for sulfur and two oxidation plateaus for sulfur within a voltage window of 1.70–2.80 V, consistent with the findings from the previous CV curve analysis. The characteristic plateau observed at 2.33 V corresponded to the reduction of S8 to Li2S4, while the second plateau near 2.09 V corresponded to the reduction of Li2S4 to Li2S2/Li2S [38]. Moreover, the decay rate of NbN@NCNT was slower than that of Nb2O5@NCNT, suggesting that NbN enhanced the catalytic transformation kinetics of LiPSs.
To evaluate the rate capacity of S/Nb2O5@NCNT and S/NbN@NCNT, their rate performance at varying current densities varying from 1 mA/cm2 to 8 mA/cm2 was investigated. Fig. 3g showed that the batteries with the S/NbN@NCNT cathodes delivered a higher discharge capacity compared to those with S/Nb2O5@NCNT cathodes. Most importantly, the full cell with the S/NbN@NCNT cathode achieved an initial discharge specific capacity of 1412.47 mAh/g at a current density of 1 mA/cm2, which was significantly higher than that of the 1079.70 mAh/g of S/Nb2O5@NCNT cathode. The finding demonstrated that the S/NbN@NCNT cathode exhibited superior transformation stability, thereby improving the conversion kinetics of sulfur species at elevated current densities. Moreover, when the current density reached 8 mA/cm2, the battery assembled with the S/NbN@NCNT cathode retained a capacity of 878.14 mAh/g. When reducing the current density return to 1 mA/cm2, the S/NbN@NCNT cathode demonstrated the ability to recover to a high capacity of 1123.90 mAh/g, confirming its excellent capacity reversibility. The enhanced rate stability and capacity reversibility underscored the benefits of NbN in optimizing the utilization of sulfur and cycle stability through the synergistic effects of catalysis-adsorption. Figs. S6 and S7 (Supporting information) illustrated the charging and discharging profiles of the S/NbN@NCNT and S/Nb2O5@NCNT cathodes at various cycles, with current densities ranging from 1 mA/cm2 to 8 mA/cm2. The results showed that the conversion kinetics of sulfur species on the S/NbN@NCNT electrode was faster, and the cell polarization was reduced. Furthermore, as reported in previous literature, the reaction kinetics of sulfur on various substrates could be illustrated by overpotential. Fig. 3h illustrated the initial overpotential at a current density of 1 mA/cm2. It was evident that the S/NbN@NCNT cathode exhibited a lower overpotential compared to the S/Nb2O5@NCNT at 1 mA/cm2, indicating that NbN provided additional active sites that enhanced the electrochemical kinetics of sulfur species, thereby reducing the overpotential [37]. Furthermore, compared to the performance of cathode catalysts in previously reported LSBs, this work demonstrated the highest initial capacity and the highest sulfur cathode loading, as shown in Fig. 3i and Table S1 (Supporting information). The enhanced stability and capacity of the S/NbN@NCNT illustrated the superior catalytic performance of NbN, which enhanced the electrochemical kinetics and improved the chemical interaction between LiPSs and the host.
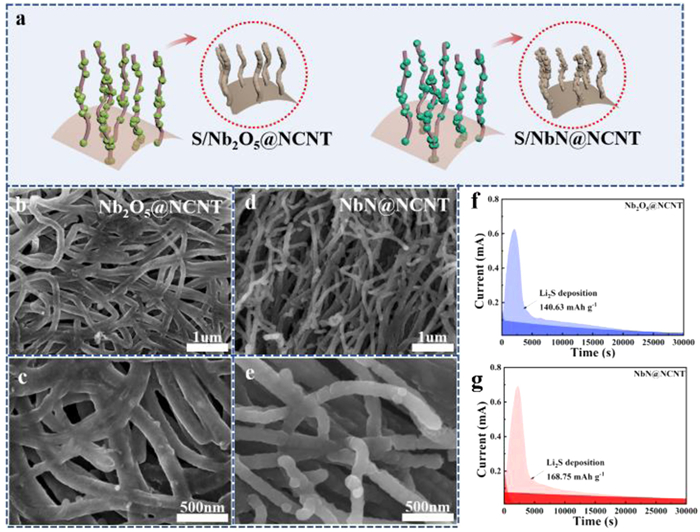
The slow conversion kinetics of LiPSs to Li2S and the non-uniform nucleation and deposition of Li2S were the main factors limiting the capacity output of LSBs [39]. Therefore, enhancing the liquid-solid phase transformation between LiPSs and Li2S, while promoting uniform Li2S deposition [40], could improve both capacity output and capacity retention. This work also investigated Li2S deposition after electrode cycling and the corresponding SEM images, aiming to analyze the conversion kinetics and induced Li2S deposition on the S/NbN@NCNT electrode (Fig. 4). Fig. 4a demonstrated the deposition process of Li2S, simulating the deposition of Li2S on the S/NbN@NCNT and S/Nb2O5@NCNT electrodes. Moreover, SEM images at different magnifications (Figs. 4d and e) revealed that the Li2S deposition sites on the cycled S/NbN@NCNT electrode were more dispersed and uniform compared to those on S/Nb2O5@NCNT electrode (Figs. 4b and c), indicating a higher number of Li2S anchoring sites on the S/NbN@NCNT electrode surface. Additionally, Li2S nucleation experiments confirmed this situation. The kinetics of Li2S nucleation were evaluated by measuring the potential difference between the Li2S nucleation point and the tangent to the potential plateau. As depicted in Figs. 4f and g, the S/NbN@NCNT electrode exhibited the most substantial current response to Li2S deposition, indicating that the conversion of LiPSs to Li2S was faster compared to the S/Nb2O5@NCNT. Additionally, Li2S nucleation experiments indicated that the S/NbN@NCNT electrode facilitated the rapid and uniform nucleation. In particular, NbN@NCNT exhibited the largest integrated area and higher current intensity for Li2S precipitation compared to Nb2O5@NCNT. This observation suggested that NbN@NCNT as an active site, could facilitate the deposition and growth of Li2S on the host, promoting the conversion of sulfur species. As shown in Fig. 4, NbN enhanced the catalytic conversion kinetics of LiPSs to Li2S and induced the uniform deposition of Li2S.
In conclusion, NbN@NCNT was successfully synthesized through ALD and NH3 annealing methods. NbN served as an effective catalyst, enhancing the conversion kinetics of LiPSs to Li2S, which improved the utilization of sulfur and increased the specific capacity of LSBs. Additionally, NbN strengthened the interaction with LiPSs, anchoring sulfur species to the surface of host and thereby mitigating the shuttle effect. The results showed that the S/NbN@NCNT electrode exhibited an initial discharge capacity of 1400.900 mAh/g at a current density of 2 mA/cm2. Moreover, even after 100 cycles, a capacity retention of 71.5% was maintained. This work presented a rational design approach to enhance the cycling stability of LSBs at a high current density through catalysis-adsorption, thereby advancing the potential of LSBs for high current density applications.
The authors declare that they have no known competing financial interests or personal relationships that could have appeared to influence the work reported in this paper.
Rongjin Lin: Writing – original draft, Methodology. Shuiping Cai: Writing – original draft, Methodology. Chen Cheng: Methodology. Changyong Zhao: Software, Investigation. Yingkang Tian: Data curation. Xiaofei Yang: Supervision, Methodology, Investigation. Xuejie Gao: Validation, Supervision. Runcang Sun: Supervision.
This research was supported by the National Natural Science Foundation of China (No. 22208039), Young Elite Scientists Sponsorship Program by CAST (No. 2023QNRC0247), Science and Technology Projects in Liaoning Province (No. 2024BS193), Liaoning Binhai Laboratory (No. LBLG202409), Young Talents Science and Technology Research Pilot Program of Dalian Polytechnic University (No. XDJH2405).
Supplementary material associated with this article can be ound, in the online version, at doi:
Z. Yu, Y. Shao, L. Ma, et al., Adv. Mater. 34 (2022) 2106618. doi: 10.1002/adma.202106618
Q. Cheng, Z.X. Chen, X.Y. Li, et al., J. Energy Chem. 76 (2023) 181–186. doi: 10.1016/j.jechem.2022.09.029
W. Yao, W. Zheng, J. Xu, et al., ACS Nano 15 (2021) 7114–7130. doi: 10.1021/acsnano.1c00270
Q. Xiao, J. Yang, X. Wang, et al., Carbon Ener. 3 (2021) 271–302. doi: 10.1002/cey2.96
C.X. Bi, N. Yao, X.Y. Li, et al., Adv. Mater. 36 (2024) 2411197. doi: 10.1002/adma.202411197
Y.W. Song, L. Shen, X.Y. Li, et al., Nat. Chem. Eng. 1 (2024) 588–596. doi: 10.1038/s44286-024-00115-4
B. Wang, L. Wang, D. Ding, et al., Adv. Mater. 34 (2022) 2204403. doi: 10.1002/adma.202204403
Y.W. Song, L. Shen, N. Yao, et al., Chem 8 (2022) 3031–3050. doi: 10.1016/j.chempr.2022.07.004
L.P. Hou, X.Q. Zhang, N. Yao, et al., Chem 8 (2022) 1083–1098. doi: 10.1016/j.chempr.2021.12.023
Y. Liu, A. Chatterjee, P. Rusch, et al., ACS Nano 15 (2021) 15047–15056. doi: 10.1021/acsnano.1c05344
L. Zhang, Y. Wang, Z. Niu, J. Chen, Carbon 141 (2019) 400–416. doi: 10.1016/j.carbon.2018.09.067
C. Xia, S. Surendran, S. Ji, et al., Carbon Ener. 4 (2022) 491–505. doi: 10.1002/cey2.207
J. Wang. W.Q. Han, Adv. Funct. Mater. 32 (2021) 2107166.
H. Qian, H. Ren, Y. Zhang, et al., Electrochem. Energy Rev. 5 (2022) 2.
B. Wang, L. Wang, B. Zhang, et al., ACS Nano 16 (2022) 4947–4960. doi: 10.1021/acsnano.2c01179
R. Wang, J. Jiao, D. Liu, et al., Small 20 (2024) 2405148. doi: 10.1002/smll.202405148
Z. Zhang, D. Luo, G. Li, et al., Matter 3 (2020) 920–934. doi: 10.1016/j.matt.2020.06.002
Y. Li, X. Wang, M. Sun, et al., ACS Nano 16 (2022) 17008–17020. doi: 10.1021/acsnano.2c07137
X.Y. Li, S. Feng, M. Zhao, et al., Angew. Chem. Int. Ed. 61 (2022) e202114671. doi: 10.1002/anie.202114671
J. Li, Z. Niu, C. Guo, M. Li, W. Bao, J. Energy Chem. 54 (2021) 434–451. doi: 10.1016/j.jechem.2020.06.009
L. Tian, Z. Zhang, S. Liu, G. Li, X. Gao, Nano Energy 106 (2023) 108037. doi: 10.1016/j.nanoen.2022.108037
C. Ma, X. Jia, X. Liu, et al., J. Power Sources 520 (2022) 230764. doi: 10.1016/j.jpowsour.2021.230764
Z. Shen, Z. Zhang, M. Li, et al., ACS Nano 14 (2020) 6673–6682. doi: 10.1021/acsnano.9b09371
N. Shi, B. Xi, J. Liu, et al., Adv. Funct. Mater. 32 (2022) 2111586. doi: 10.1002/adfm.202111586
X. Gao, X. Yang, M. Li, et al., Adv. Funct. Mater. 29 (2019) 1806724. doi: 10.1002/adfm.201806724
H. Wu, X. Gao, X. Chen, et al., Carbon Ener 6 (2023) e422.
L. Wang, Z.Y. Wang, J.F. Wu, et al., Nano Energy 77 (2020) 105173. doi: 10.1016/j.nanoen.2020.105173
L. Zhan, X. Zhou, J. Luo, X. Fan, X. Ning, Int. J. Hydrog. Energy 47 (2022) 27671–27679. doi: 10.1016/j.ijhydene.2022.06.089
S. Zhu, P. Xu, J. Liu, J. Sun, Electrochim. Acta 331 (2020) 135268. doi: 10.1016/j.electacta.2019.135268
S. Fan, S. Huang, M.E. Pam, et al., Small 15 (2019) 1906132. doi: 10.1002/smll.201906132
Y. Yu, B. Singh, Z. Yu, et al., Adv. Energy Mater. 14 (2024) 2400845. doi: 10.1002/aenm.202400845
Z. Ye, Y. Jiang, L. Li, F. Wu, R. Chen, Adv. Mater. 32 (2020) 2002168. doi: 10.1002/adma.202002168
J. Zhou, W. Tang, C. Shu, et al., Mater. Today Energy 30 (2022) 101151. doi: 10.1016/j.mtener.2022.101151
R. Liu, W. Liu, Y. Bu, et al., ACS Nano 14 (2020) 17308–17320. doi: 10.1021/acsnano.0c07415
L.P. Hou, Z. Li, N. Yao, et al., Adv. Mater. 34 (2022) 2205284. doi: 10.1002/adma.202205284
X. Zhou, R. Meng, N. Zhong, et al., Small Methods 5 (2021) 2100571. doi: 10.1002/smtd.202100571
Y. Wen, Z. Shen, J. Hui, H. Zhang, Q. Zhu, Adv. Energy Mater. 13 (2023) 2204345. doi: 10.1002/aenm.202204345
D.Q. Cai, J.L. Yang, T. Liu, S.X. Zhao, G. Cao, Nano Energy 89 (2021) 106452. doi: 10.1016/j.nanoen.2021.106452
H.J. Li, K. Xi, W. Wang, et al., Energy Stor. Mater. 45 (2022) 1229–1237.
Z. Li, Y. Zhou, Y. Wang, Y.C. Lu, Adv. Energy Mater. 9 (2018) 1802207.

Figure 2 (a) XRD results of Nb2O5@NCNT, NbN@NCNT and PDF|27–1003, PDF|71–0162 of Nb2O5, NbN. (b) FT-IR results of different powder samples. (c) TGA measurement curve of different samples. (d-f) SEM images of NCNT, Nb2O5@NCNT, NbN@NCNT. (g-j) TEM images and corresponding elemental mapping of NbN@NCNT.

Figure 3 (a) UV−vis spectra and corresponding optical photographs of the flasks containing a Li2S4 solution and the different materials after 4 h adsorption. (b) S 2p spectra of NbN@NCNT after discharging to 1.70 V, 2.10 V and pristine voltage. (c) The cyclic voltammetry (CV) curves. (d) The electrochemical impedance spectroscopy (EIS) of the batteries before cycling. (e) Cycling performance at 2 mA/cm2. (f) Charging-discharging profiles of S/NbN@NCNT at various cycles. (g) C-rate performance from 1 mA/cm2 to 8 mA/cm2. (h) The overpotential comparisons at 1 mA/cm2. (i) Cathode catalysts comparison data.

 扫一扫看文章

扫一扫关注我们
 DownLoad:

 下载:
下载:

 下载:
下载: