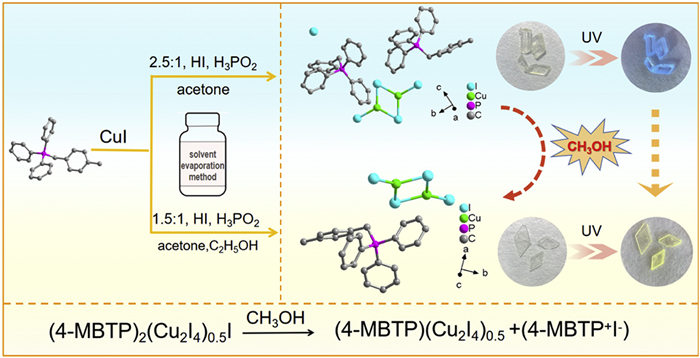
Scheme 1.
Illustration of the preparation of compounds 1 and 2 and structural transformation-induced switchable luminescence.

Low-dimensional organic–inorganic metal halides (OIMHs), as a class of fascinating luminescent materials consisting of organic cations and metal halide anions, have drawn increasing attention in recent years [1-3]. OIMHs exhibit tunable optical properties, high defect tolerance, convenient synthesis methods, and adjustable energy bands, making them widely applicable in various fields such as photoluminescence (PL), scintillators, photodetectors, solid-state lighting, and anticounterfeiting labeling [4-7]. The dimensions and optical properties of OIMHs can be tuned by selecting different metals, halogens, and organic components. The development of numerous lead-halide perovskites with outstanding optoelectronic performance has been driven by the unique 6s2 lone-pair electronic configuration of Pb2+ [8-10]. However, the inherent toxicity of lead poses significant risks to both the environment and human health, which has spurred considerable interest in lead-free metal halides.
Copper-based halides with a d10 configuration present an appealing alternative to traditional lead halides, as they not only eliminate the issue of lead toxicity but also feature varied coordination numbers, geometric structures and tunable luminescence properties. These distinctive characteristics contribute to the growing interest in copper halide materials [11-13]. To data, various types of copper halide inorganic units have been reported, including CuX2, CuX3, Cu2X4, Cu2X5, Cu4X6, and so on (X = Cl, Br, I). Liu’s group reported an efficient ultrabroad-band warm white-light emission material of MA2CuCl3 [14]. Lei et al. developed a new family of [Cu4X6]2− nanocluster-based hybrid cuprous halide single crystals for high-resolution X-ray imaging [15]. Bakr and coworkers synthesized a series of atomically precise nanoclusters with reversible crystal−liquid−glass transition [16]. The inorganic units of these configurations influence optical properties, thereby opening up new application prospects for copper halides. However, achieving structural transformation between these configurations or maintaining a consistent configuration for transformation to precisely control on-demand luminescence characteristics at the molecular level remains challenging.
Generally, the luminescence mechanism of hybrid halides involves highly localized self-trapped excitons (STEs) within the inorganic metal halide structural units, in which the inorganic units act as independent luminescent centers [17]. However, the luminescence of copper-based halides is mainly related to dual-channel electron transfer, including metal-to-ligand charge transfer, the halide-to-ligand charge transfer or through-space charge transfer (MLCT/HLCT/TSCT) and cluster-centered (CC) excited state [18]. Besides, broadband PL can also originate from defect-assisted recombination due to the lattice defects within the anionic entity. Common structural defects in ionic-type bulk metal halides include halide/metal vacancies, antisites, and interstitials during the assembly process [19]. However, reports of defect-assisted PL in metal halides are rare. Since structural defects can deteriorate optical properties, and doping ions are commonly introduced to promote efficient energy transfer from defect levels to the triplet states or to achieve defect passivation, thereby enhancing PL efficiency [20]. Nonetheless, it has not yet been reported that regulate luminescence from defect-induced to non-defect mechanisms by structural transformation strategies while retaining the inorganic unit unchanged.
In this study, organic quaternary phosphine cation (4-methylbenzyl)triphenylphosphonium chloride (4-MBTPCl) was employed for the synthesis of copper-based halides, aiming to gain a better understanding of the structure−property relationships and luminescence mechanisms. As a result, two novel zero-dimensional (0D) hybrid copper halides compounds (4-MBTP)2(Cu2I4)0.5I (1) and (4-MBTP)(Cu2I4)0.5 (2) were successfully obtained by using the same precursors, but in different solvents and molar ratios through a typical solvent evaporation method (Scheme 1). Experimental characterizations reveal that the blue emission of compound 1 originates from multiple defect states associated with the I vacancies in the lattice. However, the yellow emission of compound 2 was attributed to the synergistic effect of TSCT and CC states. Remarkably, compound 1 can be transformed into compound 2 when exposed in methanol, accompanied by a change in emission color from blue to yellow. Based on the unique structural transformation-induced switchable luminescence properties of compounds 1 and 2, we designed information encryption and optical data storage system. This work represents the first instance of achieving structural transformation from defect to non-defect states and luminescence tuning in OIMH materials.
Synthesis of (4-MBTP)2(Cu2I4)0.5I (1): A mixture of CuI (1 mmol) and 4-MBTPCl (2.5 mmol) was dissolved in a 25 mL vial with acetone (3 mL), H3PO2 (200 µL), HI (100 µL) and stirred violently to form a clear transparent precursor solution. Then, the above solution was placed at room temperature for about three days, the colorless block-shaped single crystals were prepared by slowly evaporating the solvent. Finally, the crystals were washed with ethanol and dried naturally in the air. Yield: 35% based on CuI. IR (KBr pellet, cm-1): 3006 (w), 2873 (w), 1581 (m), 1479 (m), 1431 (s), 1105 (s), 991 (m), 821 (s), 740 (s), 682 (s) (Fig. S1 in Supporting information).
Synthesis of (4-MBTP)(Cu2I4)0.5 (2): A mixture of CuI (1 mmol) and 4-MBTPCl (1.5 mmol) was dissolved in a 25 mL vial with acetone (3 mL), ethanol (3 mL), H3PO2 (200 µL), HI (100 µL) and stirred violently to form a clear transparent precursor solution. Then, the above solution was placed at room temperature for about three days, the colorless block-shaped single crystals were prepared by slowly evaporating the solvent. Finally, the crystals were washed with ethanol and dried naturally in the air. Yield: 38% based on CuI. IR (KBr pellet, cm-1): 3047 (w), 2875 (m), 1581 (m), 1494 (m), 1434 (s), 1110 (s), 995 (m), 825 (s), 744 (s), 688 (s) (Fig. S2 in Supporting information).
Compounds 1 and 2 were synthesized by carefully regulating the reactant ratios of CuI and 4-MBTPCl, as well as the reaction solvent. Specifically, coppound 1 was synthesized by reacting CuI and 4-MBTPCl with the ratio of 1:2.5 in a mixture of acetone, H3PO2 and HI solution. While, compound 2 were prepared with a ratio of CuI to 4-MBTPCl at 1:1.5 and ethanol was added based on the synthesis of compound 1.
BVS calculations [21] show that the valence of Cu atoms in compound 1 and 2 are +1 (Table S3 in Supporting information). The XPS spectra (Figs. S3 and S4 in Supporting information) were also tested to further prove the results of the BVS. The crystal structures were determined by single crystal X-ray diffraction (SCXRD). SCXRD analysis indicates that compound 1 crystallizes in the triclinic system with a P-1 space group, compound 2 belongs to the orthorhombic system with a Pbca space group. Compounds 1 and 2 contain [4-MBTP]+ organic cations and [Cu2I4]2− anions, featuring typical 0D structures but possessing different compositions and stacking patterns. The asymmetric unit of compound 1 consists of one [CuI2]− anion, two [4-MBTP]+ organic cations, and a free I− ion (Fig. S5 in Supporting information). Compound 2 is composed of one [CuI2]- anion and one [4-MBTP]+ organic cations (Fig. S6 in Supporting information). Each Cu atom in compounds 1 and 2 is coordinated to three I atoms, resulting in a trigonal planar [CuI3]2− structure. The [CuI3]2− cluster shows a slight distortion of the copper cluster with unequal Ⅰ–Cu–Ⅰ angles of 122.48°, 121.44° and 116.06° for 1; 128.36°, 102.12°, 128.86° for 2. These double trigonal planar [CuI3]2− with edge-sharing to form a [Cu2I4]2− dimer with planar rhombic structure. The Cu–Ⅰ distances range from 2.495(9) Å to 2.564(9) Å and the Cu···Cu distance in [Cu2I4]2− is 2.714 Å in compound 1 (Fig. S7a in Supporting information).
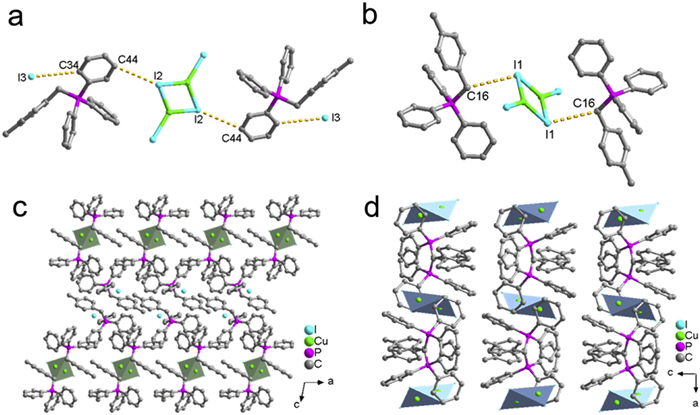
Distinctively, the bond distances of Cu–Ⅰ are in the range of 2.480(9)–2.598(10) Å and the Cu···Cu distance in [Cu2I4]2− is 3.262 Å in compound 2 (Fig. S7b in Supporting information). The distance of the two nearest adjacent [Cu2I4]2− in compound 1 and 2 is 11.00 and 11.88 Å, respectively (Figs. S8 and S9 in Supporting information). The [Cu2I4]2− anions are dispersed and isolated by [4-MBTP]+ organic cations to form a 0D structure, which is stabilized by hydrogen-bonds interaction [C34−H34…I3: 3.917(6) Å and C44−H44…I2: 3.752(6) Å for 1, C16−H16B…I1: 3.931(5) Å for 2] (Fig. 1). It is worth mentioning that the structural distortion of inorganic units, the arrangement of the organic cations, and free halogen anions in hybrid metal halides may affect their luminescent properties. The experimental powder X-ray diffraction (PXRD) patterns match well with the simulated ones, confirming the phase purity of compounds 1 and 2 (Figs. S10 and S11 in Supporting information).
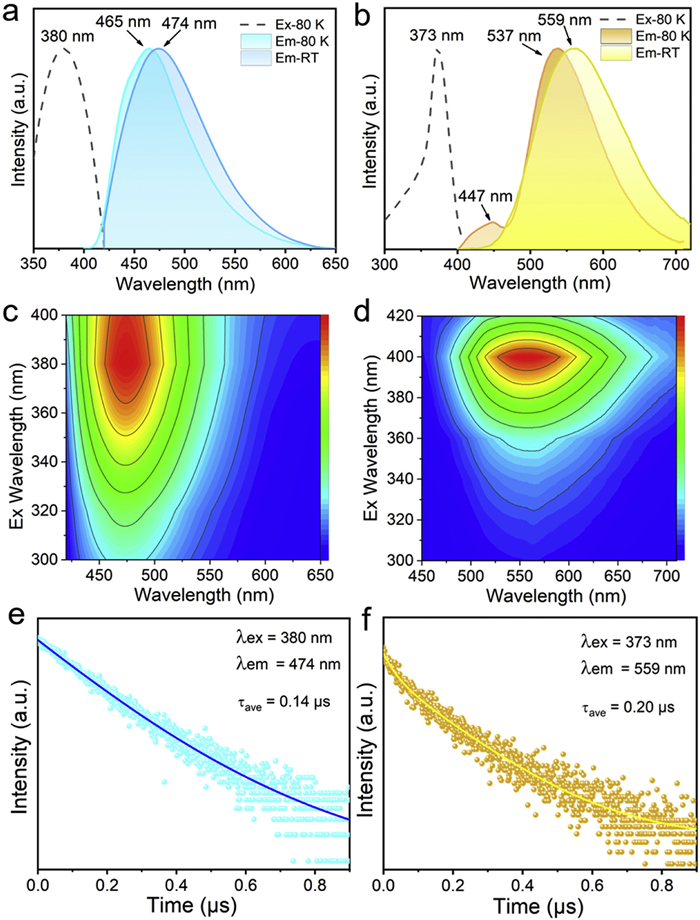
The optical properties of compounds 1–2 were characterized by steady-state and time-resolved PL spectra as well as UV–vis absorption spectra at room temperature. The UV–vis absorption spectra of compounds 1 and 2 are shown in Fig. S12 (Supporting information). They exhibit strong absorbance in the UV region and weak absorbance in the visible region, which are consistent with the transparency and colorless features of compounds 1 and 2. The optical band gap energy (Eg) values are estimated to be 2.98 and 2.60 eV according to the Tauc equation. Upon UV irradiation, compounds 1 and 2 exhibit blue and yellow emissions with Commission Internationale del’Eclairage (CIE) chromaticity coordinates of (0.23, 0.24) and (0.42, 0.52), respectively (Fig. S13 in Supporting information). Under 380 nm UV light excitation, the PL spectra of compound 1 shows a single broad-band emission peak at 474 nm with a full width at half-maximum (FWHM) of 95.35 nm and the Stokes shift of 94 nm (Fig. 2a). In contrast, an obvious emission peak located at 559 nm with a broad FWHM of 141 nm, and a large Stokes shift of 183 nm was observed for compound 2 upon 373 nm UV light excitation (Fig. 2b). In 0D metal halide hybrids, the structural distortion of inorganic metal halide units affects the bandwidth of the emission spectrum. To quantify the distortion of the [Cu2I4]2− dimers in compounds 1 and 2, the bond length distortion (Δd) and the angular variance (σ2) are defined by the following equations:
|
|
(1) |
|
|
(2) |
where di represents the individual Cu–Ⅰ bond length, d is the average Cu–Ⅰ bond length, and αi denotes the angle of Ⅰ–Cu–Ⅰ within the trigonal planar [CuI3]2− unit. Based on the bond lengths and bond angles of the trigonal planar units, we can calculate that the [Cu2I4]2− dimers in compound 2 are more distorted than those in compound 1 (Table S4 in Supporting information). Consequently, such greater distortion in compound 2 will result in a broader emission spectrum bandwidth, a larger PLQY and red-shifted emission wavelengths compared to compound 1 [22,23].
The PLE-dependent PL spectra of compounds 1 and 2 at the excitation wavelength of 300–400 nm were recorded at RT. The identical features of the spectra exhibit that the broadband emission originates from the same excited state, which give rise to a single emitting center in the 3D consecutive PL color mapping, respectively (Figs. 2c and d). To further explore more photophysical properties of compounds 1 and 2, the time resolved PL spectra and recombination dynamics were studied. The PL decay dynamics were fitted by biexponential function with the average PL lifetimes of 0.14 and 0.20 µs (Figs. 2e and f). In addition, compound 2 has a higher PLQY of 15% than compound 1 with a PLQY of only about 1% (Figs. S14 and S15 in Supporting information).
It has been reported that the broadband emissions of certain semiconducting materials may originate from deep or surface defects [24-26]. The emission intensity is strongly influenced by particle size and can be easily quenched by particle aggregation [27]. We compared the PL properties of bulk single crystals and ground powders of compounds 1 and 2. Manual grinding of compound 1 leads to a significant change by shifting from blue emission to non-luminescence, which illustrates that the light emission may be attributed to the material defects of compound 1 (Figs. 3a and b). The nearly identical emission spectra of compound 2 indicate that the broadband light emission does not originate from surface defects (Fig. 3c). Furthermore, The XRD and Raman spectra of compound 1 remain consistent before and after grinding (Figs. S16 and 17 in Supporting information), which ruled out the possibility of fluorescence quenching caused by structural collapse. Additionally, we tested the PL spectrum of the ligand and found no emission peak, which rules out the possibility of luminescence from the ligand (Fig. S18 in Supporting information).
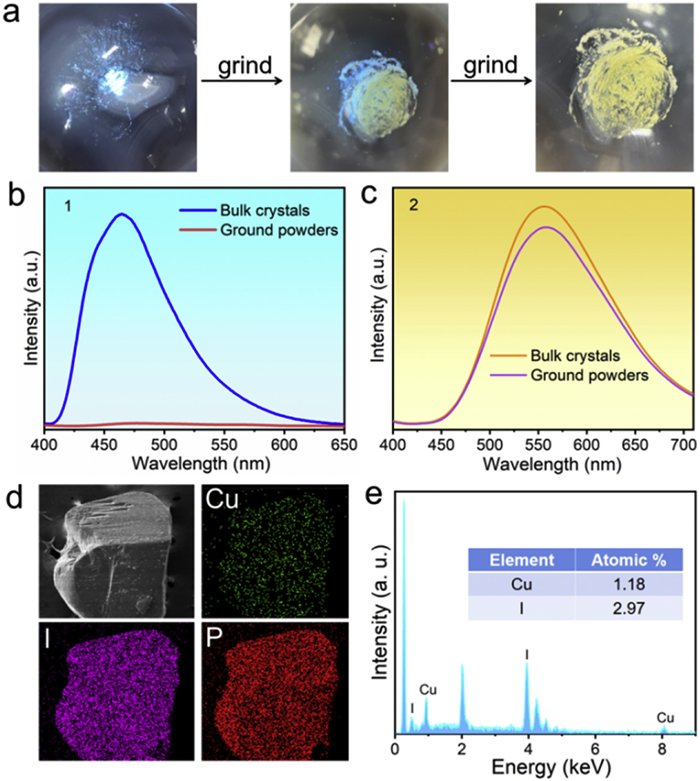
To further verify the presence of defect states, power-dependent PL spectra were measured. The concentration of impurities is limited for permanent lattice defects, leading to saturation of photoluminescence (PL) intensity at high excitation power densities [28-30]. For compound 1, the PL intensity saturates at high excitation power density (Fig. 4a), suggesting that the blue emission originates from a defect-related excited state. But for compound 2, it shows a linear relationship between PL emission intensity and excitation laser power density (Fig. 4b), which indicates that the emission of compound 2 does not come from permanent material defects. EDS of compound 2 illustrate the uniform distribution of elements (Fig. S19 in Supporting information). However, the EDS of compound 1 reveals that the ratio of I/Cu is 2.5/1 (Figs. 3d and e) and the ICP results confirmed I ration is 28.64% (calcd. 32.28%), suggesting that I in compound 1 is slightly deficient than that described in the formula of (4-MBTP)2(Cu2I4)0.5I, which may be due to the intrinsic I vacancies caused by halogen release during the process of crystallization (inset of Fig. 4a) [31,32]. In addition, the formation energy of defects is calculated by density functional theory (DFT). As shown in Table S5 (Supporting information), whether under the circumstance of I-rich limit or I-poor limit, vacancy I (VI) has lower defect formation energy.
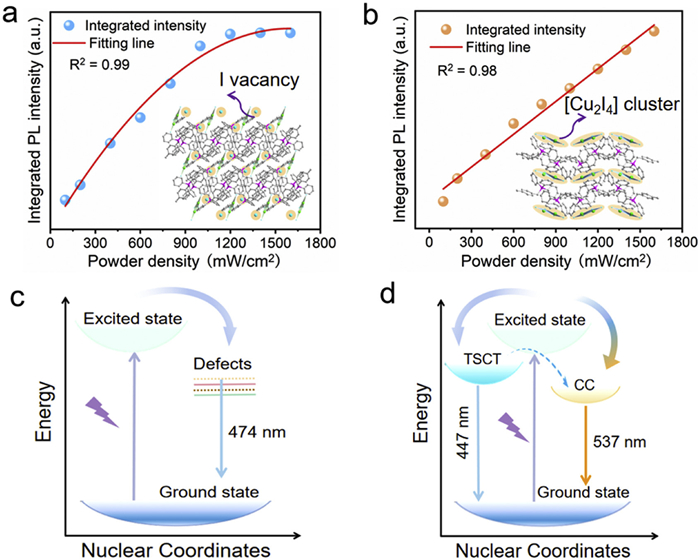
To gain a better understanding of the photophysical properties, PL emission spectra were investigated at various temperatures ranging from 80 K to 300 K. The emission spectra of compound 1 do not split into multiple emitting peaks as the temperature decreases, indicating a single radiative pathway (Fig. 2a). Meanwhile, as the temperature decreases from 300 K to 80 K, the PL spectra of compound 1 demonstrate an increase in intensity and a slight blue-shift of the maximum emission peak (Fig. S20) in Supporting information. The increase of PL intensity at low temperature is due to the enhanced radiation recombination by suppressed thermal quenching, and the blue-shift of the PL spectra might be due to the filling of lower-energy defect states [33]. Relatively, at 80 K, the PL spectra of compound 2 exhibit dual-band emissions, with a high-energy (HE) peak at 447 nm and a low-energy (LE) peak at 537 nm (Fig. 2b). In addition, the position of the LE emission band initially exhibited a red-shift as the temperature increased within the low-temperature range. However, a consecutive blue shift was observed as the temperature continued to increase (Fig. S21 in Supporting information). This phenomenon is similar to that observed in some reported low-dimensional metal halides, which may be ralated to the electron–phonon coupling or the lattice deformation and the change of valence band with temperature [34-37].
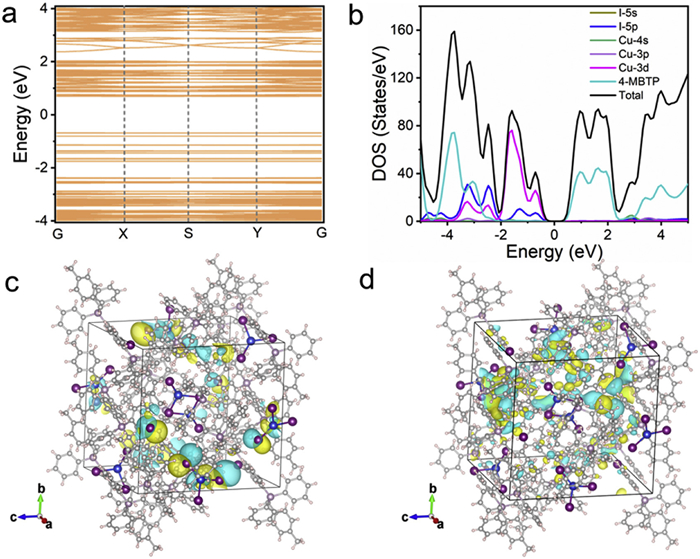
In general, a synergistic effect by the MLCT/HLCT and CC states afford Cu-based halide hybrids dual-band emission since the Cu···Cu distance is close to the sum of the van der Waals radii of copper(Ⅰ) (2.8 Å) [38,39]. But for the ionic species to be more accurate, the use of the through-space charge-transfer (TSCT) state is more reasonable, as there is no ligand but countercations in the compound [40]. In addition, the nearest neighbor distances between the organic cations and the Cu atoms in the [Cu2I4]2− trimers is 5.269 Å for compound 2. Such close distance enable TSCT occurs efficiently. In order to deeply understand the photophysical properties of compound 2, DFT calculations were performed. The calculations indicate that compound 2 exhibits quite flat bands at both band edges, reflecting its 0D crystal structure (Fig. 5a). The band gap was calculated to be 1.42 eV, which is smaller than the experimental value. This underestimation of the bandgap is a common occurrence due to the acknowledged inherent PBE band gap error, that is also observed in other copper halides [41,42]. The projected density of states (PDOS) of compound 2 indicates that the valence band maxima (VBM) is mainly constructed by Cu-3d and I-5p orbitals and the conduction band minima (CBM) is derived from the orbitals of the organic cation (4-MBTP)+(Fig. 5b). This result can also be further validated by the partial charge densities distribution calculated for the VBM and CBM states, as depicted in Figs. 5c and d. The calculation results indicate that a significant participation of organic cations in the luminescence process and a charge transfer would occur from [Cu2I4]2− clusters to(4-MBTP)+organic cations during the optical emission/absorption (inset of Fig. 4b).
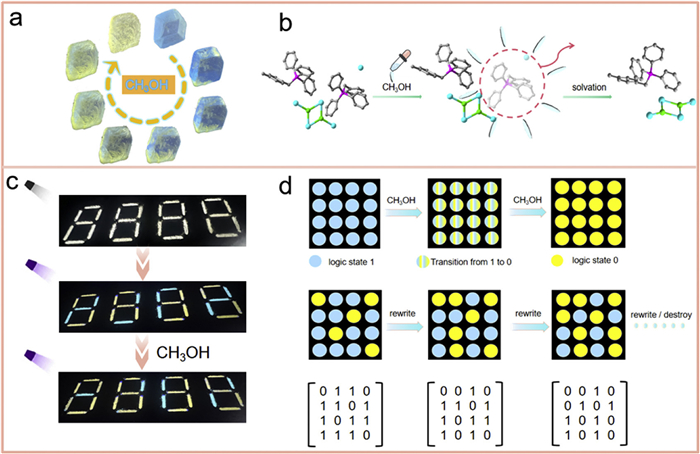
Based on the above optical properties analysis and theoretical calculations, the photophysical process of compound 1 can be illustrated as Fig. 4c, upon UV excitation (λex = 380 nm), the electrons in the ground state transition to the excited state after absorbing photons to form free excitons. Then, the free excitons in the excited state relax to the defect levels and finally return to the ground state through radiative transitions with the blue emission at 474 nm [25,43]. As for compound 2, a majority of the free excitons in the excited state will relax into the LE state and a minority of the free excitons will reach the HE state. The barrier between LE and HE states may impede the thermal conversion from HE to LE states at low temperature, thus leading to a dual emission. While, at a relatively high temperature, all excitons of the HE state may eventually relax to the LE state by the intersystem crossing process or internal conversion, then return to the ground state with yellow emission (Fig. 4d) [44,45]. The similar crystal structures but distinct PL performances of compounds 1 and 2 prompt us to investigate potential structure transformation to achieve PL tuning. As expected, the structural change from compound 1 to compound 2 with luminescence color change from blue to yellow were successfully realized through treating with methanol. Fig. 6a shows the microscopic images of the stepwise transformation process of compound 1 into compound 2. The structural transformation were further verified by the matched PXRD patterns between post-switching of compound 1 and simulated data of compound 2 (Fig. S22 in Supporting information). While, compound 2 cannot be converted into compound 1 reversibly by removing methanol under heating. Furthermore, other organic solvents, such as acetonitrile, ethanol, acetone, isopropanol, cannot achieve the structural transformation, indicating the high selectivity of organic solvent. The structural transformation from compound 1 to compound 2 may be related to the solvent-induced ion-counterion and ion-solvent interactions [46,47]. Specifically, a complementary relationship exists between the Cu+–CH3OH or I-–CH3OH interaction and the Cu+–I- interaction. Since CH3OH interacted with I- (or Cu+) in the solution reducing the Cu+–I- interaction, the enhancement of solvation for I- (or Cu+) by the presence of CH3OH can be reasonably attributed to the decrease of the electrostatic interactions by the counterion Cu+(or I-). This reduction in electrostatic interactions may further lead to an increased Cu…Cu distance in compound 2. In addition, CH3OH induced (4-MBTP+I-) to strip and escape from the lattice (Fig. 6b), the transition of compound 1 to compound 2 can be expressed by Eq. 3:
|
|
(3) |
To further elucidate the structural transformation mechanism, we conducted first-principles calculation based on DFT theory to investigate the transformation energy between compound 1 and compound 2. The transformation energy (Et) was defined as the energy difference between the final products and the initial compound. The calculation results indicate that the Et of the reaction is less than zero, confirming that the reaction is thermodynamically permissible (Table S6 in Supporting information).
The unique structural transformation-induced switchable luminescence properties of organic–inorganic hybrid copper(Ⅰ)-based halides reveal potential applications in anti-counterfeiting, information security, optical data storage, and etc. Firstly, by taking advantage of the methanol-stimulated luminescence switching behavior, we developed a series of digital models for advanced information encryption and security technologies. Herein, we constructed a simple digital module of "8888" by utilizing blue-emissive compound 1, yellow-emissive compound 2, and a commercial phosphor with the same emission characteristics of compound 1 as the filling materials into grooves, which exhibited identical colors under ambient sunlight. Without the correct cipher code, direct UV excitation produces a confusing dual- or single-color outline, resulting in misleading digital information. Only those possessing the decryption key can accurately translate the yellow-colored digit into the correct information "0635″ upon methanol activation (Fig. 6c). Such methanol-triggered switchable luminescence of compound 1, employed as a visual optical strategy, achieves controllable information encryption and decryption.
In order to further enhance the complexity of information encryption, we upgraded the cryptosystem, making it more resistant to cracking. We designed the potential applications of compounds 1 and 2 in optical data storage. Arranging a 4 × 4 array on an appropriate substrate, each cell can be independently filled with materials. Here, we defined the state of emitting blue light as logical state 1, the state of emitting yellow light as logical state 0, and the color state triggered by methanol, transitioning from blue light to yellow light, was defined as the transition state from 1 to 0 (Fig. 6d). By using methanol to trigger different regions, a transition from blue light to yellow light can be achieved, enabling the writing of confidential information. Information can be progressively encoded for recipient access. Under normal circumstances, the array’s information can be read using a UV lamp. In the event of a security threat, the methanol can be released to convert all blue cells to yellow, causing the entire array to display a uniform yellow background, thus obscuring the original information. The simple chemical trigger facilitates the storage and destruction of information, allowing for highly controlled information security management and effectively preventing data leaks.
In summary, we successfully synthesized two novel 0D hybrid copper halides by regulating the reactant molar ratios and different solvents through a typical solvent evaporation method. Compound 1 emits blue emission while compound 2 displays yellow emission under UV irradiation. Detailed structural and photophysical analysis indicate that the luminescence properties of compounds 1 and 2 are highly effected by the structural distortion of inorganic metal halide units, the arrangement of the organic cations, and free halogen anions. Experimental results suggest that the presence of I vacancies in compound 1 may serve as the radiative defect states. However, the yellow emission of compound 2 was attributed to the TSCT and CC state. Interestingly, a structural transition and luminescence switching were observed from compound 1 to compound 2 upon treatment with methanol, which may be related to the solvent-induced ion-counterion and ion-solvent interactions. Our work presents a structural transformation strategy to regulate light emission from defect states to non-defect states, laying the foundation for understanding the structure-property relationship at the molecular level and fabricating new OIHMs luminescent conversion materials through a crystal engineering approach.
The authors declare that they have no known competing financial interests or personal relationships that could have appeared to influence the work reported in this paper.
Lin Yang: Writing – original draft, Methodology, Formal analysis, Data curation. Xia Liu: Formal analysis, Data curation. Bohan Li: Formal analysis, Data curation. Zhuo Liu: Formal analysis, Data curation. Yani Li: Formal analysis, Data curation. Canzhi Shi: Methodology. Yan Xu: Writing – review & editing, Supervision, Funding acquisition, Conceptualization.
This work was supported by the National Natural Science Foundation of China (No. 22171040), Guangdong Provincial Science & Technology Project (No. 2023A0505050084), Shenyang Young and Middle-aged Science and Techonology Innovation Talent Support Program (No. RC230784), Guangdong Basic and Applied Basic Research Foundation (No. 2023A1515140011), and Fundamental Research Funds for the Central Universities, China (No. N2305017).
Supplementary material associated with this article can be found, in the online version, at doi:
M.Z. Li, Z.G. Xia, Chem. Soc. Rev. 50 (2021) 2626–2662. doi: 10.1039/d0cs00779j
K.J. Liu, J. Zhao, Q.L. Liu, Laser Photonics Rev. 18 (2024) 2400345. doi: 10.1002/lpor.202400345
Y.S. Zheng, X. Han, P.X. Cheng, et al., J. Am. Chem. Soc. 144 (2022) 16471–16479. doi: 10.1021/jacs.2c05063
K.L. Chen, B.K. Chen, L.L. Xie, et al., Adv. Funct. Mater. 34 (2023) 2310561.
Z.S. Luo, Y.J. Liu, Y.L. Liu, et al., Adv. Mater. 34 (2022) 2200607. doi: 10.1002/adma.202200607
T.H. Chen, Y.J. Ma, D.P. Yan, Adv. Funct. Mater. 33 (2023) 2214962. doi: 10.1002/adfm.202214962
T.B. Shonde, M. Chaaban, H. Liu, et al., Adv. Mater. 35 (2023) 2301612. doi: 10.1002/adma.202301612
X. Huang, X.T. Li, Y. Tao, et al., J. Am. Chem. Soc. 144 (2022) 12247–12260. doi: 10.1021/jacs.2c03443
J.Z. Ye, D. Gaur, C.J. Mi, et al., Chem. Soc. Rev. 53 (2024) 8095–8122. doi: 10.1039/d4cs00077c
H.Y. Luo, M.Y. Pi, Z.J. Zhan, et al., Chem. Eng. J. 482 (2024) 148838. doi: 10.1016/j.cej.2024.148838
Z.S. Xing, Z.C. Zhou, G.H. Zhong, et al., Adv. Funct. Mater. 32 (2022) 2207638. doi: 10.1002/adfm.202207638
H.B. Li, Y. Lv, Z.N. Zhou, et al., Angew. Chem. Int. Ed. 61 (2022) e202115225. doi: 10.1002/anie.202115225
H. Yin, W.Z. Li, Z.Y. Wang, et al., Chem. Eng. J. 470 (2023) 144353. doi: 10.1016/j.cej.2023.144353
X. Meng, S.J. Ji, Q.J. Wang, et al., Adv. Sci. 9 (2022) 2203596. doi: 10.1002/advs.202203596
D.Y. Li, Q.W. Tan, M.P. Ren, et al., Sci. China Mater. 66 (2023) 4764–4772. doi: 10.1007/s40843-023-2649-1
C.W. Dong, X. Song, B.E. Hasanov, et al., J. Am. Chem. Soc. 146 (2024) 7373–7385. doi: 10.1021/jacs.3c12296
X.C. Wang, T.X. Bai, J.L. Sun, et al., Chem. Eng. J. 486 (2024) 150257. doi: 10.1016/j.cej.2024.150257
K.H. Song, J.J. Wang, L.Z. Feng, et al., Angew. Chem. Int. Ed. 61 (2022) e202208960. doi: 10.1002/anie.202208960
S. Seth, T. Ahmed, A. De, A. Samanta, ACS Energy Lett. 4 (2019) 1610–1618. doi: 10.1021/acsenergylett.9b00849
D.J. Liu, P.P. Dang, G.D. Zhang, et al., InfoMat 6 (2024) e12542. doi: 10.1002/inf2.12542
H.H. Thorp, Inorg. Chem. 31 (1992) 1585–1588. doi: 10.1021/ic00035a012
L.Y. Lian, P. Zhang, G.J. Liang, et al., ACS Appl. Mater. Interfaces 16 (2024) 9030–9038. doi: 10.1021/acsami.3c17346
K.J. Liu, K. Liu, S.Q. Hao, et al., Adv. Funct. Mater. 34 (2024) 2309296. doi: 10.1002/adfm.202309296
X.L. Li, X. Lian, J.H. Pang, et al., J. Phys. Chem. Lett. 11 (2020) 8157–8163. doi: 10.1021/acs.jpclett.0c02355
L. Zhou, L. Zhang, H. Li, et al., Adv. Funct. Mater. 31 (2021) 2108561. doi: 10.1002/adfm.202108561
P.P. Dang, Q.Q. Gu, G.D. Zhang, et al., Laser Photonics Rev. 18 (2024) 2400199. doi: 10.1002/lpor.202400199
Y. Thefioux, M. Cordier, F. Massuyeau, et al., Inorg. Chem. 59 (2020) 5768–5780. doi: 10.1021/acs.inorgchem.0c00560
E.R. Dohner, A. Jaffe, L.R. Bradshaw, H.I. Karunadasa, J. Am. Chem. Soc. 136 (2014) 13154–13157. doi: 10.1021/ja507086b
S. Tongay, J. Suh, C. Ataca, W. Fan, et al., Sci. Rep. 3 (2013) 2657. doi: 10.1038/srep02657
T. Schmidt, K. Lischka, W. Zulehner, Phys. Rev. B: Condens. Matter Mater. Phys. 45 (1992) 8989–8994. doi: 10.1103/PhysRevB.45.8989
Q.D. Ran, Y. Zhang, J. Yang, et al., J. Mater. Chem. C 10 (2022) 1999–2007. doi: 10.1039/d1tc05140g
J. Zhou, M.Z. Li, L.X. Ning, et al., J. Phys. Chem. Lett. 10 (2019) 1337–1341. doi: 10.1021/acs.jpclett.9b00238
H.H. Fang, R. Raissa, M. Abdu-Aguye, et al., Adv. Funct. Mater. 25 (2015) 2378–2385. doi: 10.1002/adfm.201404421
B.B. Su, J.C. Jin, K. Han, Z.G. Xia, Adv. Funct. Mater. 33 (2023) 2210735. doi: 10.1002/adfm.202210735
R. An, P.Y. Du, Y. Wang, et al., Nano Today 56 (2024) 102294. doi: 10.1016/j.nantod.2024.102294
C.Y. Yue, N. Lin, L. Gao, et al., Dalton Trans. 48 (2019) 10151–10159. doi: 10.1039/c9dt01460h
B. Ke, H. Peng, Q.L. Wei, et al., Adv. Opt. Mater. 12 (2024) 2301665. doi: 10.1002/adom.202301665
S.G. Zhou, Y.H. Chen, K.L. Li, et al., Chem. Sci. 14 (2023) 5415–5424. doi: 10.1039/d3sc01762a
R. An, Q.S. Wang, Y. Liang, et al., Angew. Chem. Int. Ed. 64 (2025) e202413991. doi: 10.1002/anie.202413991
X. Liu, T. Zhang, L. Zhou, M. Li, R.X. He, Inorg. Chem. 63 (2024) 5821–5830. doi: 10.1021/acs.inorgchem.3c04141
H. Peng, Y. Tian, X.X. Wang, et al., ACS Appl. Mater. Interfaces 14 (2022) 12395–12403. doi: 10.1021/acsami.2c00006
J.L. Qi, J.J. Wu, S.F. Yan, et al., Inorg. Chem. 62 (2023) 18825–18829. doi: 10.1021/acs.inorgchem.3c03608
K.X. Zhang, S.W. Wang, L.X. Yi, J. Lumin. 254 (2023) 119516. doi: 10.1016/j.jlumin.2022.119516
X. Liu, Y. Li, L. Zhou, et al., Adv. Opt. Mater. 10 (2022) 2200944. doi: 10.1002/adom.202200944
S.Q. Chen, J.M. Gao, J.Y. Chang, et al., ACS Appl. Mater. Interfaces 11 (2019) 17513–17520. doi: 10.1021/acsami.9b02418
T. Megyes, T. Radnai, A. Wakisaka, J. Phys. Chem. A 106 (2002) 8059–8065. doi: 10.1021/jp021028v
S. Mochizuki, A. Wakisaka, J. Phys. Chem. A 106 (2002) 5095–5100. doi: 10.1021/jp014583q

Scheme 1 Illustration of the preparation of compounds 1 and 2 and structural transformation-induced switchable luminescence.

Figure 1 (a, b) The hydrogen-bonds interaction of compounds 1 and 2. (c, d) The stacking structures of compounds 1 and 2.

Figure 2 (a, b) PLE and PL spectra of compounds 1 and 2 at room temperature and 80 K. (c, d) The PLE-dependent PL spectra of compounds 1 and 2. (e, f) Luminescence decay curves of compounds 1 and 2.

Figure 3 (a) The photos of compound 1 ground under UV irradiation. (b) Comparison of PL emission spectra of bulk crystals and powders for compound 1. (c) Comparison of PL emission spectra of bulk crystals and powders for compound 2. (d) Scanning electron microscope (SEM) image and EDS mapping of Cu, I and P element for compound 1. (e) EDS results (atom%) via several points on the selected particle.

Figure 4 (a, b) PL intensity versus excitation power density for compounds 1 and 2. Inset: I vacancies regulated PL mechanism of 1 and [Cu2I4]2−clusters-based luminescence process of 2. (c, d) Schematic illustration of the proposed emission mechanism for compounds 1 and 2.

Figure 5 (a) Band structure of compound 2 based on DFT calculation. (b) The PDOS of compound 2. (c) Partial charge densities distribution for the VBM and (d) CBM states of compound 2.

Figure 6 (a) The microscopic images of the stepwise transformation process of compound 1 into compound 2. (b) Schematic diagram of methanol-induced transition. (c) Encryption and decryption of information via a digital model. (d) Design scheme for an information encoding and self-destruction system.

 扫一扫看文章

扫一扫关注我们
 DownLoad:
 下载:
下载:
 下载:
下载: