Herbert Gleiter Institute of Nanoscience, School of Materials Science and Engineering, Nanjing University of Science and Technology, Nanjing 210094, China
b.
Nanjing Huaxing Pressure Vessel Manufacture Co., Ltd., Nanjing 211131, China
c.
School of Energy and Power Engineering, Nanjing University of Science and Technology, Nanjing 210094, China
d.
Shanghai Synchrotron Radiation Facility, Shanghai Advanced Research Institute, Chinese Academy of Sciences, Shanghai 201204, China
e.
Shanghai Institute of Applied Physics, Chinese Academy of Sciences, Shanghai 201800, China
lansi@njust.edu.cn (S. Lan). 1 These authors contributed equally to this work.
Received Date:
19 November 2024 Accepted Date:
14 January 2025 Revised Date:
02 January 2025 Available Online:
15 May 2026
Abstract:
High-entropy alloys (HEAs) have emerged as promising electrocatalysts due to their unique compositional complexity and tunable electronic structures. However, achieving rapid and efficient synthesis of HEA nanoparticles (NPs) with high electrocatalytic activity and understanding their structural and electronic characteristics remains challenging. Here, we report the synthesis of FeCoNiCuCr HEA NPs via an ultrafast carbon thermal shock (CTS) method. Local structural investigations combining synchrotron pair distribution function (PDF) and X-ray absorption fine structure (XAFS) reveal that incorporating Cr introduces local tetragonal distortions, resulting in residual strain that enhances catalytic performance. This local distortion could be attributed to atomic-scale elemental segregation between Cr and Cu, further stabilizing the structure and improving activity. These synergistic effects, combined with uniform carbon-loaded NPs morphology achieved by the CTS process, enable superior OER performance. This study highlights the role of structural and electronic modulation in HEA catalysts, offering valuable insights for the design of next-generation electrocatalysts.
Exploring clean energy provides a sustainable solution to the energy crisis and environmental challenges [1-4]. Among these solutions, electrocatalytic water splitting has gained significant attention as a promising and cost-effective technology for clean energy conversion [5]. However, the sluggish kinetics of oxygen evolution reaction (OER) at the anode significantly restrains the overall efficiency of the water splitting process [6-8]. Currently, commercial OER electrocatalysts rely heavily on noble metals like Ru and Ir [9,10], but their high costs, scarcity, and instability under operational conditions limit broader applications [11,12]. Therefore, there is an urgent need to develop efficient, durable, and affordable noble-metal-free electrocatalysts with satisfactory OER performance [13]. While traditional single- or dual-element electrocatalysts face challenges in providing sufficient active sites and stabilizing all intermediates adsorbed on active sites with proper binding energies, recent advances in high-entropy alloys (HEAs) offer a promising alternative [14].
HEA is a class of solid-solution alloys composed of five or more elements in equiatomic or near-equiatomic proportions [15-20]. Their diverse active sites and compositional flexibility allow for a tunable and nearly continuous distribution of adsorption energy, maximizing the catalytic performance [21,22]. Additionally, the varying atomic radii in HEAs induce lattice distortions, thereby altering surface energy and catalytic energy barriers, ultimately offering additional avenues for tuning catalytic performance [23]. Despite these advantages, challenges remain in efficiently synthesizing nanosized HEAs with uniform elemental distributions, as immiscibility and segregation often arise during synthesis [24-26]. Furthermore, tunning the synergistic effects through selecting proper elements is crucial to achieve high OER activities [27,28].
Carbon thermal shock method (CTS), a recently breakthrough in nanoscale synthesis, enables the formation of diverse materials, including HEA nanoparticles (NPs) [29-33]. Through rapid Joule heating and cooling, the CTS creates non-equilibrium structures enriched with defects and distortions, and effectively prevents phase separation and particle aggregation [22]. This results in HEA NPs with remarkably high electrochemical activities [34-40]. However, the potential of this method is hindered by varied synthesis conditions — such as element selection, temperature, reaction time, and substrate — that complicates precise control over the microstructure. So, the broad applicability of the CTS method requires further validation particularly for preparing high-performance OER electrocatalysts.
In this work, we report the synthesis of FeCoNiCuCr HEA NPs deposited on pre-treated carbon cloth via the rapid CTS method, achieving superior electrocatalytic OER performance. The CTS process induces surface defects on the carbon substrate, promoting uniform dispersion of the NPs. Synchrotron X-ray pair distribution function (PDF) analysis reveals a tetragonal local distortion in FeCoNiCuCr, which is induced by the introduction of Cr. X-ray absorption fine structure (XAFS) analysis shows that the introduction of Cr can adjust the surface oxidation state to modulate the electronic structure, and the subtle shift of Cr to lower k can be attributed to the atomic-scale segregation between Cr and Cu, contributing to the local distortions and high catalytic performance. This study demonstrates the significant influence of local distortions on HEA electrocatalyst performance, providing valuable insights for HEA design.
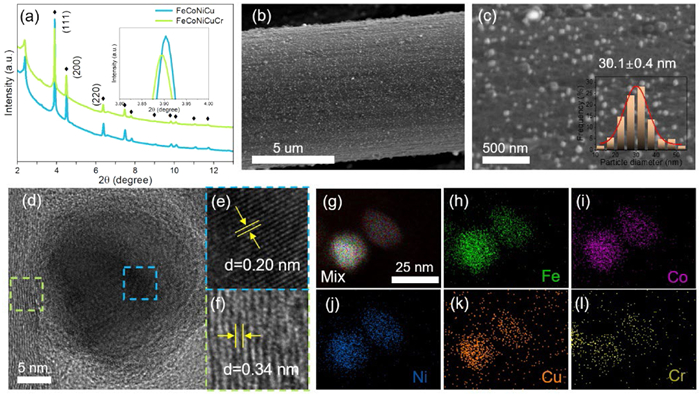
FeCoNiCuCr HEA NPs supported on pre-treated carbon fibers were synthesized via an ultrafast CTS method under an argon (Ar) atmosphere (see details in Experimental Section in Supporting information). For comparison, FeCoNiCu NPs were also prepared via the CTS method with the same conditions. The X-ray diffraction (XRD) patterns of FeCoNiCuCr and FeCoNiCu (Fig. 1a) reveal a face-centered Fm-3m structure with long-range atomic ordering for both materials. Notably, the XRD peaks of FeCoNiCuCr exhibit a shift to lower diffraction angles compared to those of FeCoNiCu, indicating a lattice expansion with addition of Cr. This phenomenon could be attributed to the larger atomic radius of Cr than other constituent elements. Scanning electron microscopy (SEM) images demonstrate the uniform dispersion of HEA NPs loaded on the pre-treated carbon fibers (Figs. 1b and c). This morphology is very different from that observed for the NPs loaded on untreated carbon fibers, where larger sizes and uneven distribution could be observed (Fig. S1 in Supporting information). This improvement is attributed to the pre-treated process. Specifically, the heating treatment enhances surface roughness, increases hydrophilicity, and boosts the number of adsorption sites while reducing the concentration of surface functional groups such as C=C, C=O, O=C-OH, and C-O. These changes promote better absorption of electrolyte ion, reduce electrode resistance, and improve conductivity [41,42]. So, the pre-treatment not only ensures uniform deposition of NPs but also facilitates efficient electron transfer, thereby benefitting to the OER performance [43]. SEM-EDS results (Fig. S2 in Supporting information) reveal that FeCoNiCuCr NPs are composed of 25.9 at% Fe, 20.8 at% Co, 19.6 at% Ni, 15.8 at% Cu, and 17.9 at% Cr, indicating a nearly equal distribution and homogeneous composition within the FeCoNiCuCr NPs. High-resolution transmission electron microscopy (HRTEM) image (Fig. 1d) reveals lattice fringes with a spacing of 0.20 nm in the bulk region (Fig. 1e), corresponding to the (111) plane the face-centered cubic structure. Additionally, the selected area electron diffraction (SAED) pattern (Fig. S3 in Supporting information) of the nanoparticles confirms the cubic Fm-3m structure. This finding aligns well with the long-range structural characteristics determined by XRD. However, the presence of short-range local distortions might be hidden in Bragg diffraction and HRTEM owning to limited spatial resolution [44-46]. In the surface region (Fig. 1f), a lattice fringe spacing of ~0.34 nm is observed, corresponding to the interlayer spacing of carbon fibers. This indicates that the CTS processes enable a carbon coating on the HEA surface, thereby enhancing electron conductivity and contributing to electrocatalytic performance [47]. Energy dispersive spectroscopy (EDS) mapping (Figs. 1g-l) further reveals the homogeneous distribution of Fe, Co, Ni, Cu, and Cr within the nanoparticles, validating the successful synthesis of HEA NPs with a uniformly alloyed composition. The low signal intensities of Cu and Cr are attributed to their relatively low content, which is consistent with SEM-EDS results.
Figure 1
Figure 1.
(a) XRD patterns of the FeCoNiCuCr and FeCoNiCu NPs. (b) Low- and (c) high-magnification SEM images of FeCoNiCuCr NPs supported on carbon fibers. The inset in (c) shows the particle size distribution determined by counting 80 particles with Nano Measurer software. (d) HRTEM images of FeCoNiCuCr NPs as well as (e) lattice fringes in the bulk and (f) surface regions. (g-l) EDS mapping of Fe, Co, Ni, Cu, and Cr in the FeCoNiCuCr HEA NPs.
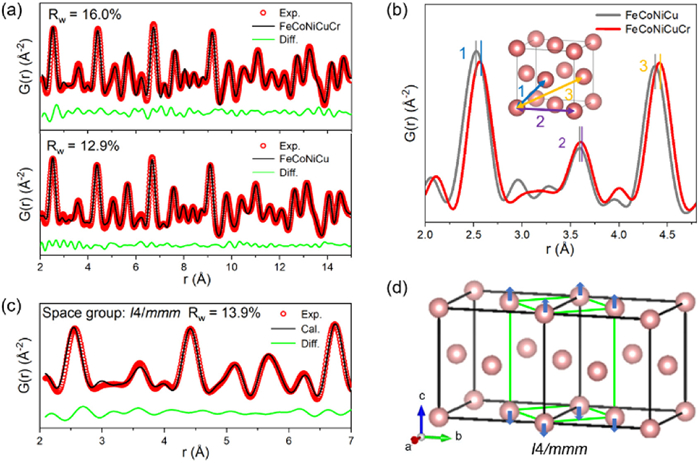
Synchrotron PDF measurement, which has been recognized to be more sensitive to short-range local structure [48], was performed on both FeCoNiCuCr and FeCoNiCu NPs. Initially, the face-centered cubic Fm-3m model was adopted to the full-profile fitting of the PDF pattern, in accordance with the XRD results. However, this cubic model cannot be reconciled with the experimental PDF data (Fig. 2a), as demonstrated by the relatively high value of agreement factor (Rw = 16.0%). In contrast, the PDF pattern of FeCoNiCu can be described well with the Fm-3m model with a lower Rw value of 12.9%. As shown in Fig. 2b, the first peak, corresponding to half of the face diagonal of the FeCoNiCuCr cube, shifts to a higher r compared to that of FeCoNiCu. Meanwhile, the distance of the cube edge, corresponding to the second PDF peak, shows a smaller expansion. According to the local structure (Fig. 2b inset), the inconsistent peak shifting indicates the break of Fm-3m symmetry. To probe this distortion, we fitted the PDF data with various structural models. Observing that the diagonal distances increase while the edge distances remain nearly constant, we selected the tetragonal I4/mmm model, a subgroup of cubic Fm-3m, as a candidate for the local distorted structure with maximal retained symmetry. From the refinement results (Fig. 2c and Fig. S4a in Supporting information), the tetragonal I4/mmm model provides an improved fit in the low-r range (2.1–7 Å), indicating that the incorporation of Cr induces a tetragonal lattice distortion. The conversion relationship between the Fm-3m and I4/mmm is presented in Fig. 2d. When including the high-r region (2.1–15 Å), in contrast, the Fm-3m model can give a satisfactory description of the PDF data for both the samples. These results indicate that the symmetry breaking occurs within a local scale of ~7 Å, while the cubic symmetry can be preserved over long-range ordering, consistent with the XRD observations. Such lattice distortion generates significant residual strain, increasing the density of active catalytic sites, and therefore enhancing the OER electrocatalysis [49].
Figure 2
Figure 2.
(a) Full-profile PDF refinements for the FeCoNiCuCr and FeCoNiCu NPs using cubic Fm-3 m model. (b) Comparison of low-r PDF patterns for FeCoNiCuCr and FeCoNiCu NPs. The inset shows the first three atom pairs in the Fm-3m model, corresponding to the first three PDF peaks. (c) Low-r PDF fitting for the FeCoNiCuCr NPs with tetragonal I4/mmm model. (d) The conversion relation between cubic and tetragonal unit cell. The cubic unit cells are depicted in black lines and the tetragonal unit cell is depicted in green lines. The arrows direct the atomic displacements related to the tetragonal distortion.
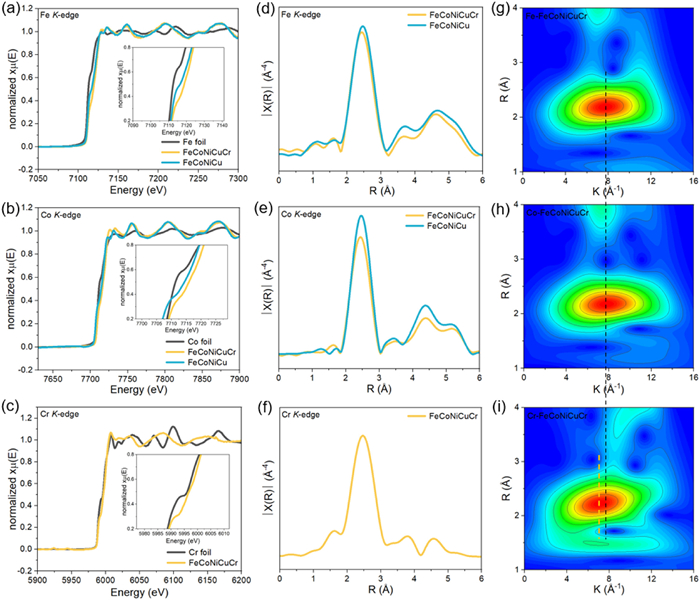
X-ray absorption near-edge structure (XANES) analysis was conducted to elucidate the valence states of the constituent elements in FeCoNiCuCr and FeCoNiCu (Figs. 3a-c, Figs. S5a and b in Supporting information). Compared with their respective reference metal foils, the K-edges of Fe, Co, Ni, and Cu in both samples exhibit slight shifts to higher energies, indicating partial oxidation of these transition metals (TMs). This partial oxidation is advantageous for the electrochemical activity, as it facilitates the formation of hydroxyl oxides (TM-OOHs), an intermediate of the OER reaction, accelerating the electrochemical kinetics [50,51]. Notably, the K-edges of Fe, Co and Cu in FeCoNiCuCr shift slightly to higher energy compared with those in FeCoNiCu, suggesting that the Cr incorporation activates the TMs more effectively. The extended X-ray absorption fine structure (EXAFS) spectra of FeCoNiCuCr and FeCoNiCu (Figs. 3d-f, Figs. S5c and d in Supporting information) exhibit a dominant peak located at ~2.5 Å in R-space, corresponding to TM-TM bonds. A slight shift of this peak is observed in FeCoNiCuCr relative to FeCoNiCu, indicating lattice distortion induced by Cr. Wavelet transform EXAFS (WT-EXAFS) analysis further reveal the local coordination environment (Figs. 3g-i, Figs. S5e and f in Supporting information). Interestingly, the WT-EXAFS plot for Cr exhibits a subtle shift to lower k compared to other elements, suggesting a preferential bonding of Cr with lighter elements such as Fe, Co and Ni, while distancing itself from heavier element like Cu. This behavior aligns with the more negative heat of mixing of Cr-Fe (−1 kJ/mol), Cr-Co (−4 kJ/mol) and Cr-Ni (−7 kJ/mol) pairs compared to the Cr-Cu pair (12 kJ/mol) [52]. The atomic-scale segregation between Cr and Cu is the fundamental structural origin of the observed tetragonal distortion in the material.
Figure 3
Figure 3.
XAFS measurements for FeCoNiCuCr and FeCoNiCu for different elements. (a-c) XANES, (d-f) FT-EXAFS curves of Fe, Co and Cr at R space. (g-i) WT-EXAFS plots of Fe, Co and Cr for FeCoNiCuCr.
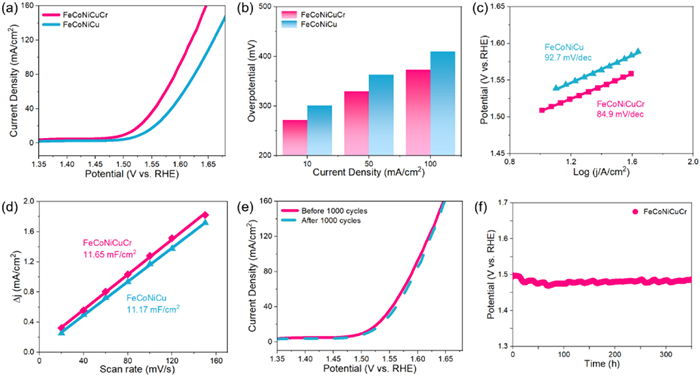
The OER performance of the as-prepared FeCoNiCuCr and FeCoNiCu was evaluated in an O2-saturated 1 mol/L KOH electrolyte using a typical three-electrodes configuration. The polarization linear sweep voltammetry (LSV) curves (Fig. 4a), indicate that the FeCoNiCuCr electrocatalyst requires overpotentials of only 272, 330 and 373 mV to achieve current densities of 10, 50 and 100 mA/cm2, respectively (Fig. 4b). These values are much lower than those for FeCoNiCu (301, 363 and 410 mV). So, the enhanced catalytic performance is due to the synergistic structural and electronic effects caused by the introduction of Cr. As shown in Fig. 4c, the relatively small Tafel slope (84.9 mV/dec) of FeCoNiCuCr demonstrates the fast reaction kinetics during the OER. Additionally, as observed in Fig. S6 (Supporting information), the charge transfer resistance of FeCoNiCuCr is significantly lower than that of FeCoNiCu, suggesting faster electron transfer of FeCoNiCuCr. Double-layer capacitances (Cdl) were measured to evaluate the electrochemically active surface area (ECSA), which can be calculated by the following formula: ECSA = Cdl/Cs, where Cs refers to the specific capacitance for a flat surface, while Cdl is calculated by CV curves from non-Faradaic potentials at different scan rates (Fig. S7 in Supporting information). The larger Cdl (Fig. 4d) of FeCoNiCuCr indicates a greater number of active sites to accelerate the OER reaction [53].
Figure 4
Figure 4.
Electrochemical performance of FeCoNiCuCr and FeCoNiCu for OER. (a) LSV curves, (b) Overpotentials at current densities of 10, 50 and 100 mA/cm2, (c) Tafel slopes and (d) Cdl capacitances of FeCoNiCuCr and FeCoNiCu. (e) LSV curves of initial and after 1000 cycles of FeCoNiCuCr. (f) CP of FeCoNiCuCr at a current density of 10 mA/cm2 for 350 h.
In addition to the high catalytic activity, the FeCoNiCuCr electrocatalyst also demonstrates remarkable electrochemical stability. As shown in Fig. 4e, the LSV curves of the FeCoNiCuCr before and after 1000 cycles between 0.2–0.7 V remain nearly consistent, demonstrating the excellent electrocatalytic stability of the FeCoNiCuCr. Chronopotentiometric (CP) measurements at current density of 10 mA/cm2 over 350 h reveal no significant potential decay, stabilizing at 1.48 V after an initial 10-h increase (Fig. 4f). Furthermore, continuous CP tests at varying current densities (20–100 mA/cm2, Fig. S8 in Supporting information) show stable potentials at each stage, even at high current densities. Moreover, the OER polarization curve (Fig. S9 in Supporting information) of FeCoNiCuCr exhibits a better performance after a 350 h stability test, indicating that the OER performance of FeCoNiCuCr is superior to many previously reported noble-free HEA electrocatalysts (Table S1 in Supporting information). These results confirm the high electrocatalytic stability of FeCoNiCuCr under prolonged operating conditions.
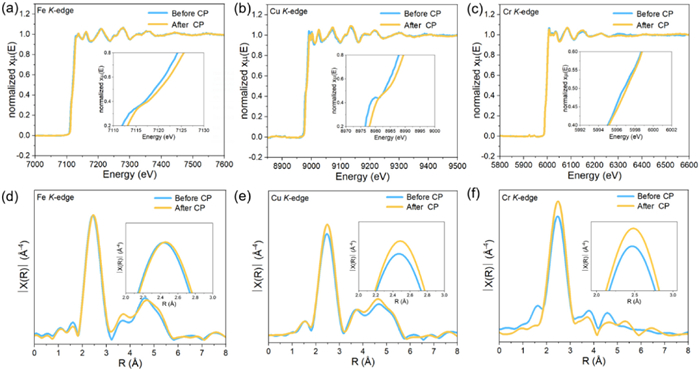
The long-term stability of electrocatalysts is largely influenced by the evolution of active species and structural integrity after surface reconstruction [54,55]. To investigate these aspects, XRD and XAFS were conducted on the FeCoNiCuCr electrocatalyst after CP testing at 10 mA/cm2. The XRD patterns reveal a constant long-range ordered Fm-3 m structure before and after CP tests (Fig. S10 in Supporting information). The main peak shifts slightly to lower angle after the CP tests, indicating an increase in the unit cell parameters. XANES analyses (Figs. 5a-c and Fig. S11a in Supporting information) were further employed to reveal the oxidation states of the FeCoNiCuCr before and after CP tests. The K-edges of Fe, Co, Cu and Cr in the FeCoNiCuCr after the CP tests slightly shift to higher energies, indicating partial oxidation of TMs that promotes electron transfer and reduces the reaction barriers [56]. The K-edge of Ni (Fig. S11b in Supporting information) in the FeCoNiCuCr after the CP tests did not shift to higher energy, indicating that the CP tests did not affect the valence states of Ni. Compared with the FeCoNiCuCr before the CP tests, FT-EXAFS (Figs. 5d-f, Figs. S11c and d in Supporting information) exhibits a significant increase in the distance between the first-shell of Fe, Cu, and Cr, while the unchanged distance between the first-shell of Co and Ni indicated their stable valence states, which is more conducive to the electrochemical stability of the FeCoNiCuCr.
Figure 5
Figure 5.
Series XAFS measurements for FeCoNiCuCr before and after CP test for different elements. (a-c) XANES, (d-f) FT-EXAFS curves of Fe, Cu and Cr at R space.
Overall, the high OER performance of the FeCoNiCuCr HEA NPs arises not only from the fine and uniform carbon-coated NPs morphology achieved via the CTS method, but also from the synergistic structural and electronic effects induced by Cr. The incorporation of Cr introduces local tetragonal distortions, as revealed by short-range PDF data, generating residual strain for enhanced OER. Cr also modulates the electronic structure, promoting partial oxidation of TMs and facilitating the adsorption of OER intermediates. Furthermore, the segregation of Cr from Cu leads to atomic-scale elemental heterogeneity, further contributing to the local distortions while ensuring structural stability and high catalytic activity.
To summarize, we synthesized FeCoNiCuCr HEA NPs on pre-treated carbon fibers via an ultrafast CTS method, which were evaluated as cost-effective and efficient electrocatalysts for the OER application. PDF analysis suggests that FeCoNiCuCr exhibits local tetragonal distortion, breaking Fm-3m symmetry and enhancing OER electrocatalysis through increased active sites and residual strain, while preserving long-range cubic symmetry. XAFS further demonstrated that Cr incorporation enhances metal activation and induces lattice distortion, attributed to atomic-scale segregation and the observed tetragonal distortion. FeCoNiCuCr delivered a low overpotential of 272 mV at 10 mA/cm2, which is better than FeCoNiCu (301 mV) but lower than the FeCoNiCuCr after CP testing (250 mV). This study provides a new method for synthesizing nanoscale, noble-metal-free HEA electrocatalysts for clean energy conversion applications, confirming the correlation between structure and performance of HEA NPs.
Declaration of competing interest
The authors declare that they have no known competing financial interests or personal relationships that could have appeared to influence the work reported in this paper.
CRediT authorship contribution statement
Xindong Zhu: Writing – original draft, Formal analysis, Data curation. Wen Huang: Formal analysis, Data curation. Lan Tan: Data curation. Zhongzheng Yao: Funding acquisition. Xiao Yang: Formal analysis. Ruoyu Song: Resources. Mingxiao Chen: Investigation, Conceptualization. Dong Liu: Resources. Jianrong Zeng: Resources. He Zhu: Writing – review & editing. Si Lan: Writing – review & editing, Resources.
Acknowledgments
This work was financially supported by the National Natural Science Foundation of China (Nos. 22275089, 52222104, 12261160364), the Fundamental Research Funds for the Central Universities (No. 30922010307). We thank the Shanghai synchrotron radiation facility (BL13SSW, SSRF) for help in experiments.
Supplementary materials
Supplementary material associated with this article can be found, in the online version, at doi:10.1016/j.cclet.2025.110852.
[1]
Y. Mei, Y. Feng, C. Zhang, et al., ACS Catal. 12 (2022) 10808–10817. doi: 10.1021/acscatal.2c02604
V. Do, J. Lee, Chem. Soc. Rev. 53 (2024) 2693–2737. doi: 10.1039/d3cs00292f
[55]
Y.J. Son, S. Kim, V. Leung, et al., ACS Catal. 12 (2022) 10384–10399. doi: 10.1021/acscatal.2c01001
[56]
Y. Mei, Y. Feng, C. Zhang, et al., ACS Catal. 17 (2022) 10808–10817. doi: 10.1021/acscatal.2c02604
Figure 1
(a) XRD patterns of the FeCoNiCuCr and FeCoNiCu NPs. (b) Low- and (c) high-magnification SEM images of FeCoNiCuCr NPs supported on carbon fibers. The inset in (c) shows the particle size distribution determined by counting 80 particles with Nano Measurer software. (d) HRTEM images of FeCoNiCuCr NPs as well as (e) lattice fringes in the bulk and (f) surface regions. (g-l) EDS mapping of Fe, Co, Ni, Cu, and Cr in the FeCoNiCuCr HEA NPs.
Figure 2
(a) Full-profile PDF refinements for the FeCoNiCuCr and FeCoNiCu NPs using cubic Fm-3 m model. (b) Comparison of low-r PDF patterns for FeCoNiCuCr and FeCoNiCu NPs. The inset shows the first three atom pairs in the Fm-3m model, corresponding to the first three PDF peaks. (c) Low-r PDF fitting for the FeCoNiCuCr NPs with tetragonal I4/mmm model. (d) The conversion relation between cubic and tetragonal unit cell. The cubic unit cells are depicted in black lines and the tetragonal unit cell is depicted in green lines. The arrows direct the atomic displacements related to the tetragonal distortion.
Figure 3
XAFS measurements for FeCoNiCuCr and FeCoNiCu for different elements. (a-c) XANES, (d-f) FT-EXAFS curves of Fe, Co and Cr at R space. (g-i) WT-EXAFS plots of Fe, Co and Cr for FeCoNiCuCr.
Figure 4
Electrochemical performance of FeCoNiCuCr and FeCoNiCu for OER. (a) LSV curves, (b) Overpotentials at current densities of 10, 50 and 100 mA/cm2, (c) Tafel slopes and (d) Cdl capacitances of FeCoNiCuCr and FeCoNiCu. (e) LSV curves of initial and after 1000 cycles of FeCoNiCuCr. (f) CP of FeCoNiCuCr at a current density of 10 mA/cm2 for 350 h.
Figure 5
Series XAFS measurements for FeCoNiCuCr before and after CP test for different elements. (a-c) XANES, (d-f) FT-EXAFS curves of Fe, Cu and Cr at R space.

 DownLoad:

 下载:
下载:


 下载:
下载:
