Received Date:
26 November 2024 Accepted Date:
14 January 2025 Revised Date:
28 December 2024 Available Online:
15 May 2026
Abstract:
Solid-state lithium (Li) metal batteries have attracted significant attention due to their high energy density and improved safety performance. However, sluggish Li-ion transport and rapid anion migration in solid-state electrolytes often result in heterogeneous Li-ion flux distribution and thus Li dendrite growth. Herein, we developed a highly conductive composite solid electrolyte with an elevated Li-ion transference number through incorporating Gd-doped CeO2 (GDC) nanofillers with abundant surface oxygen defects into poly(vinylidene fluoride-co-hexafluoropropylene) (PVDF-HFP) matrices. The defect concentrations were effectively controlled by regulating the Gd doping ratio in CeO2. As a result, the highest oxygen concentration of 12.2% is achieved for the GDC with 10% Gd doping (GDC-10). The GDC-10 electrolyte demonstrated a high Li-ion transference number of 0.59 and an improved ionic conductivity of 0.40 mS/cm at room temperature, attributed to anion immobilization and enhanced Li-salt dissociation. This was due to the strong interactions between positively charged oxygen vacancies and anions, which effectively reduces surface concentration polarization and homogenizes Li-ion flux. Therefore, LiLi symmetric cells exhibited exceptional cycling stability of 1500 h without noticeable Li dendrite growth at 1 mA/cm2 and 1 mAh/cm2. Furthermore, LiLiFePO4 full cell also stably cycles for 500 cycles with a capacity retention of 90.44% at 1 C. This work provides new insights into the design of composite solid electrolytes through the defect regulation of fillers.
With the development of consumer electronics and electric vehicles, lithium-ion batteries (LIBs) account for a significant portion of energy storage devices due to their high energy density and long cycle life [1-5]. However, liquid electrolytes used in traditional LIBs pose significant challenges in battery safety such as leakage, combustibility, and explosion [6]. Replacing conventional liquid electrolytes with solid-state electrolytes (SSEs) is regarded as one of the most effective approaches to enhance the intrinsic safety of LIBs [7,8]. Thermally stable and nonflammable SSEs effectively eliminate safety hazards, including fire and explosion. Moreover, SSEs with widened electrochemical window also allows them to pair with high-capacity Li metal anodes and high-voltage cathodes, thus boosting the energy density of all-solid-state lithium (Li) metal batteries (ASSLMBs) [9,10].
Despite numerous advantages of SSEs, which position them as the key components of next generation batteries with excellent development prospects [11,12], several drawbacks still need to be addressed. For example, in order to achieve acceptable ion conductivity and mechanical strength, inorganic SSEs (such as oxides, sulfides, halides) must be calcined to increase their density [13-15]. Moreover, their inherent lack of flexibility and the point-to-point contact with electrodes also limit the practical applications [16-25]. Solid polymer electrolytes (SPEs) exhibit huge potential in practical ASSLMBs due to their flexibility, processability, and conformal interface contact [26,27]. Nevertheless, low room-temperature ionic conductivity of SPEs typically necessitates the operation of their application at elevated temperatures [28]. To overcome these limitations, composite solid electrolytes have been designed to combine the strengths of both inorganic SSEs and SPEs [29-32]. However, issues such as sluggish ion transport and dendrite growth still prevent the applications of ASSLMB.
One of the critical reasons leading to the Li dendrites growth is the formation of a Li-ion depletion layer upon Li metal anode due to the rapid consumption of Li ions under working conditions, resulting in uneven Li-ion flux and nonuniform Li platting [33-35]. Besides, the movements of anions within electrolytes and their accumulation on the electrode surface intensifies uneven Li-ion distribution, which thereby results in increased concentration polarization and Li dendrite growth [36-38]. Numerous designs have been proposed to increase the Li-ion transference number to alleviate the problem of uneven Li-ion distribution. Consequently, single ion conducting polymer electrolytes employing polyanion Li salts, where anions are immobilized on the polymeric skeleton, have been developed to obtain high Li-ion transference number [39,40]. Besides, introducing functional fillers into polymer electrolytes is also regarded as an effective approach to enhance Li-ion transference number [41]. For instance, garnet-type ceramic Li6.75La3Zr1.75Ta0.25O12 (LLZTO) with surface Lewis acid sites can interact with trifluoromethylsulfonamide (TFSI−) anions, thus immobilizing anions and enhancing Li-ion transference number [29,42-44]. Oxide fillers (such as CeO2, TiO2 [45], SnO2 [46]) with positively charged oxygen vacancies also exhibit strong interactions with negatively charged anions [47-49]. However, effectively enhancing the defect concentration on the surface of filler remains a challenge. Moreover, the effect of defect concentration on the Li-ion transportation is not yet fully understood.
Herein, we reported the development of Gd-doped CeO2 (GDC) materials with enhanced oxygen vacancy concentrations, achieved by regulating the doping ratio of Gd in CeO2. The incorporation of lower-valence Gd3+ than Ce4+ causes charge compensation in the lattice to maintain the electrical neutrality of the crystal, resulting in the formation of oxygen vacancies eventually [50]. GDC with a Gd doping ratio of 10% (GDC-10) shows the highest surface oxygen vacancy concentration of 12.2%. And the GDC materials were subsequently used as fillers in poly(vinylidene fluoride-co-hexafluoropropylene) (PVDF-HFP) matrices to get the highest Li-ion transference number. Due to the increasing anion anchoring effect with the increase of oxygen vacancy concentration, the polymer electrolytes with this GDC-10 fillers exhibits an optimized Li-ion transference number of 0.59 and enhanced room-temperature ionic conductivity of 0.40 mS/cm. Li||Li symmetrical cell with the PVDF-HFP/GDC-10 SSE stably cycles for more than 1500 h with a reduced polarization voltage at a high current density of 1 mA/cm2 and a high capacity of 1 mAh/cm2. Li||LFP cells demonstrate superior rate performance and extended cycle life, with a capacity retention of 90.44% remains after 500 cycles at 1 C.
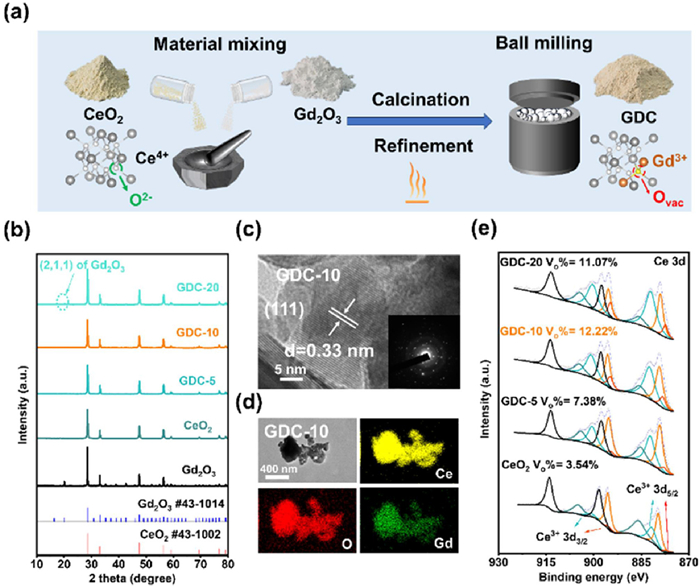
As illustrated in Fig. 1a, the synthesis process of GDC materials primarily involves two stages: calcination and refinement. Firstly, the GDC materials were synthesized by calcining a mixture of CeO2 with Gd2O3 at high temperature, aiming to achieve the successful dope Gd3+ into crystal lattice of CeO2. The substitution of Ce4+ ions with low-valence Gd3+ ions generates the oxygen vacancies in CeO2 due to the charge compensation. Thus, the oxygen vacancy concentration is precisely controlled by regulating the Gd3+ doping concentration in CeO2. Following calcination, the obtained GDC raw materials were refined using high-energy ball milling and sieving, yielding GDC particles with an average particle size of 140 nm (Fig. S1 in Supporting information). In order to identify the GDC materials with different Gd3+ concentration, the samples with the Gd/Ce molar ratio of 5%, 10%, and 20% are denoted as GDC-5, GDC-10, and GDC-20, respectively. The GDC materials present a typical fluorite crystal structure consistent with pure CeO2 samples (Fig. 1b), confirming the successful doping of Gd into CeO2. Notably, when the Gd doping concentration excesses 20%, a slight diffraction peak at 2θ of 20° associated with the (211) plane of Gd2O3 is observed, indicating the incomplete Gd doping. These results demonstrate that increasing the Gd2O3 ratio does not lead to an indefinite increase in the oxygen vacancy concentration of GDC.
Figure 1
Figure 1.
Preparation and characterization of the GDC fillers. (a) Schematic illustration of the preparation of the GDC fillers. (b) X-ray diffraction (XRD) pattern of pristine CeO2, Gd2O3, and different GDC fillers. (c) High-revolution TEM image and corresponding selected area electron diffraction (SAED) pattern (inset) of the GDC-10 filler. (d) EDS mapping images of the GDC-10 particles. (e) X-ray photoelectron spectroscopy (XPS) spectra of different GDC fillers and corresponding oxygen vacancy (Vo) concentration analysis.
The topography of the GDC materials were further investigated using transmission electron microscope (TEM) and selected area electron diffraction (SAED). The representative GDC-10 sample exhibits clear lattice fringe with a larger d-spacing of 0.33 nm (Fig. 1c), which corresponds to the (111) plane of CeO2. However, the d-pacing of GDC-10 is larger than that of pure CeO2 (0.31 nm, Fig. S2 in Supporting information), which is attributed to the enhanced ionic radius of Gd3+ compared with Ce4+, thereby leading to an expanded lattice volume. The corresponding energy dispersion spectroscopy (EDS) mapping demonstrates a uniform distribution of Gd element within GDC materials (Fig. 1d), further confirming the successful preparation of GDC materials.
Generally, the change in peak area ratio of Ce3+ 3d5/2 and 3d3/2 peaks in X-ray photoelectron spectra (XPS) reflects the concentration of oxygen vacancies [49,51]. Therefore, the oxygen vacancy concentrations of different GDC powders were quantitated using XPS measurements (Fig. 1e and Tables S1–S4 in Supporting information). Since the formation energy of oxygen vacancies on the surface of CeO2 is very low, oxygen atoms in the crystal lattice are easily released to react with other substances, thus generating oxygen defects. As a result, pristine CeO2 also presents a low surface oxygen vacancy concentration of 3.54%. Due to the requirement for lattice charge neutrality, the oxygen vacancy concentration increases with increasing the doping ratio of Gd. However, when the Gd doping ratio continuously increases to 20%, the oxygen vacancy concentration of GDC-20 instead decreases to 11.07%. Excessive Gd doping induces the migration of oxygen vacancies from the surface into the bulk of lattice. Meanwhile, unincorporated Gd2O3 loading on the GDC surface leads to the cover of surface oxygen vacancies, consistent with the XRD findings. Consequently, GDC-10 shows the highest interfacial oxygen vacancy concentration of 12.2%. This result demonstrates that appropriate doping level will promote more oxygen vacancies distributing on the surface of particles. Due to the positively charged nature, surface oxygen vacancies can promote the interactions with negatively charged anions, thereby facilitating the dissociation of Li salts, immobilizing the anions, and further increasing Li-ion transference number.
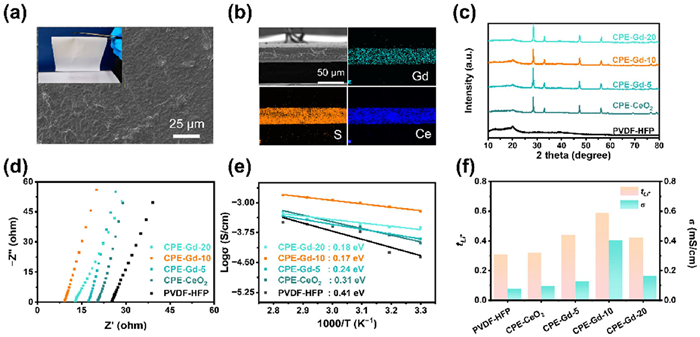
The PVDF-HFP/GDC composite electrolyte films were prepared by tape-casting method. The composite solid electrolytes with 10 wt% GDC fillers were also optimized (Fig. S3 in Supporting information). It can be seen that the introduction of GDC into PVDF-HFP matrices significantly improves the mechanical performance, showing compact structure and excellent flexibility (Fig. 2a and Fig. S4 in Supporting information). At the same time, the thickness of the electrolyte films is customized by regulating the thickness of the casting scraper, therefore, the composite electrolyte films with the thickness of 50 µm were obtained (Fig. 2b). EDS mapping images also demonstrate the uniform distribution of GDC within the composite electrolyte films. In comparison to the pristine PVDF-HFP electrolyte, the incorporation of GDC into PVDF-HFP matrix effectively reduces the crystallinity of the polymer. This reduction is evidenced by a decrease in the intensity of the diffraction peak at 20°, associated with the PVDF-HFP matrices (Fig. 2c), which is consistent with the formation of a compact morphology in the PVDF-HFP/GDC electrolyte films. Besides, the characteristic peaks corresponding to the GDC fillers exhibit negligible shifts, which implies excellent compatibility between the GDC fillers and the polymer phase.
Figure 2
Figure 2.
Properties of electrolyte films. (a) Scanning electron microscope (SEM) image of the CPE-Gd-10. Insert is the optical image. (b) Cross-sectional SEM images and corresponding EDS mapping images of the CPE-Gd-10. (c) XRD patterns of CPEs with different GDC fillers. (d) Nyquist plots of CPEs with different GDC fillers. (e) Temperature-dependent ionic conductivity of CPEs with different GDC fillers. (f) The comparison of the calculated transference number and ionic conductivity of CPEs with different GDC fillers.
The ionic conductivities of the PVDF-HFP/GDC composite solid electrolytes with various GDC concentrations are shown in Fig. 2d. It is well known that introducing inorganic fillers into polymer electrolyte matrices can significantly reduce the glass transition temperature of the polymers and promote Li-ion percolation along the interface between the fillers and the polymers [46]. All composite electrolytes exhibit markedly improved Li-ion conductivities compared to the pristine PVDF-HFP electrolyte. Moreover, the Li-ion conductivity of composite solid electrolytes increases with the increase of surface oxygen vacancy concentration of GDC filler. This trend aligns with the reduced glass transition temperature of the PVDF-HFP (Fig. S5 in Supporting information), indicating strong interactions between oxygen vacancies and polymer chains. Notably, the CPE-Gd-10 electrolyte achieves the highest Li-ion conductivity of 4.04 × 10⁻⁴ S/cm, which is 5.2 times higher than that of pristine PVDF-HFP electrolyte (7.8 × 10⁻⁵ S/cm). Moreover, a widened electrochemical window of 4.45 V is also observed for CPE-Gd-10 electrolyte (Fig. S6 in Supporting information). Electrochemical impedance spectroscopy (EIS) measurements at different temperatures and constant voltage polarization tests were also applied (Figs. 2e and f, Fig. S7 in Supporting information). The CPE-Gd-10 electrolyte demonstrates the lowest ion-migration activation energy of 0.17 eV and the highest Li+ transference number of 0.59. This enhancement is attributed to the presence of surface oxygen vacancies in the GDC fillers, which effectively immobilize the TFSI− anions of Li salts and thus prevent their movements. Additionally, these oxygen vacancies also interact with negatively charged fluorine (F) atoms in the PVDF-HFP chains, therefore decreasing the crystallinity of the polymer chains and facilitating Li-ion percolation transport.
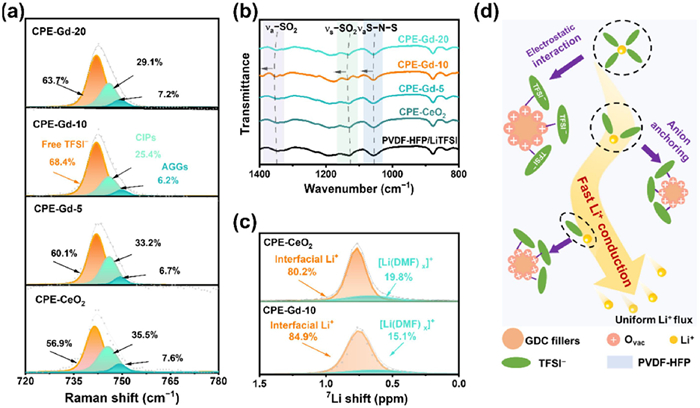
To clarify the effect of oxygen vacancies on Li-ion transport processes, Raman spectroscopy characterization was conducted to investigate the Li-ion coordination environments (Fig. 3a). The interactions between oxygen vacancies and TFSI− anions facilitate the dissociation of Li salts, resulting in significantly enhanced free TFSI− concentrations in the composite solid electrolytes. Moreover, the ratio of free TFSI− increases with increasing oxygen vacancy concentration. Consequently, CPE-Gd-10 electrolyte exhibits the highest ratio of free TFSI− (68.4%), indicating a high level of Li salt dissociation. On the contrary, the pristine PVDF-HFP electrolyte shows more contact ion pairs (CIPs) and Li-ion agglomerations (AGGs), which are ascribed to partially dissociated and undissociated Li salts [52]. The enhanced dissociation of Li salts contributes to an increased Li-ion carrier concentration, thereby promoting Li-ion transport.
Figure 3
Figure 3.
The understanding of the Li transport mechanism. (a) Raman spectra of CPEs with different GDC fillers. (b) FTIR spectra of CPEs with different GDC fillers. (c) 7Li NMR spectra of CPE-Gd-10 and CPE-CeO2. (d) Mechanism diagram of Li-ion transport in composite solid electrolyte.
Besides, Fourier transform infrared spectrometer (FTIR) spectra were utilized to further analyze the interactions between GDC fillers and Li salts (Fig. 3b, Fig. S8 and Table S5 in Supporting information). The peaks near 1346, 1131, and 1055 cm−1 correspond to the symmetric stretch mode of −SO2 (νsSO2), the antisymmetric stretch mode of −SO2 (νaSO2), and the antisymmetric stretch mode of S–N–S (νaSNS), respectively [53]. When Li+ decouples with TFSI−, the average electron cloud density of TFSI− increases [54], which thereby makes these peaks shift to higher wavenumber. It can be observed that the stretching peaks associated with TFSI− anions shift upwards with the increase of oxygen vacancy concentration, indicating that the existence of oxygen vacancies effectively promotes the dissociation of Li salts.
7Li solid-state nuclear magnetic resonance (NMR) spectroscopy was also performed to observe the Li-ion transport pathways in composite solid electrolytes (Fig. 3c). The peaks at a chemical shift of 0.6 ppm are attributed to solvated Li ions in polymer bulk, while the peaks at a chemical shift of 0.8 ppm correspond to Li ions at the interface between fillers and polymer matrices. It can be observed that the interfacial Li-ion species ratio increases with increasing the oxygen vacancy concentration of filler. Therefore, CPE-Gd-10 electrolyte shows a significantly improved interfacial Li-ion species of 84.9%. The interactions between positively charged oxygen vacancies and TFSI− anions can effectively promote the dissociation of Li salts, enhancing Li-ion carrier concentration. At the same time, interactions between fillers and polymers can induce a transformation of polymer chains from crystalline state to glassy state, thereby significantly facilitating Li-ion percolation along the filler/polymer interfaces. Consequently, the composite solid electrolytes exhibit significantly enhanced Li-ion transport compared to the pristine PVDF-HFP electrolyte (Fig. 3d). Notably, the surface oxygen vacancy concentration is limited by the surface area of fillers. Excessive doping of Gd into CeO2 can lead to the burying of vacancy by unincorporated Gd2O3.
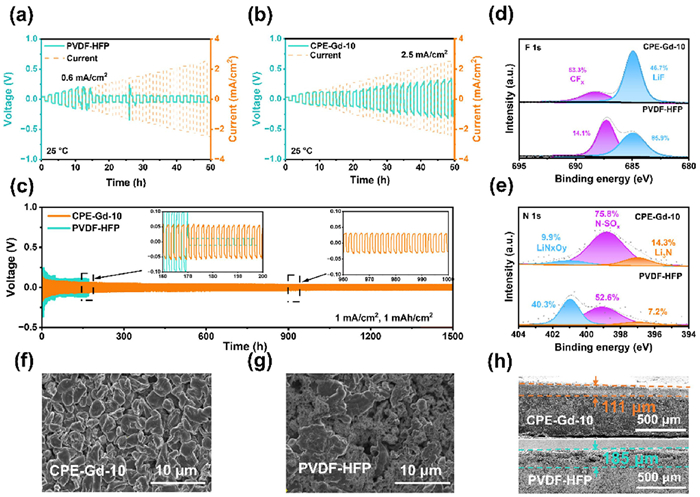
In order to investigate the compatibility of composite solid electrolytes with Li metal anode and the Li deposition behaviors underlying Li/electrolyte interface, Li||Li symmetric cells with different solid-state electrolyte films were fabricated. Figs. 4a and b show the critical current density (CCD) of Li||Li symmetric cells obtained by stepwise increasing the applied test current with a fixed step time. It can be observed that GPE-Gd-10 exhibits an enhanced CCD value of 2.5 mA/cm2, which is much higher than that of pristine PVDF-HFP electrolyte (0.6 mA/cm2), indicating an improved resistance to Li dendrite penetration. Moreover, Li||Li symmetric cell with GPE-Gd-10 also demonstrates a prolonged cycling life of over 2000 h at 0.1 mA/cm2, 0.1 mAh/cm2 (Fig. S9 in Supporting information). Under a harsh working condition of 1 mA/cm2 and 1 mAh/cm2, the cell still stably cycles for up to 1500 h with a reduced overpotential (Fig. 4c). This improvement is attributed to the immobilization of TFSI− anions by surface oxygen vacancies, which enhances the Li-ion transference number and effectively reduces the concentration polarization of anions on Li anode surface. Meanwhile, the interactions between oxygen vacancies and polymer also contribute to the softening of polymer matrix and facilitate rapid Li-ion interface percolation, significantly uniformizing Li-ion flux and promoting homogenous Li deposition.
Figure 4
Figure 4.
Electrochemical performances and Li deposition behaviors. CCD test of the Li||Li symmetrical cells with (a) pristine PVDF-HFP and (b) CPE-Gd-10 electrolytes. (c) Cycling performance of the Li||Li symmetrical cells with pristine PVDF-HFP and CPE-Gd-10 electrolytes. High-revolution (d) F 1s and (e) N 1s XPS spectra of cycled Li anodes with CPE-Gd-10 and pristine PVDF-HFP electrolytes. Surface SEM images of cycled Li anodes with (f) CPE-Gd-10 and (g) pristine PVDF-HFP electrolytes. (h) Cross-section SEM images of cycled Li anodes with CPE-Gd-10 and pristine PVDF-HFP electrolytes.
XPS measurement was further carried out to analyze the composition of the solid electrolyte interphase (SEI) on the surface of Li anode after cycling. The peaks observed at 685.2 eV in the F 1s spectra and at 397.0 eV (Fig. 4d) in the N 1s spectra (Fig. 4e) correspond to inorganic components such as LiF and Li3N within the SEI [55,56]. Notably, the cycled Li anode in the CPE-Gd-10 electrolyte shows a significantly higher concentration of these inorganic components (Fig. S10 in Supporting information) [57,58]. In contrast, the pristine PVDF-HFP electrolyte promotes the formation of more organic components on the Li anode surface. The increased presence of inorganic components in the SEI, attributed to the enhanced Li-ion conductivity and improved mechanical properties, facilitates more uniform Li deposition and effectively inhibits the growth of Li dendrites. As a result, the cycled Li anode in the GPE-Gd-10 electrolyte exhibits a flat and smooth morphology (Fig. 4f) with a compact and thin deposited Li layer. Whereas the Li anode cycled in the pristine PVDF-HFP electrolyte displays mossy Li deposition (Fig. 4g) with a loose, thick "dead Li" layer (Fig. 4h).
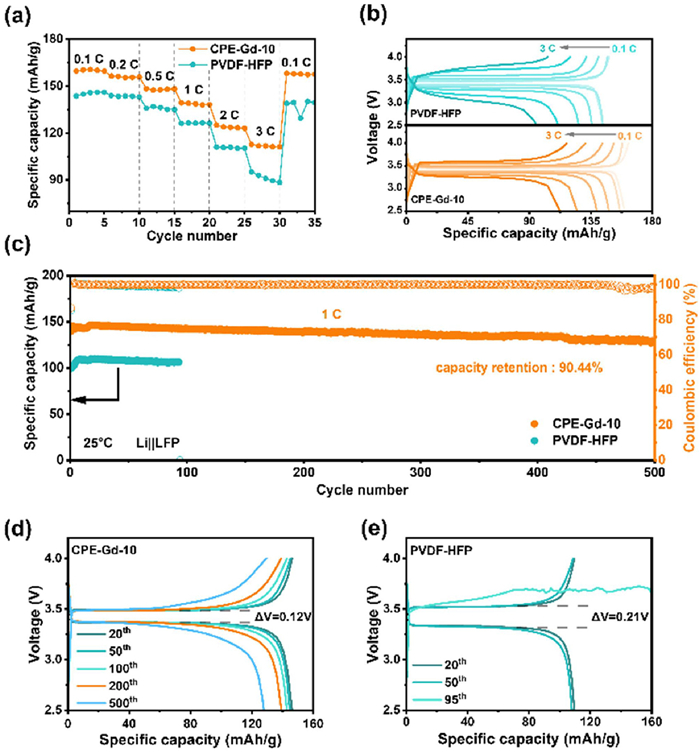
Li||LFP full cells were also assembled to evaluate the practical application potentials of CPE-Gd-10 electrolyte. As shown in Fig. 5a, the cells with CPE-Gd-10 deliver discharge capacities of 159.5, 155.6, 147.7, 140.7, 125.6, and 113.0 mAh/g at rates of 0.1, 0.2, 0.5, 1, 2, and 3 C, respectively. When the applied current turns back from 3 C to 1 C, the CPE-Gd-10 cell still maintains a discharging capacity of 157.4 mAh/g, which demonstrates improved interface kinetics. By contrast, the cell with pristine PVDF-HFP electrolyte exhibits reduced discharging capacities of 145.8, 143.6, 134.8, 126.7, 111.0, and 88.6 mAh/g at rates of 0.1, 0.2, 0.5, 1, 2, and 3 C, respectively. When the current density returns from 3 C to 1 C, a significant decrease in discharge capacity and noticeable capacity fluctuation are observed. This fluctuation is attributed to Li dendrite growth within PVDF-HFP electrolyte layer. Besides, the cell with CPE-Gd-10 also demonstrates reduced voltage polarization due to enhanced Li-ion conductivity and Li-ion transference number (Fig. 5b). Long-term cycling performance (Fig. S11 in Supporting information) was also investigated to reveal the performance of electrolytes in practical applications. As illustrated in Figs. 5c-e, the Li|CPE-Gd-10|LFP cell delivers a significantly enhanced initial discharge capacity of 146.5 mAh/g and a high retention ratio of 90.4% after over 500 cycles at 1 C. In comparison, the cell with the pristine PVDF-HFP electrolyte shows a lower initial discharge capacity of 106.2 mAh/g with increased overpotential. Moreover, shortened cycling life and sudden fluctuation in Coulombic efficiency after 80 cycles, indicating the interface instability and Li dendrite growth.
Figure 5
Figure 5.
Full cell evaluation. (a) Rate performances and (b) corresponding voltage profiles of the Li||LFP full cells with pristine PVDF-HFP and CPE-Gd-10 electrolytes. (c) Cycling performances of the Li||LFP full cells at 1 C. Corresponding voltage profiles of the Li||LFP full cells with (d) CPE-Gd-10 and (e) pristine PVDF-HFP electrolytes.
Oxygen vacancies on the surface of fillers, which act as positively charged sites, can interact with negatively charged anions of Li salts. This interaction not only promotes the dissociation of Li salts but also immobilizes anions and enhances Li-ion transference number. Moreover, the addition of the fillers with sufficient oxygen vacancies can also reduce the crystalline of polymer chains, thereby facilitating rapid Li-ion percolation along the filler/polymer interface. Therefore, increasing the oxygen vacancy concentration on the surface of fillers effectively promotes uniform Li plating and mitigates Li dendrite growth. However, the concentration of surface oxygen vacancies is limited by the available surface areas of fillers. Although element doping can effectively enhance the concentration of surface oxygen vacancies, it is worth noting that excessive element doping does not always increase the vacancy concentration. Instead, it may lead to a decrease in vacancy concentration due to the migration of vacancies from surface into lattice bulk and the potential coverage of vacancies by impurities.
In summary, functional fillers with abundant oxygen vacancies were successfully synthesized by precisely regulating the doping ratio of Gd into CeO2. The substitution of Gd3+ for Ce4+ in CeO2 effectively promotes the generation of oxygen defects through the charge compensation. When GDC-10 filler, containing the highest oxygen vacancy concentration of 12.2%, was incorporated into PVDF-HFP matric, the resulting CPE-GDC-10 electrolyte exhibits enhanced ionic conductivity (0.40 mS/cm) and a significantly increased Li-ion transference number (0.59). On the one hand, the positively charged oxygen vacancies can effectively interact negatively charged anions in electrolytes, which not only promotes the dissociation of Li salts but also inhibits the migration of free anions. On the other hand, the Lewis acid-base interactions between oxygen-deficient GDC fillers and PVDF-HFP polymer chains also reduce the crystallinity of the polymer, facilitating rapid Li-ion conduction along the filler/polymer interface. As a result, the oxygen-deficient GDC fillers can uniformly distribute the Li-ion flux and decrease the concentration polarization, significantly suppressing Li dendrite growth. Li||Li symmetric cells show prolonged cycling stability of over 1500 h with uniform Li plating. Li||LFP full cell with CPE-GDC-10 delivers a high initial discharge capacity of 146.5 mAh/g and maintains an enhanced capacity retention of 90.4% after 500 cycles. This work presents a promising strategy for designing functional organic-inorganic composite solid electrolytes for high-performance SSLMBs.
Declaration of competing interest
The authors declare that they have no known competing financial interests or personal relationships that could have appeared to influence the work reported in this paper.
CRediT authorship contribution statement
Zi-Hao Zuo: Writing – original draft, Investigation, Data curation. Jiang-Kui Hu: Investigation, Data curation. Xi-Long Wang: Investigation, Data curation. Shi-Jie Yang: Investigation, Data curation. Wei-Qi Mai: Writing – review & editing, Investigation, Data curation. Yao-Hui Zhu: Writing – review & editing, Investigation, Data curation. Zheng Liao: Writing – review & editing, Investigation, Data curation. Jia Liu: Writing – review & editing, Supervision, Methodology, Funding acquisition. Hong Yuan: Writing – review & editing, Supervision, Methodology, Funding acquisition, Conceptualization. Jia-Qi Huang: Writing – review & editing, Supervision, Methodology, Funding acquisition, Conceptualization.
Acknowledgments
This work is funded by the Beijing Municipal Natural Science Foundation (No. L223009), the National Natural Science Foundation of China (Nos. 22075029, 22209014, 22479012), the National Key Research and Development Program (No. 2021YFB2500300), the Key Research and Development (R&D) Projects of Shanxi Province (No. 2021020660301013), the Hebei Natural Science Foundation (No. E2024208084), and the Fundamental Research Funds for the Central Universities (No. 2023CX01031).
Supplementary materials
Supplementary material associated with this article can be found, in the online version, at doi:10.1016/j.cclet.2025.110851.
[1]
J. Liu, M. Yue, S. Wang, Y. Zhao, J. Zhang, Adv. Funct. Mater. 32 (2022) 2107769. doi: 10.1002/adfm.202107769
Figure 1
Preparation and characterization of the GDC fillers. (a) Schematic illustration of the preparation of the GDC fillers. (b) X-ray diffraction (XRD) pattern of pristine CeO2, Gd2O3, and different GDC fillers. (c) High-revolution TEM image and corresponding selected area electron diffraction (SAED) pattern (inset) of the GDC-10 filler. (d) EDS mapping images of the GDC-10 particles. (e) X-ray photoelectron spectroscopy (XPS) spectra of different GDC fillers and corresponding oxygen vacancy (Vo) concentration analysis.
Figure 2
Properties of electrolyte films. (a) Scanning electron microscope (SEM) image of the CPE-Gd-10. Insert is the optical image. (b) Cross-sectional SEM images and corresponding EDS mapping images of the CPE-Gd-10. (c) XRD patterns of CPEs with different GDC fillers. (d) Nyquist plots of CPEs with different GDC fillers. (e) Temperature-dependent ionic conductivity of CPEs with different GDC fillers. (f) The comparison of the calculated transference number and ionic conductivity of CPEs with different GDC fillers.
Figure 3
The understanding of the Li transport mechanism. (a) Raman spectra of CPEs with different GDC fillers. (b) FTIR spectra of CPEs with different GDC fillers. (c) 7Li NMR spectra of CPE-Gd-10 and CPE-CeO2. (d) Mechanism diagram of Li-ion transport in composite solid electrolyte.
Figure 4
Electrochemical performances and Li deposition behaviors. CCD test of the Li||Li symmetrical cells with (a) pristine PVDF-HFP and (b) CPE-Gd-10 electrolytes. (c) Cycling performance of the Li||Li symmetrical cells with pristine PVDF-HFP and CPE-Gd-10 electrolytes. High-revolution (d) F 1s and (e) N 1s XPS spectra of cycled Li anodes with CPE-Gd-10 and pristine PVDF-HFP electrolytes. Surface SEM images of cycled Li anodes with (f) CPE-Gd-10 and (g) pristine PVDF-HFP electrolytes. (h) Cross-section SEM images of cycled Li anodes with CPE-Gd-10 and pristine PVDF-HFP electrolytes.
Figure 5
Full cell evaluation. (a) Rate performances and (b) corresponding voltage profiles of the Li||LFP full cells with pristine PVDF-HFP and CPE-Gd-10 electrolytes. (c) Cycling performances of the Li||LFP full cells at 1 C. Corresponding voltage profiles of the Li||LFP full cells with (d) CPE-Gd-10 and (e) pristine PVDF-HFP electrolytes.

 DownLoad:

 下载:
下载:


 下载:
下载:
