Received Date:
01 November 2024 Accepted Date:
20 December 2024 Revised Date:
16 December 2024 Available Online:
15 April 2026
Abstract:
The application of commercial hard carbon (HC) materials in sodium-ion batteries (SIBs) is limited by their inferior rate capability (<5.0 A/g) and low tap density (<1.0 g/cm3). Alloying-type bismuth (Bi) offers a high theoretical volumetric capacity of 3800 mAh/cm3 and superb rate capability but suffers from large volume expansion (~244%) and undesirable structural pulverization. Herein, a hectogram-scale Bi-inlaid carbon skeleton (GC-Bi) composite was synthesized through a facile precipitation-carbonization method using low-cost industrial-grade chemical reagents. The as-prepared GC-Bi composite features a unique particle-nested-bulk architecture, achieving a high tap-density of 3.33 g/cm3, which is approximately 4.16 times greater than that of commercial HC. Besides, the carbon sheath enhances the electronic conductivity and accommodates the substantial volume swelling of the embedded Bi particles, contributing to the formation of a thin and stable solid electrolyte interface on the electrode. Consequently, the GC-Bi anode achieves a high volumetric capacity (1123 mAh/cm3), impressive rate capability (207.8 mAh/g at 80 A/g), together with long cyclability retaining 96.5% of its capacity after 5000 cycles in a Na//GC-Bi half-cell and 78% after 800 cycles in a GC-Bi//Na3V2(PO4)3 full-cell.
In light of the ever-increasing demand for electric vehicles and large-scale energy storage, the exploration of high-capacity and fast-charging electrode materials for sodium-ion batteries (SIBs) has become paramount [1-5]. SIBs have garnered attention as promising alternatives to lithium-ion batteries (LIBs) due to the abundant and cost-effective availability of sodium resources [6-9]. In this regard, framework-type SIB cathodes, such as NASICON-type Na3V2(PO4)3 and O3-type NaCrO2 have made significant strides in achieving remarkable rate performance and cycling stability. However, the development of high-rate-matching anodes remains crucial for the widespread application of high-performance SIBs [10-16]. Conventional hard carbon (HC) anodes, despite their exceptional cycling stability, generally suffer from low tap density (<1.0 g/cm3) and limited rate capability (generally <5.0 A/g) [17-19]. Furthermore, the low Na+ intercalation potential (<0.1 V) of HC increases the risk of Na-dendrite formation, particularly at high current densities, rendering it unsuitable for fast-charging SIB applications [7,20]. Among potential anode candidates, bismuth (Bi) stands out owing to its relatively high theoretical capacity of 385 mAh/g and especially ultra-high volumetric capacity of 3800 mAh/cm3 due to its great inherent density, which is approximately ten times higher than that of HC-based anodes [21,22]. Additionally, Bi also possesses a moderate reaction potential of 0.5‒0.8 V vs. Na/Na+, reducing the likelihood of Na-dendrite formation, and is both resource-rich and environmental-friendly [23]. However, the significant volume expansion (~244%) of Bi-based anodes is prone to irreversible structural evolution and pulverization during cycling, which causes dramatic capacity decay and eventual cell failure [24].
Efforts to decouple the mechanical effects of the Bi-based materials during cell cycling have focused on strategies such as nanosizing engineering, multi-dimensional structure design, and compositing with carbon, which have been developed as efficient stress-resilient strategies to relieve the volume swelling of Bi [25]. For instance, Liang et al. synthesized B-doped Bi interconnected nanoparticles anode with a stable solid electrolyte interface (SEI) layer, achieving a high capacity of 328.7 mAh/g after 5000 cycles at 5.0 A/g [26]. Further advancements include the development of a 3D continuous porous bismuth anode for advanced SIBs, which demonstrated an unprecedented capacity retention of 95.6% at the rate of 60 A/g [27]. Additionally, commercial bulk Bi has shown ultra-high rate capabilities at 200 C (1 C = 385 mA/g) and long cycling stability over 3000 cycles at 20 C in an ether electrolyte system [28]. Nevertheless, both nanostructured, morphology modulated, and bulk Bi-based materials tend to undergo structural destruction and spontaneously reconfigure into a porous-like structure during extended cycling, leading to electrode rupture and pulverization. This process also causes repeated crushing and reformation of unevenly thick SEI on the newly exposed particle surfaces [29]. More importantly, research on structure-engineered Bi-based anodes is largely confined in laboratory-scale studies, often overlooking the product yield and actual tap density, which is a key parameter for achieving high volumetric energy density SIBs [30,31]. These studies typically require stringent experimental controls or expensive chemical reagents, making large-scale production impractical (Tables S1 and S2 in Supporting information). To this end, it remains vital and challenging to develop a viable scalable synthesis approach of Bi-based anodes with high volumetric capacity that are compatible with fast-charging and structural stability.
Herein, a micro-scale particle-nested-bulk structure, characterizing numerous Bi particles embedded in glucose-derived carbon skeleton (GC-Bi), was developed through a scalable and cost-effective precipitation-carbonization method. The resulted bulk GC-Bi composite exhibits a low specific surface area of 69.05 m2/g, an average pore diameter of 5.61 nm, and a high tap density of 3.33 g/cm3, enabling it a competitive candidate for volume-sensitive applications. Besides, the external bulk carbon sheath effectively buffers the volumetric strain generated by the inner Bi particles during sodiation/desodiation and hence constructs a stable SEI layer on the electrode surface. Benefiting from the structural integrity, the as-prepared GC-Bi anode showcases a fast-charging capability of 207.8 mAh/g at 80 A/g (discharge/charge time in 9 s), long service life with a high capacity retention of 96.5% at 5.0 A/g after 5000 cycles, as well as a record high volumetric capacity over 1100 mAh/cm3, surpassing many previously reported Bi-based anodes in SIBs [27,32]. Moreover, a full cell configuration assembled by pairing the GC-Bi anode with a Na3V2(PO4)3 (NVP) cathode delivers an energy density of 203.8 Wh/kg and a high-power density of 2671.6 W/kg, showing the great promise of GC-Bi for future practical applications.
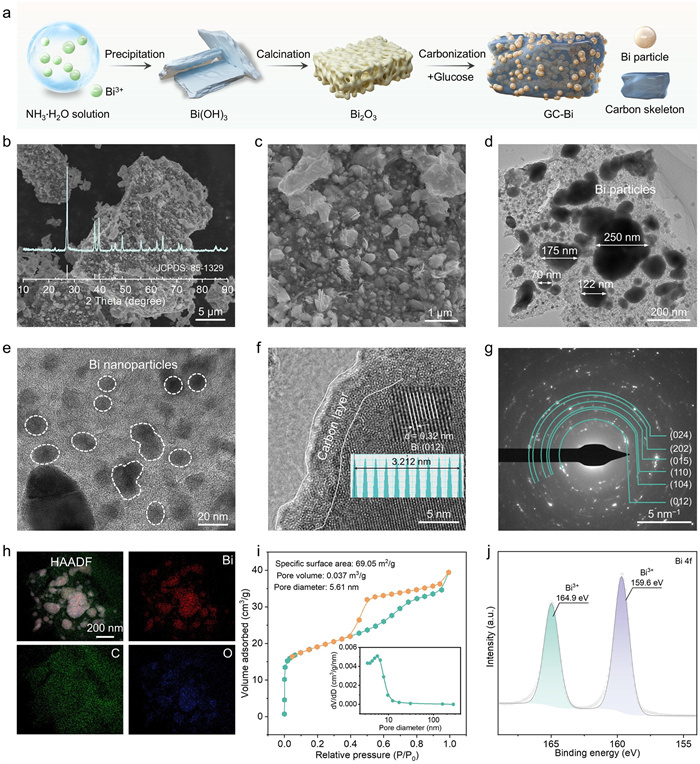
The synthesis schematic of GC-Bi composite is illustrated in Fig. 1. The microstructure and phase characteristics of the samples were analyzed using field emission scanning electron microscopy (FE-SEM), X-ray diffraction (XRD), and transmission electron microscopy (TEM). Initially, Bi(NO3)3·5H2O served as the Bi source, leading to the formation of white Bi(OH)3 precipitation with an irregular lamellar structure through Bi3+ hydrolysis in an aqueous ammonia solution. Upon calcination in air, Bi(OH)3 dehydrates and decomposes to form a closely connected Bi2O3 framework (Fig. S1 in Supporting information). Subsequently, glucose was employed as a carbon source, ground with the as-prepared Bi2O3, and carbonized to produce a hectogram-scale bulk GC-Bi composite with an overall particle size ranging from 5 µm to 20 µm (Figs. 1b and c, Fig. S2 in Supporting information). The XRD pattern inset in Fig. 1b reveals sharp characteristic peaks indicating the complete transformation of Bi2O3 to hexagonal Bi phase (JCPDS No. 85‒1329). TEM images illustrate that Bi particles, measuring tens to hundreds of nanometers, are irregularly inlaid within the bulk carbon skeleton (Figs. 1d and e). As exhibited in Fig. 1f, the high-resolution TEM (HRTEM) image displays a highly ordered lattice fringe with a d-spacing of 0.32 nm, which can be indexed to the (012) plane of the Bi phase. The selected area electron diffraction (SAED) pattern reveals diffraction rings associated with the (012), (104), (110), (015), (202), and (024) planes of hexagonal metallic Bi (Fig. 1g). The high-angle annular dark-filed scanning TEM (HAADF-STEM) image, along with energy dispersive spectroscopy (EDS) elemental mappings, clearly demonstrate the uniform distribution of Bi, C, and O elements, consistent with the particle shape (Fig. 1h). Nitrogen adsorption-desorption analysis indicates that the GC-Bi composite has a specific surface area of 69.05 m2/g, an average pore diameter of 5.61 nm, and a pore volume of 0.037 m3/g (Fig. 1i). Besides, compared to commercially available Type-1 HC (0.8 g/cm3), most previously reported Bi-based anodes, and other anode materials, the GC-Bi powder showcases a higher tap-density of 3.33 g/cm3, making it more competitive for volume-sensitive applications (Fig. S3 and Table S3 in Supporting information). A sharp peak at 309 cm−1 presented in Raman spectrum represents the characteristic Bi-O bond, while two broad peaks at 1344 and 1598 cm−1 are assigned to disordered defective carbon (D band) and ordered graphitic carbon (G band), respectively [33,34]. The calculated intensity ratio of ID to IG is 0.84, indicating the highly graphitized nature of the carbon matrix in GC-Bi composite (Fig. S4a in Supporting information). High-resolution X-ray photoelectron spectroscopy (XPS) spectra show peaks for oxidized Bi (164.9 and 159.6 eV) in the Bi 4f spectrum and a Bi-O-C bond (531.2 eV) in the O 1s spectrum, suggesting mutual bonding between Bi, O, and C in the GC-Bi composite, which contributes to the stabilization of the nested Bi particles and ensures the structural integrity (Fig. 1j and Figs. S4b-d in Supporting information) [35]. According to the thermogravimetric analysis (TGA) result, the Bi content in the GC-Bi composite is calculated to be 82.8% (Fig. S5 in Supporting information).
Figure 1
Figure 1.
Morphological structure characterizations of GC-Bi composite. (a) Schematic illustration of the synthesis process of GC-Bi composite. (b) SEM image and XRD pattern. (c) A zoom-in SEM image of (b). (d, e) TEM images. (f) HR-TEM image. (g) SAED pattern. (h) STEM-EDS mappings. (i) N2 adsorption-desorption isotherms and pore size distribution. (j) Bi 4f high-resolution XPS spectrum.
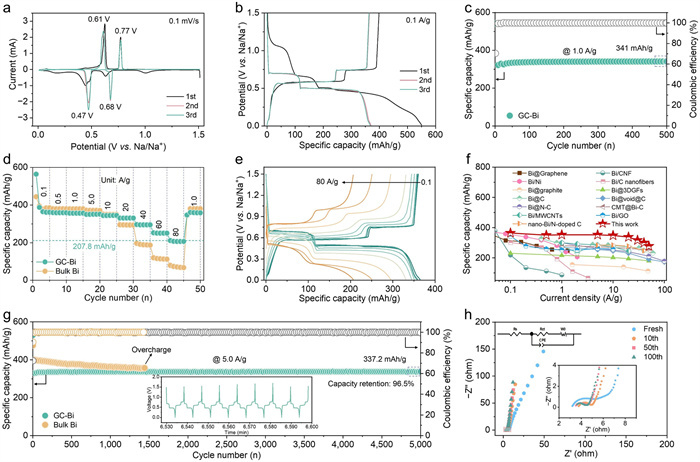
The electrochemical Na+ ion storage performance of the GC-Bi anode was evaluated by assembling Na//GC-Bi half cells, operating within a voltage range of 0.01−1.5 V. Representative cyclic voltammetry (CV) curves at a scan rate of 0.1 mV/s uncover reduction peaks at around 1.0 and 0.63 V, observed only during the initial cathodic scan. These peaks are linked to the decomposition of the electrolyte and the establishment of the solid electrolyte interface (SEI) film, and some irreversible sodiation reactions [36]. Two pairs of sharp redox peaks at 0.68/0.77 and 0.47/0.67 V correspond to the stepwise reactions of Bi ↔ NaBi, and NaBi ↔ Na3Bi, respectively (Fig. 2a) [37]. The initial three cycles of galvanostatic charge-discharge (GCD) profiles for the GC-Bi electrode show a discharge/charge capacity of 550/398 mAh/g, resulting in an initial Coulombic efficiency (ICE) of 72.4%. Furthermore, the overlapping curves in the second and third cycles indicate favorable reversibility of the electrode reactions (Fig. 2b). Besides, the flat charge/discharge plateaus in GCD profiles align well with the redox behavior observed in the CV results. The cycling performance of GC-Bi demonstrates a capacity retention of 96.6%, maintaining 341 mAh/g after 500 cycles at 1.0 A/g (Fig. 2c). For comparison, commercial bulk Bi was purchased for high-rate properties and cycling durability evaluation. The rate capabilities of both electrodes were assessed across a wide range of current densities from 0.1 A/g to 80 A/g. As depicted in Fig. 2d, the GC-Bi anode achieves reversible specific capacities of 356.5, 350.8, and 344.4 mAh/g at current densities of 1.0, 5.0, and 10 A/g, respectively. Even at a high current density of 80 A/g (corresponding to a charge/discharge time of only 9.0 s), the GC-Bi electrode still provides an impressive discharge capacity of 207.8 mAh/g with a good rate capacity retention of 56% with respect to 0.1 A/g. The distinct charge-discharge plateaus in the GCD curves at various current densities suggest low polarization and rapid sodiation/desodiation dynamics of GC-Bi anode (Fig. 2e). In contrast, the bulk Bi anode achieves relatively high capacities at low current densities of 0.1‒5.0 A/g (Fig. S6 in Supporting information). However, as the current rate increases from 10 A/g to 80 A/g, the capacity retention significantly decreases from 90.8% to 18% compared to 0.1 A/g (Fig. S7 in Supporting information). This decline is likely due to the absence of carbon scaffold protection for the bulk Bi, leading to structural degradation during the sodiation/desodiation process. To the best of our knowledge, the GC-Bi electrode exhibits excellent rate capability compared to the other high-performance Bi-based anodes for SIBs [7,33,38-48], offering the potential for fast-charging requirements (Fig. 2f).
Figure 2
Figure 2.
Electrochemical performance characterizations of the GC-Bi composite for SIBs. (a) CV curves at a scan rate of 0.1 mV/s between 0.01 V and 1.5 V. (b) Initial three cycles GCD curves at 0.1 A/g. (c) Cycling performance at 1.0 A/g. (d) Rate performance of GC-Bi composite and bulk Bi. (e) GCD profiles of GC-Bi anode at the current densities varying from 0.1 A/g to 80 A/g. (f) Rate capability comparison with previously reported Bi-based anodes for SIBs. (g) Long-term cycling performance at 5.0 A/g. (h) Nyquist plots after different charge-discharge cycles (the inset shows the equivalent circuit model used to fit the obtained EIS spectra, where Rs, Rct, CPE, and Wo represent interfacial layer impedance, charge transfer impedance, constant-phase element, and Warburg solid-state diffusion resistance, respectively).
To further explore the potential of the GC-Bi electrode, its long-term cycling performance was evaluated, revealing a stable reversible discharge capacity of 337.2 mAh/g after 5000 cycles, with a high capacity retention of 96.5% (Fig. 2g). In contrast, the bulk Bi electrode exhibits a gradual decline in capacity, achieving lower capacity retention of 83% after 1440 cycles, follows by a short circuit failure likely due to its poor mechanical and interfacial stability (Fig. S8 in Supporting information). To investigate this, the cycled Na//bulk Bi and Na//GC-Bi half cells were disassembled to examine the electrode condition. As depicted in Fig. S9 (Supporting information), the top-view SEM images reveal that the electrode surface of the short-circuited Na//bulk Bi cell at the 1440th displays visible cracks and exfoliation of active materials. Conversely, the sodiated GC-Bi electrode maintained a smooth and flat surface after 5000 cycles, which helps prevent material detachment. Electrochemical impedance spectroscopy (EIS) was employed to assess the interfacial charge transfer resistance and diffusion kinetics. The Nyquist plots of the GC-Bi electrode after various cycles (Fig. 2h) feature a semicircle in the high-medium frequency region corresponding to the charge transfer impedance (Rct) and a sloped line in the low frequency region related to the Na+ ions diffusion. According to the fitting results as listed in Table S4 (Supporting information), the GC-Bi electrode exhibits a decrease in Rct after 10 cycles, stabilizing at a low value of 0.718 Ω after 100 cycles, indicating excellent charge transfer capability. Additionally, the Warburg factor (σ) derived from the slop of the Z′-ω−1/2 in the low frequency region, is used to evaluate the Na+ ions diffusion kinetics. The results illustrate a high σ value of 46.3 for the fresh GC-Bi electrode, which declines remarkably after the first 10 cycles and remains relatively stable from the 50th to 100th cycle. This demonstrates that the GC-Bi electrode maintains well-established interfacial stability throughout the cycling process (Fig. S10 in Supporting information).
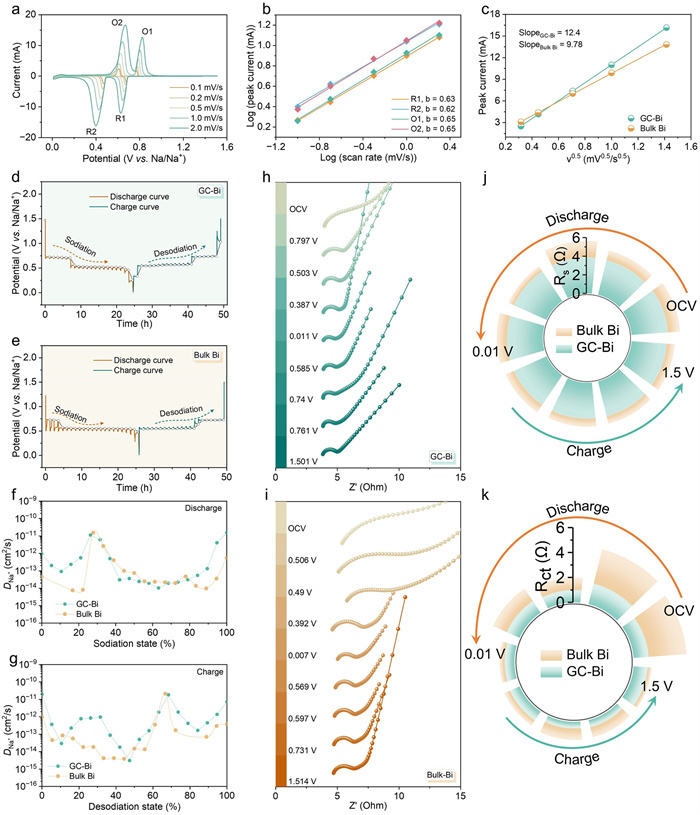
To elucidate the mechanism underlying the exceptional rate performance of the GC-Bi electrode, a multi-CV measurement at varying scan rates was initially performed to analyze the kinetic behavior of GC-Bi and bulk Bi. Previous studies have established a relationship between the peak current (i) and sweep rate (v), expressed by the equation i = avb. In this context, a b-value of approximately 0.5 indicates a diffusion-controlled process, while a value of around 1.0 suggests surface capacitance. The observed increase in peak current for both oxidation and reduction peaks correlates positively with the scan rates. Meanwhile, the fitting results indicate that the b-values for the GC-Bi electrode are around 0.6, whereas those for bulk Bi are approximately 0.5 (Figs. 3a and b, Fig. S11 in Supporting information). This suggests that the sodium storage electrochemical process of both samples is primarily governed by the diffusion of Na+ ions within the bulk phase of Bi [49]. The Na+ ions diffusion coefficient (DNa+) can be determined according to the following Randles−Sevcik equation [50,51]:
ip=2.69×10⁵ACNaDNa1/2n3/2v1/2
(1)
Figure 3
Figure 3.
Na+ ions diffusion kinetics analysis. (a) Multi-CV curves of the GC-Bi anode at different scan rates of 0.1, 0.2, 0.5, 1.0, and 2.0 mV/s. (b) Relationship between the peak currents and scan rates in logarithmic format of the GC-Bi. (c) Peak current vs. v1/2 plots and corresponding linear fitting results of GC-Bi and bulk Bi electrodes. GITT curves of the (d) GC-Bi and (e) bulk Bi electrodes under the current density of 0.1 A/g, in which the cells were alternatively discharged/charged for a duration of 10 min and allowed to stand for 60 min. The calculated Na+ ions diffusion coefficient of (f) GC-Bi and (g) bulk Bi electrodes. In-situ EIS of (h) GC-Bi and (i) bulk Bi electrodes during the initial discharge-charge process. The evolution of (j) Rs and (k) Rct for GC-Bi and bulk Bi electrodes.
where the slope of the linear fit between ip and v1/2 positively correlated with DNa+. Notably, the slope of the GC-Bi is 1.27 times greater than that for bulk Bi, indicating a much higher DNa+ for the GC-Bi electrode (Fig. 3c). Additionally, the galvanostatic intermittent titration technique (GITT) was employed to further inquire into the electrode reaction kinetics at different stages (Figs. 3d and e). Both GC-Bi and bulk Bi anodes underwent alternating discharge/charge cycles under a 10-min current pulse, followed by a 60-min relaxation to reach a quasi-equilibrium potential [52]. The testing setup and calculation formula are detailed in Fig. S12 (Supporting information). Obviously, the GC-Bi electrode consistently exhibits small overpotentials throughout the entire sodiation and desodiation process, with an average Na+ ions diffusion coefficient of 2.36×10⁻¹² cm2/s. This value result is approximately ten times greater than that obtained for bulk Bi, which is 2.03×10⁻¹³ cm2/s (Figs. 3f and g), implying a higher diffusion rate in the particle-nested-bulk architecture constructed by GC-Bi active materials.
The investigation of Na+ ions diffusion kinetics within the bulk phase, alongside the dynamic evolution of interfacial charge transfer and SEI layer resistance in GC-Bi and bulk Bi, was conducted using in-situ EIS (Fig. S13, Tables S5 and S6 in Supporting information). As displayed in Figs. 3h and i, the Nyquist plots for both GC-Bi and the control sample display a semi-circle and an inclined line. Typically, the semi-circles at high (~105 Hz) and medium (~103 Hz) frequencies correspond to the interfacial layer impedance (Rs) and Rct, respectively [53]. The evolutionary trends of Rs and Rct are fitted and represented in the radial stacked bar diagrams (Figs. 3j and k). For GC-Bi, the Rs exhibits minimal variation, despite the formation of the SEI layer during the initial discharge-charge process, decreasing slightly from 3.93 Ω at the open-circuit state to 3.79 Ω at the fully desodiated stage. This stability suggests that no fresh SEI continues to form. In contrast, the Rs of bulk Bi initially increases and then decreases in the first cycle, indicating the repeated growth and dissolution of the SEI throughout the electrochemical process. Furthermore, GC-Bi demonstrates a consistently lower Rct compared to bulk Bi during the entire discharging and charging process, suggesting enhanced electrochemical reaction kinetics. The low and stable Rs and Rct in the GC-Bi electrode contribute to a sustainably stable SEI on the electrode surface and improve the interfacial charge transfer kinetics.
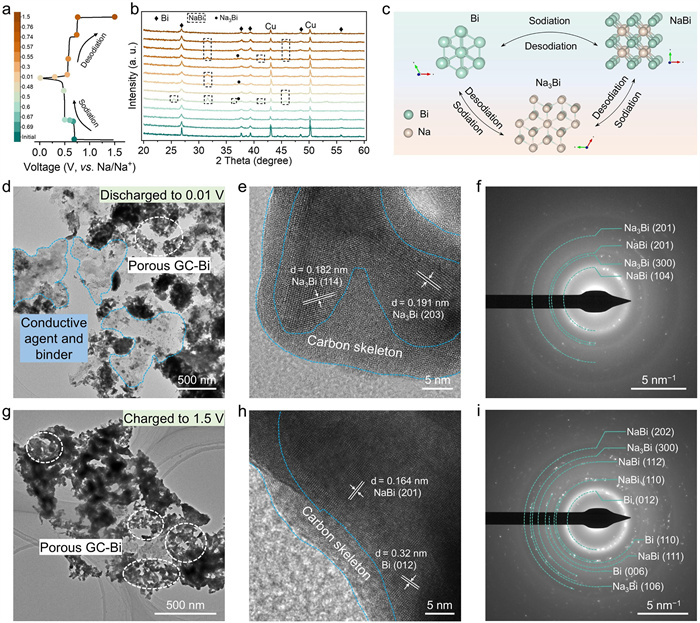
The sodium storage mechanism of GC-Bi electrode was performed by ex-situ XRD technique during the second cycle. The GCD curves and corresponding XRD patterns are presented in Figs. 4a and b. Initially, before discharge, diffraction peaks from the unreacted Bi phase and Cu current foil are detected. As the discharge process progresses, the peak intensity of Bi gradually decreases. At 0.5 V, characteristic peaks of NaBi (25.5°, 31.6°, 36.5°, 41.2°, and 45.8°) emerge, indicating the alloying reaction of Bi → NaBi. With further Na+ ions insertion, the characteristic peaks of NaBi diminish, and a newly emerged Na3Bi (37.1°) phase appears from 0.5 V to 0.01 V, due to the continued alloying of NaBi and Na. During the subsequent charging process, as the anode is charged back to 0.74 V, the Na3Bi peak intensity declines, and NaBi peak reappears. Upon completion of the charge process, peaks indexing to the pure Bi phase are observed, similar to the fresh state. These results demonstrate the reversible redox chemistry of GC-Bi (Fig. 4c). To further elucidate the electrochemical reactions of GC-Bi electrode, TEM technique was employed at the final stages of sodiation/desodiation process during the first cycle. When discharged to 0.01 V, the Bi particles expand to occupy the bulk-shaped carbon, transforming from granular structures to porous networks. Mention that the relatively thin area circled by the blue dashed line represents conductive additives and binders (Fig. 4d and Fig. S14 in Supporting information). The HRTEM image reveals distinct lattice fringes of 0.182 nm and 0.191 nm, corresponding to the (114) and (203) planes of Na3Bi, respectively (Fig. 4e). Besides, the diffraction rings observed in the SAED pattern can be ascribed to NaBi and Na3Bi phase (Fig. 4f). After fully-charged to 1.5 V, Na3Bi gradually de-alloys to form Bi phase, which is accompanied by volume shrinkage and the emergence of a few voids within the GC-Bi composite. The TEM image confirms that the porous structure remains intact, proving that the carbon skeleton is sufficiently robust to accommodate the volume changes of the Bi phase. Besides the corresponding EDS mappings illustrate a homogenous elemental distribution of C, O, F, and Na in the outer layer of Bi (Fig. 4g and Fig. S15 in Supporting information). This suggests that the localized stresses from Bi during the alloying/dealloying process are efficiently transferred to the surrounding carbon, stabilizing the structure and alleviating volume expansion. Meanwhile, the HRTEM and SAED results confirm the reappearance of Bi phase (Figs. 4h and i). Collectively, the TEM results, combined with ex-situ XRD studies, demonstrate the superior reversibility of the GC-Bi anode during the discharging-charging process, adhering to the two-step alloying-dealloying reaction proposed in the previously reported Bi-based electrodes [54].
Figure 4
Figure 4.
Characterizations of phase and structural evolution of the GC-Bi anode. (a) GCD curves of the GC-Bi anode at the 2nd cycle. (b) Ex-situ XRD patterns of the GC-Bi electrode at various potential states. (c) Schematic illustration of the phase reaction mechanism of Bi. Ex-situ TEM images, HRTEM images, and SAED patterns of the GC-Bi electrode when (d-f) discharged to 0.01 V and (g-i) charged back to 3.0 V in the initial cycle.
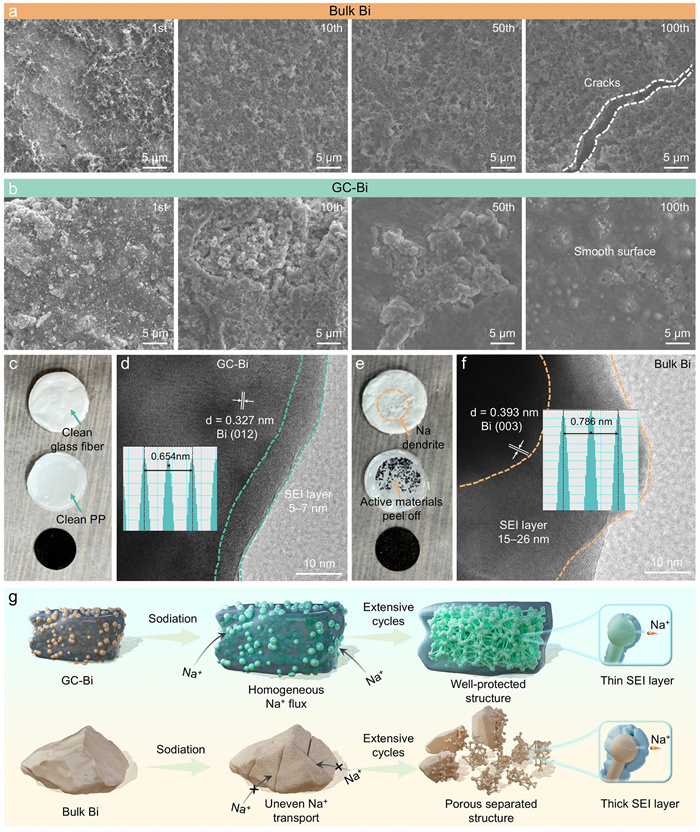
The structural stability of electrode materials is intimately related to the cycling performance of cells. This study investigates the morphological evolution of GC-Bi and bulk Bi electrodes after various cycle numbers using SEM analysis. For bulk Bi electrode, the surface progressively transforms into a porotic networking structure with microcracks exceeding 20 µm, leading to rapid capacity fading (Fig. 5a). In contrast, the GC-Bi electrode features refined Bi particles fully encapsulated by the external carbon skeleton, resulting in a flat and smooth surface without visible cracks (Fig. 5b). Disassembling of the Na//GC-Bi and Na//bulk Bi cells after 100 cycles reveals that the polypropylene (PP) separator near the electrode and glass fiber membrane near the Na metal side from the Na//GC-Bi cell remain clean and free of impurities. Moreover, the GC-Bi electrode keeps good integrity, as the GC-Bi active materials remain tightly attached on the Cu current collector without any exfoliation. Furthermore, the electrode shows a minor variation in thickness (increasing from 9.4 µm to 11.97 µm), corresponding to mere 27.3% volume swelling ratio, which is advantageous for maintaining stable cycling performance (Fig. S16 in Supporting information). Conversely, the pure bulk Bi experiences significant volume swelling of without a buffer during cycling, causing some active materials to exfoliate from the current collector, leading to poor electric contact and fast capacity degradation. On the Na-metal counter electrode side, Na dendrites visibly pierce the glass fiber membrane. After 100 cycles, HRTEM images show a thin and uniform SEI layer, 5‒7 nm thick, on the GC-Bi surface, whereas bulk Bi exhibits stress concentration, resulting in a thicker and uneven SEI layer, 15‒28 nm thick (Figs. 5c-f). This stable electrode structure with a thin SEI on the GC-Bi surface enhances cycling longevity. The morphological evolution of bulk Bi and GC-Bi electrodes is schematically summarized in Fig. 5g. The bulk Bi electrode undergoes a huge volume change after a certain number of cycles, leading to active material exfoliation and large cracks, with repeated interface reconstruction forming a thick, inhomogeneous SEI layer, causing rapid capacity degradation and cell failure. However, in the GC-Bi electrode, the interior Bi particles gradually loosen and the refined, interconnected porous Bi remains well-encapsulated within the surrounding carbon skeleton after continuous cycles, contributing to a smooth electrode surface and a thin superficial SEI film.
Figure 5
Figure 5.
Top-view SEM images of (a) bulk Bi and (b) GC-Bi electrodes after 1, 10, 50, and 100 cycles. (c) Optical photographs of glass fiber membrane (top), PP separator (middle), and GC-Bi electrode (bottom) by disassembling the Na//GC-Bi cell after 100 cycles. (d) TEM image of the GC-Bi power scraped from the electrode of (c). (e) Optical photographs of glass fiber membrane (top), PP separator (middle), and bulk Bi electrode (bottom) by disassembling the Na//bulk Bi cell after 100 cycles. (f) TEM image of the bulk Bi power scraped from the electrode of (e). (g) Schematic structural evolution of the GC-Bi and bulk Bi active materials during cycling.
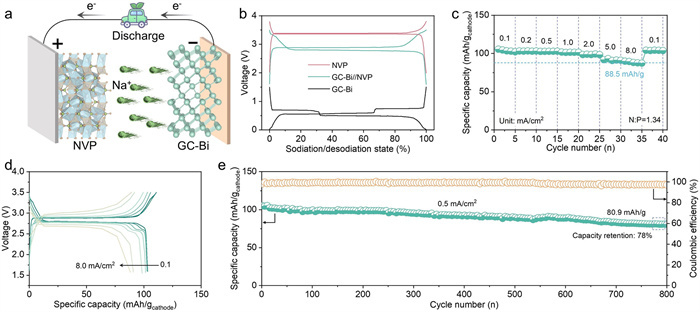
Prompted by the excellent electrode stability and electrochemical performance of the GC-Bi anode, the practical feasibility of GC-Bi in a full cell system was evaluated by pairing it with the commercial NVP cathode, which has been widely used as a SIB cathode material due to its remarkable cycling stability and rapid Na-ion diffusion (Fig. 6a). In NVP half cells, the NVP delivers a stable and high voltage plateau of approximately 3.4 V and maintains a capacity of 98.4 mAh/g after 200 cycles, demonstrating good cycling stability. Besides, a reversible capacity of 91.6 mAh/g is achieved at a current density of 5.0 mA/cm2 (Fig. S17 in Supporting information). The GCD curves of voltage vs. charge of state for GC-Bi anode and NVP cathode indicate a high output voltage of ~2.8 V for the GC-Bi//NVP full cell, with the GCD curves showing good overlap after the initial cycle (Fig. 6b and Fig. S18 in Supporting information). This constructed full cell demonstrates excellent high-rate capacities of 104.5, 103.3, 102.8, 101.5, 98.5, 91.3, and 88.5 mAh/g at 0.1, 0.2, 0.5, 1.0, 2.0, 5.0 and 8.0 mA/cm2, respectively, with a negative/positive capacity ratio (N/P ratio) of 1.34, based on the mass of NVP cathode (Fig. 6c). Moreover, the assembled GC-Bi//NVP configuration delivers a high energy density of 203.8 Wh/kg at a power density of 37.7 W/kg, and an energy density of 160.3 Wh/kg can be maintained even at a high power density of 2671.6 W/kg (Fig. S19 in Supporting information). Furthermore, the GC-Bi//NVP full-cell exhibits admirable cycling capability, retaining 78% of its initial capacity at 0.5 mA/cm2 after 800 cycles (Fig. 6e). It can be found that the GC-Bi electrode exhibits relatively good cycling performance in both half and full cells (Table S7 in Supporting information). These results indicate that the GC-Bi anode holds good potential for practical applications.
Figure 6
Figure 6.
Electrochemical performance of the assembled GC-Bi//NVP full cell. (a) Schematic diagram of the full cell configuration. (b) Typical GCD curves of the NVP cathode, GC-Bi anode, and GC-Bi//NVP full cell. (c) Rate performance and (d) GCD curves at different areal current densities from 0.1 mA/cm2 to 8.0 mA/cm2. (e) Long-cycling performance at 0.5 mA/cm2.
In summary, we have successfully established a particle-nested-bulk GC-Bi anode through a scalable and cost-effective precipitation-carbonization method, demonstrating its potential for efficient and durable sodium storage. Glucose-derived bulk carbon skeleton effectively preserves the entire structural integrity by delocalizing mechanical stress of Bi and building a thin SEI layer on the electrode surface. Consequently, the GC-Bi composite provides an extremely high-rate capability of 56% capacity retention at 80 A/g with respect to 0.1 A/g. Besides, the GC-Bi electrode can maintain a reversible capacity of 337.2 mAh/g at 5.0 A/g after 5000 cycles with a tiny capacity attenuation rate of 0.073‱ per cycle. Moreover, the assembled GC-Bi//NVP full cell also achieves 78% capacity retention over 800 cycles. Considering the low cost of the raw materials, scalable production, and high tap density (3.33 g/cm3), the GC-Bi composite can be an ideal anode material for stationary SIBs in limited space.
Declaration of competing interest
The authors declare that they have no known competing financial interestsor personal relationships that could have appeared to influence the work reported in this paper.
The authors acknowledge financial support from the National Natural Science Foundation of China (Nos. 21878192, 51904193, and 52302085), the Science and Technology Cooperation Special Fund of Sichuan University and Zigong City (No. 2023CDZG-5), and the Frontier Project of Chengdu Tianfu New Area Institute (SWUST, No 39200005). The authors also appreciate Dr. Can Liu from the Lab Center of the College of Materials Science and Engineering in Sichuan University for the help in XRD measurements.
Supplementary materials
Supplementary material associated with this article can be found, in the online version, at doi:10.1016/j.cclet.2024.110792.
H. Qian, Y. Liu, H. Chen, et al., Energy Storagy Mater. 58 (2023) 232–270. doi: 10.1016/j.ensm.2023.03.023
Figure 1
Morphological structure characterizations of GC-Bi composite. (a) Schematic illustration of the synthesis process of GC-Bi composite. (b) SEM image and XRD pattern. (c) A zoom-in SEM image of (b). (d, e) TEM images. (f) HR-TEM image. (g) SAED pattern. (h) STEM-EDS mappings. (i) N2 adsorption-desorption isotherms and pore size distribution. (j) Bi 4f high-resolution XPS spectrum.
Figure 2
Electrochemical performance characterizations of the GC-Bi composite for SIBs. (a) CV curves at a scan rate of 0.1 mV/s between 0.01 V and 1.5 V. (b) Initial three cycles GCD curves at 0.1 A/g. (c) Cycling performance at 1.0 A/g. (d) Rate performance of GC-Bi composite and bulk Bi. (e) GCD profiles of GC-Bi anode at the current densities varying from 0.1 A/g to 80 A/g. (f) Rate capability comparison with previously reported Bi-based anodes for SIBs. (g) Long-term cycling performance at 5.0 A/g. (h) Nyquist plots after different charge-discharge cycles (the inset shows the equivalent circuit model used to fit the obtained EIS spectra, where Rs, Rct, CPE, and Wo represent interfacial layer impedance, charge transfer impedance, constant-phase element, and Warburg solid-state diffusion resistance, respectively).
Figure 3
Na+ ions diffusion kinetics analysis. (a) Multi-CV curves of the GC-Bi anode at different scan rates of 0.1, 0.2, 0.5, 1.0, and 2.0 mV/s. (b) Relationship between the peak currents and scan rates in logarithmic format of the GC-Bi. (c) Peak current vs. v1/2 plots and corresponding linear fitting results of GC-Bi and bulk Bi electrodes. GITT curves of the (d) GC-Bi and (e) bulk Bi electrodes under the current density of 0.1 A/g, in which the cells were alternatively discharged/charged for a duration of 10 min and allowed to stand for 60 min. The calculated Na+ ions diffusion coefficient of (f) GC-Bi and (g) bulk Bi electrodes. In-situ EIS of (h) GC-Bi and (i) bulk Bi electrodes during the initial discharge-charge process. The evolution of (j) Rs and (k) Rct for GC-Bi and bulk Bi electrodes.
Figure 4
Characterizations of phase and structural evolution of the GC-Bi anode. (a) GCD curves of the GC-Bi anode at the 2nd cycle. (b) Ex-situ XRD patterns of the GC-Bi electrode at various potential states. (c) Schematic illustration of the phase reaction mechanism of Bi. Ex-situ TEM images, HRTEM images, and SAED patterns of the GC-Bi electrode when (d-f) discharged to 0.01 V and (g-i) charged back to 3.0 V in the initial cycle.
Figure 5
Top-view SEM images of (a) bulk Bi and (b) GC-Bi electrodes after 1, 10, 50, and 100 cycles. (c) Optical photographs of glass fiber membrane (top), PP separator (middle), and GC-Bi electrode (bottom) by disassembling the Na//GC-Bi cell after 100 cycles. (d) TEM image of the GC-Bi power scraped from the electrode of (c). (e) Optical photographs of glass fiber membrane (top), PP separator (middle), and bulk Bi electrode (bottom) by disassembling the Na//bulk Bi cell after 100 cycles. (f) TEM image of the bulk Bi power scraped from the electrode of (e). (g) Schematic structural evolution of the GC-Bi and bulk Bi active materials during cycling.
Figure 6
Electrochemical performance of the assembled GC-Bi//NVP full cell. (a) Schematic diagram of the full cell configuration. (b) Typical GCD curves of the NVP cathode, GC-Bi anode, and GC-Bi//NVP full cell. (c) Rate performance and (d) GCD curves at different areal current densities from 0.1 mA/cm2 to 8.0 mA/cm2. (e) Long-cycling performance at 0.5 mA/cm2.

 DownLoad:

 下载:
下载:


 下载:
下载:
