Department of Biotherapy, Cancer Center and State Key Laboratory of Biotherapy, West China Hospital, Sichuan University, Chengdu 610041, China
* Corresponding author. E-mail address: anderson-qian@163.com (Z. Qian). 1 These authors contributed equally to this work.
Received Date:
22 October 2024 Accepted Date:
04 December 2024 Revised Date:
01 December 2024 Available Online:
15 September 2025
Abstract:
The androgenetic alopecia (AGA) is the most prevalent clinical manifestation of hair loss, believed to be associated with excessive dihydrotestosterone (DHT) caused by type Ⅱ 5α-reductase (5αR2). The utilization of oral finasteride (FNS), which selectively inhibits 5αR2, is frequently constrained by its adverse effects. Topical FNS formulations can mitigate adverse effects but often exhibit limited dermal permeability. Nanocarriers show great potential in augmenting the cutaneous permeation of loaded FNS due to their inherent properties of selective accumulation within the hair follicles (HFs). In this study, hollow mesoporous silica nanoparticles (HMSN) with varying sizes were utilized as the nanocarriers for FNS, following mixing with the Carbopol hydrogel (F@H/Gel) for direct topical application. Specifically, the influence of size on the targeted delivery of FNS to HFs, and its enhanced therapeutic efficacy for the AGA mice model was evaluated. Results showed that the HMSN, with a diameter of approximately 300 nm, exhibited significant enhancement in FNS retention within skin and HFs, as well as remarkably accelerated hair regrowth on an AGA mouse model. In conclusion, this FNS topical formulation has proved to be a viable approach in offering a secure and efficient treatment modality for AGA.
Androgenetic alopecia (AGA), also known as male or female pattern hair loss, is the most common type of alopecia which affects approximately 80% of men and 50% of women worldwide with a heritable, androgen, and age dependence [1,2]. Although AGA is not life-threatening, it can significantly exacerbate patients' psychological distress and detrimentally impact their occupational performance, daily functioning, and social interactions due to the pivotal role that hair plays in shaping one's body appearance, which lowers their quality of life [3]. Despite the high prevalence of AGA, effectively managing and treating the condition remains challenging as it arises from a complex interplay of genetic, hormonal, and environmental factors [4,5]. The main mechanism of AGA is believed to be the overexpression of type Ⅱ 5α-reductase (5αR2) which converts testosterone into dihydrotestosterone (DHT) in the hair follicles (HFs). DHT can shorten the anagen phase of hair growth and prolong the telogen phase through binding to the androgenic receptor, leading to follicular miniaturization and ultimately resulting in hair thinning and loss [6,7]. Various treatments based on 5αR2 inhibition have been developed over the years [8,9]. But only oral finasteride (FNS), a 5αR2 selective inhibitor, is approved by the US Food and Drug Administration (FDA) for AGA treatment, which effectively reduces DHT concentration both in the scalp and serum by inhibiting testosterone conversion [10]. However, oral FNS with long-term daily use may elicit adverse effects on androgen-dependent organs such as the epididymis and prostate, thereby precipitating erectile dysfunction, diminished fertility, ejaculation disorders [11], ultimately culminating in suboptimal patient adherence.
Conversely, topical FNS applications have been developed to address these drawbacks of oral administration [12,13]. This topical delivery approach offers a convenient and non-invasive way for administering FNS directly to the skin which specifically reduces DHT locally within the HFs, thereby enhancing compliance and minimizing systemic adverse effects [14,15]. However, the dense arrangement of the outermost skin layer known as the stratum corneum (SC) significantly impedes drug penetration into the skin [16] and the mechanisms that drugs permeate the SC contain complex intercellular, transcellular, and follicular pathways [17], thereby constraining the efficacy and applicability of dermal drug delivery. In recent years, various techniques have been employed to enhance the transdermal permeability of FNS, including iontophoresis, ultrasound, electroporation, microneedles, and nanocarriers [18-21]. Among these methods, nanocarriers are recognized for their ability to facilitate drug penetration into the skin via the follicular route and enhance preferential accumulation of FNS in the HF region [22-26]. Moreover, the ability of nanocarriers with varying sizes to penetrate HFs differs. Hollow mesoporous silica nanoparticles (HMSN) with a distinctive hollow structure and a significantly large specific surface area possess easily modifiable size and exceptional biocompatibility, making them an optimal and ideal drug carrier for the treatment of various diseases in numerous studies [27-30]. As a result, HMSN was chosen as the nanocarrier for FNS in this study. However, HMSN suspensions are not convenient for direct use on the skin due to their low viscosity. Recent studies have demonstrated that combining nanoparticles with an adhesive and biocompatible hydrogel may offer an easy option for topical application [31-33]. As Carbopol hydrogel has been approved for pharmaceutical use for many years and the cutaneous use is clinically acceptable given its long residue time at the administration site, this commercially available hydrogel was further combined with HMSN for transdermal delivery of FNS.
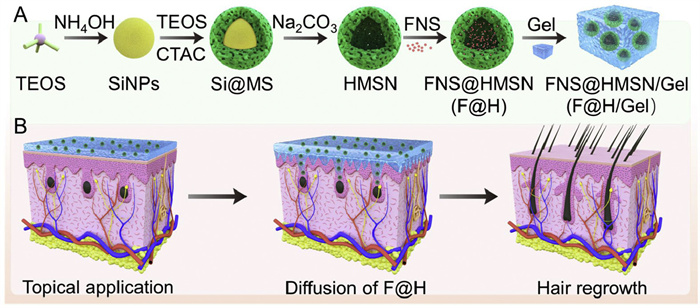
Herein, we designed a bioactive nanoparticles hydrogel system named F@H/Gel for direct topical application on the skin surface (Scheme 1). Initially, HMSN with diameters ranging from approximately 200–600 nm were synthesized, followed by loading FNS into these HMSN and mixing with the Carbopol hydrogel to obtain the final F@H/Gel formulation. In vitro permeation studies and differential stripping techniques were conducted to validate the enhanced effect of different sizes of HMSN on FNS accumulation in HFs. Additionally, the penetration process of HMSN and loaded drugs in the skin, as well as their accumulation behavior in HFs, was investigated using two distinct fluorescent dyes. The beneficial effects of HMSN loaded with FNS on hair regrowth and hair follicle cycle regulation in AGA model mice were assessed through hair coverage analysis and histopathological examination.
Figure 1
Figure 1.
Schematic illustration of the preparation of the nanoparticles hydrogel system FNS@HMSN/Gel (F@H/Gel) and its topical application for improving hair follicle accumulation and promoting hair regrowth in the AGA mice model.
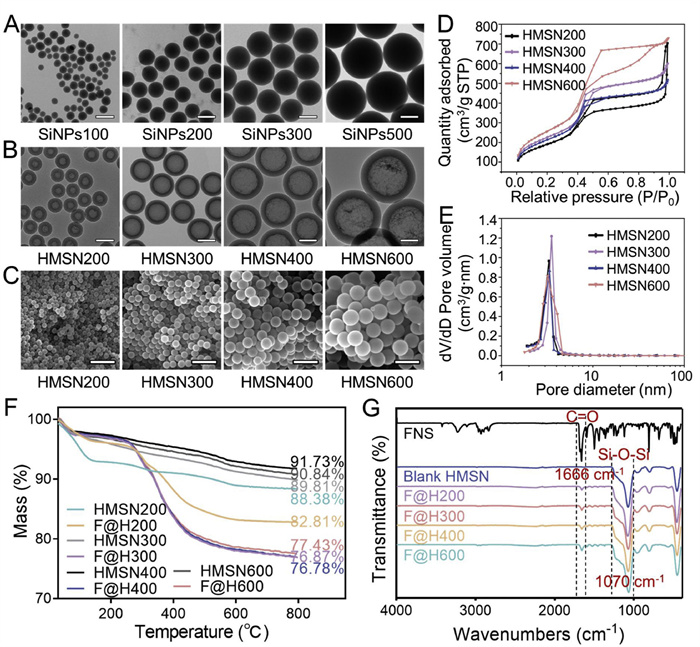
First of all, Si nanoparticles (SiNPs) with diameters ranging from approximately 100 nm to 500 nm were synthesized according to the modified Stöber method through precise adjustment of the volumes of the Si precursor TEOS and aqueous ammonia (Table S1 in Supporting information). According to dynamic light scattering (DLS) analysis, SiNPs100, SiNPs200, SiNPs300, and SiNPs500 exhibited diameters of 98.7 ± 0.4, 203.1 ± 1.0, 312.0 ± 6.6, and 539.6 ± 8.7 nm, respectively (Fig. S1A in Supporting information). As shown in Fig. 1A, these transmission electron microscope (TEM) images revealed that these SiNPs displayed a uniform distribution and possessed a solid, spherical morphology. Upon further increasing the quantity of aqueous ammonia, SiNPs with a larger diameter of 680 and 750 nm were obtained (Figs. S2A and B in Supporting information). The SiNPs100, SiNPs200, SiNPs300, and SiNPs500 were sequentially coated with mesoporous silica (Table S2 in Supporting information) and subjected to etching processes to obtain HMSN200, HMSN300, HMSN400, and HMSN600. The hydrodynamic diameter distributions of these HMSN were determined to be 213.5 ± 11.3, 315.8 ± 4.0, 430.5 ± 4.6, and 656.8 ± 13.9 nm using DLS (Fig. S1B in Supporting information). The monodispersed HMSN with a spherical shape were observed to possess mesoporous shells and hollow cores, as confirmed by TEM and scanning electron microscope (SEM) morphology analysis (Figs. 1B and C), and the etching process did not break the mesoporous shells (Fig. S3 in Supporting information). The thickness and other parameters obtained from the TEM image are presented in Table S3 (Supporting information). The hydrodynamic diameters measured by DLS were slightly higher than the results obtained from TEM, attributed to the influence of dispersants on particle size determination [34]. We also synthesized HMSN with a core size of approximately 200 nm and a thicker shell (around 70 and 90 nm) (Figs. S2C and D in Supporting information) by reducing the SiNPs200 concentration during the synthesis process of Si@MS.
Figure 1
Figure 1.
Characterization of SiNPs, HMSN, and FNS-loaded HMSN (F@H). (A, B) TEM images of SiNPs and HMSN. Scale bar: 200 nm. (C) SEM images of HMSN. Scale bar: 1 µm. (D, E) Nitrogen adsorption−desorption isotherm and pore size distribution of HMSN. (F, G) TGA curves and FT-IR spectra of HMSN and F@H.
The nitrogen adsorption-desorption isotherm of HMSN, as determined by the Brunner–Emmet–Teller (BET) method, is presented in Fig. 1D. Due to the presence of a typical mesoporous structure, all four sizes of HMSN exhibited characteristic Langmuir Ⅳ isotherm with type H4 hysteresis loops. The BET surface areas of HMSN200, HMSN300, HMSN400, and HMSN600 were measured to be 683.3, 811.8, 771.0, and 930.6 m2/g, respectively. The pore size of all HMSN was determined to be approximately 3.5 nm, as depicted in Fig. 1E, by analyzing the adsorption branch of the isotherm using the BJH method. This uniformity can be attributed to the consistent utilization of a structure-directing agent (CTAC) during the synthesis process.
Then the FNS was loaded into the prepared HMSN to obtain FNS@HMSN (F@H). The DLS analysis (Fig. S1C in Supporting information) and TEM (Fig. S4 in Supporting information) images of F@H revealed that the size distribution and morphology of HMSN exhibit negligible changes upon FNS loading. Due to silicon's superior thermal stability compared to FNS, the determination of drug loading content (DLC) can be achieved by analyzing the mass discrepancy between HMSN and F@H at 800 ℃. As shown in Fig. 1F, the thermogravimetry analysis (TGA) data unequivocally demonstrates that the DLC for F@H200, F@H300, F@H400, and F@H600 are determined to be 5.57%, 12.94%, 14.95%, and 13.41%, correspondingly. The drug encapsulation capacity of HMSN increases as the particle size expands from 200 nm to 400 nm, attributed to an expansion in both hollow core space and shell thickness. However, further enlargement of particle size leads to a slight decrease in drug loading, possibly due to the reduced number of NPs. The Fourier-transform infrared (FT-IR) spectrum, shown in Fig. 1G, was employed to further substantiate the integration of FNS into HMSN. The prominent peaks detected at 1070 cm−1 in both HMSN and F@H spectra were ascribed to the asymmetric stretching vibrations of Si–O–Si bonds, whereas the bands observed at 1666 cm−1 in F@H were designated as C=O stretching vibration of FNS. According to the obtained outcomes, it is deemed that the preparation of F@H was accomplished with success.
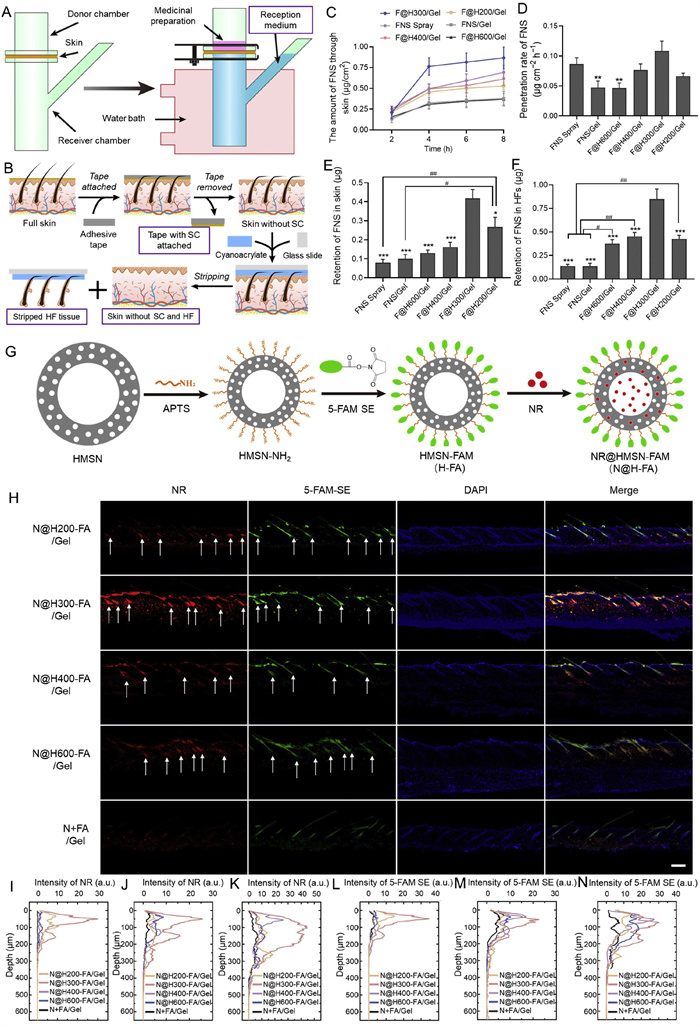
Next, the nanoparticles hydrogel composite F@H/Gel was prepared. As shown in Fig. S5 (Supporting information), the adhesive properties of the composite comprising F@H and hydrogel remained when compared to the blank gel thereby enabling localized administration. Then the in vitro skin permeation of various FNS formulations was conducted using Franz diffusion cell system according to the procedure illustrated in Figs. 2A and B, with the region enclosed by the purple wireframe being collected for quantifying FNS content. The cumulative amount and rate of FNS penetration from different formulations after 8 h of in vitro permeation through mouse dorsal skin are presented in Figs. 2C and D, respectively. All animal experiments and procedures adhered to institutional guidelines on animal welfare and were approved by the Institutional Laboratory Animal Care and Use Committee of Sichuan University (permit No. 20240307040). When loaded in HMSN, there was no significant enhancement observed in the ability to penetrate through the skin of FNS. Only the F@H300/Gel group exhibited a significantly higher penetration (0.11 ± 0.04 µg cm−2 h−1) compared to the FNS/Gel group. Due to its higher drug concentration, FNS spray (2.275 mg/mL) exhibits marginally elevated skin penetration data compared to FNS/Gel (0.1%, w/w). The skin retention (0.42 ± 0.11 µg) and HF accumulation (0.85 ± 0.26 µg) of FNS were significantly enhanced by F@H300/Gel than other groups, exhibiting increases of 5.2 and 6.2 times compared to commercially available FNS spray, respectively (Figs. 2E and F). Additionally, the preferential accumulation of NPs in HFs also resulted in higher concentrations of FNS delivered to HFs in groups F@H200/Gel, F@H400/Gel, and F@H600/Gel compared to groups FNS spray and FNS/Gel. When the particle size exceeds 300 nm, larger sizes do not enhance skin permeation, as evidenced by the lack of a significant increase in skin retention in F@H400/Gel and F@H600/Gel. The skin retention and follicular accumulation of F@H200/Gel are both higher than those of groups FNS spray and FNS/Gel; however, they remain significantly lower compared to the group F@H300/Gel, potentially attributed to a reduced drug loading. Specifically, to ensure consistent FNS content, a higher quantity of HMSN200 was incorporated into F@H200/Gel; however, despite the potential influx of smaller-sized HMSN into the skin in equal or relatively larger amounts, their ability to deliver FNS within the skin is constrained. The concentration of FNS in the sample from SC is below the limit of detection. To summarize, HMSN exhibited a greater enhancement effect on the HF accumulation and skin retention of FNS rather than its penetration, particularly when utilizing HMSN300 which demonstrated the highest enhancement efficacy.
Figure 2
Figure 2.In vitro skin permeability evaluation. (A) Schematic representation of the Franz diffusion cell system for assessing skin permeability. (B) Schematic illustration of the differential stripping techniques. (C) The cumulative amount of FNS through the skin over time. (D) Skin penetration rate of FNS in various formulations. (E, F) Distribution of FNS in the skin and HFs. P < 0.05, **P < 0.01, ***P < 0.001 vs. F@H300/Gel group; #P < 0.05, ##P < 0.01. The data were presented as the mean ± standard error of the mean (n = 6). (G) Illustration depictions of the preparation process of NR@HMSN-FAM (N@H-FA). (H) Fluorescent images of skin tissue section throughout 4 h permeation of NR and 5-FAM SE hydrogel composite. Scale bar: 200 µm (red: NR, green: 5-FAM SE, blue: 4′,6-diamidino-2-phenylindole (DAPI)). (I–K) Depth profiles illustrating the transdermal permeation of NR across the skin at 1, 2 and 4 h after administration (n = 5 viewing fields). (L–N) Depth profiles illustrating the transdermal permeation of 5-FAM SE across the skin at 1, 2 and 4 h after administration (n = 5 viewing fields).
To visualize the permeation process of HMSN and loaded drugs in the skin respectively, the florescent dye 5-carboxyfluorescein succinimidyl ester (5-FAM SE) was chemically conjugated to HMSN, while the other dye Nile red (NR) was directly encapsulated within HMSN to obtain the formulation N@H-FA. The procedure for preparing fluorescent-labeled HMSN is illustrated in Fig. 2G. Firstly, HMSN—NH2 was synthesized through the modification of HMSN with APTS. The 5-FAM SE molecule was subsequently covalently attached to HMSN through the reaction between the succinimidyl ester and the amino group. Finally, NR was loaded into HMSN-FAM (H-FA) to obtain dual fluorescent-labeled HMSN (N@H-FA). The zeta potential changes of HMSN—NH2 (Fig. S6A in Supporting information), in comparison with HMSN, indicate the presence of abundant -NH2 groups on the surface exhibiting a strong positive charge. Furthermore, the successful preparation of H-FA and N@H-FA was demonstrated by the fluorescence spectra (Figs. S6B and C in Supporting information). Slight variations were observed in the quantities of grafted FAM and loaded NR with different sizes of HMSN, therefore, adjustments were made to the amounts of N@H-FA during hydrogel composite preparation to ensure an equal mass of fluorescence substance in each group.
Consequently, the fluorescence signals emitted by 5-FAM SE and NR on the cross-sections of skin slices can serve as indicators for monitoring the dermal delivery of HMSN and drugs, respectively. Fig. 2H, and Figs. S7 and S8 (Supporting information) illustrate the images of NR and 5-FAM SE-labeled HMSN hydrogel composites permeating the skin after 1, 2, and 4 h. The NR and 5-FAM SE, attached to HMSN, exhibited migration from the HFs opening in the SC towards deeper regions within the follicle (white arrows) over time, with NR also permeating into the surrounding areas. The quantitative analysis (Figs. S9A–D in Supporting information) demonstrates a positive correlation between the fluorescence intensity and area of NR and 5-FAM SE with the penetration time. Notably, the N@H-FA300/Gel group demonstrates superior permeation efficacy characterized by the highest fluorescence intensity and penetration areas. Due to the promoting effect of NPs, all HMSN-containing groups have more NR and 5-FAM SE that can penetrate the skin compared to hydrogels without HMSN (N+FA/Gel). Based on the depth profiles (Figs. 2I–K), it is evident that NR loaded in HMSN progressively migrated towards deeper layers of the skin over time, predominantly accumulating within the 0–250 µm range where a multitude of HFs are localized. Furthermore, the phenomenon of linked 5-FAM SE is distinct in that it exhibited limited propagation beyond a depth of 200 µm and remained confined within the HFs (Figs. 2L–N). The smaller-sized HMSN200 exhibited superior initial penetration efficiency compared to HMSN400 and HMSN600 at 1 h; however, this advantage diminished over time as the penetration efficiency gradually converged. Conversely, the N+FA/Gel group, which lacked the promotion and localization effect of HMSN, demonstrated minimal permeation of free NR and 5-FAM SE into the skin, distributing throughout the entire dermal layer or even extending beyond it. The results obtained above lead to the conclusion that HMSN can effectively penetrate from the follicle opening to deeper layers while carrying loaded drugs, ultimately settling at the bottom of the follicle. Subsequently, a gradual diffusion of the loaded drugs occurs within the surrounding tissue. Furthermore, HMSN300 exhibits the most pronounced efficacy in promoting and facilitating drug penetration into HFs, which aligns with the findings of the results of skin permeability in vitro.
Before the in vivo evaluations, the cytotoxic potential of diverse HMSN either with or without FNS loading was assessed in L929 cells and HaCaT cells using MTT assay. As depicted in Figs. S10A and B, the four varying sizes of HMSN exhibited no significant cytotoxicity within a concentration range of 10–1000 µg/mL, attributable to their superior biocompatibility. Furthermore, upon loading HMSN with FNS, the treated cells exhibited over 90% viability when exposed to the resulting complex (Figs. S10C and D in Supporting information). The pronounced biocompatibility of HMSN with skin cells suggests that it represents a secure vector for topical delivery to the cutaneous layer.
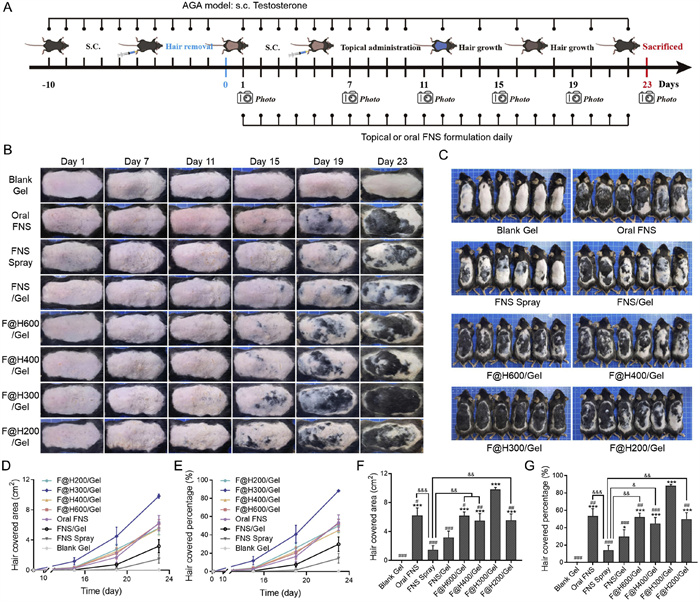
The testosterone-induced AGA mouse model was established to evaluate the hair regrowth-promoting effect of different FNS formulations, and the modeling and treatment regimens were executed as depicted in Fig. 3A. AGA Model animals induced by subcutaneous (s.c.) injection of testosterone showed no hair regrowth after 23 days of depilation, while the mice injected with normal saline regrew dense long hair on their back skin (Fig. S11A in Supporting information). The successful establishment of the AGA model was further supported by a significant reduction in the number of HFs observed in the Model group (Fig. S11B in Supporting information).
Figure 3
Figure 3.
Hair regrowth evaluation of AGA model. (A) Schematic representation of the establishment of an AGA mouse model and therapeutic strategies using various FNS formulations. (B) Representative photographs depicted the hair regrowth progression on the dorsal region of mice following 1, 7, 11, 15, 19, and 23 days of diverse treatments. (C) Images of the dorsal skin of mice following a 23-day therapeutic intervention. (D, E) Time profile of hair coverage area and its proportion. (F, G) Hair coverage area and the percentage in the mouse model following a 23-day treatment period (n = 6). P < 0.05, **P < 0.01, ***P < 0.001 vs. blank gel group; #P < 0.05, ##P < 0.01, ###P < 0.001 vs. F@H300/Gel group; &P < 0.05, &&P < 0.01, &&&P < 0.001. The data were presented as the mean ± standard error of the mean.
The representative images of dorsal skin in each group from day 1 to day 23 are depicted in Fig. 3B. On the 11th day following the treatment, skin pigmentation emerged in groups F@H200/Gel and F@H300/Gel, signifying the initiation of the anagen phase of HFs growth [35]. Afterward, with the extension of treatment time, hair started to grow on the skin within 15 days, and both pigmentation and hair growth areas exhibited gradual increments (Figs. 3D and E). On the 23rd day, the mice subjected to F@H300/Gel treatment exhibited nearly complete coverage of dark hair, whereas all other groups displayed only varying degrees of initial hair growth (Fig. 3C). The findings suggest that F@H300/Gel has the potential to expedite the initiation of the anagen phase and significantly enhance hair growth rate. After the experiment, hair regrowth was observed in all treatment groups except blank gel group, attributed to the inhibitory effect of FNS on the production of DHT. Among them, the F@H300/Gel group exhibited a hair coverage of approximately 88% on day 23, which was significantly higher compared to the other groups, as depicted in Figs. 3F and G. Otherwise, the hair growth rate in the FNS spray group exhibited a lower magnitude compared to both the oral FNS and all four F@H/Gel groups, owing to the enhanced systemic absorption of FNS spray through the skin rather than its localized retention within the dermis and HFs. Specifically, the hair growth areas of groups oral FNS, F@H200/Gel, F@H300/Gel, F@H400/Gel, and F@H600/Gel were respectively 4.17-, 3.72-, 6.56-, 5.34- and 4.13-fold larger than that of group FNS spray. Although FNS exhibits high bioavailability when administered orally [36], its efficacy in promoting hair regrowth in the AGA model was comparable to that of local application of F@H200/Gel, F@H400/Gel, and F@H600/Gel, and was further diminished compared to F@H300/Gel. This may be attributed to the potential of HMSN300 in effectively delivering FNS to both HFs and skin, thereby efficiently promoting hair regrowth in an AGA model.
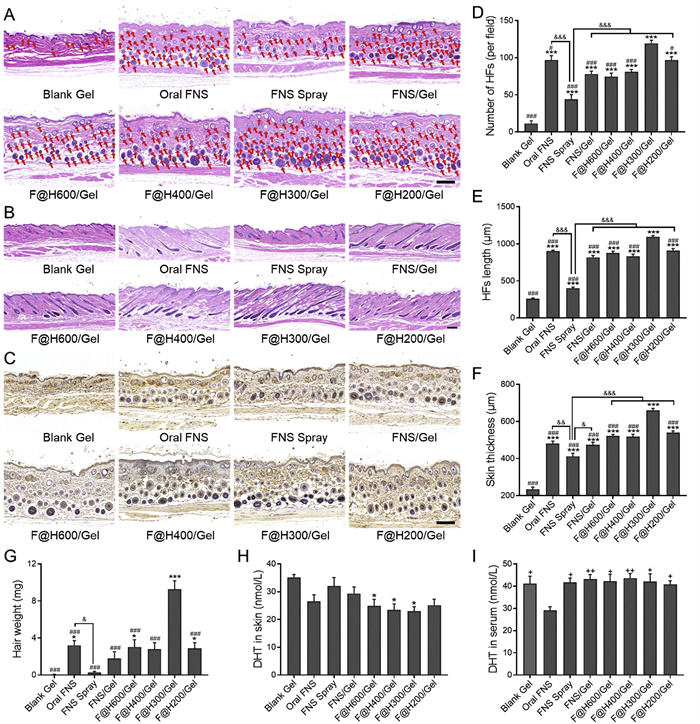
To further validate the impact of diverse FNS formulations on the AGA model, the transverse and longitudinal sections of skin samples were subjected to hematoxylin and eosin (H&E) staining for subsequent analysis (Figs. 4A and B), as previously documented in relevant literature [37,38]. The skin transverse section contains more HFs, providing an accurate representation of follicular growth density, as depicted in Fig. 4D. Moreover, Fig. 4E presents a quantitative analysis of the length of HFs from longitudinal sections. These findings demonstrated that F@H300/Gel exhibited a significantly notable augmentation in both hair follicle density and length. All distinct formulations of FNS exhibit a promoting effect on HF regeneration, with the stimulatory effect of FNS spray being significantly attenuated compared to other groups. Due to its exceptional promotion of HF regrowth, the model mice in the F@H300/Gel group exhibited robust hair regeneration on day 23, characterized by long and dense hair, which significantly surpassed that of other experimental groups in terms of regrowth hair weight (Fig. 4G). The high density of hair follicles in the anagen phase contributes to increased skin thickness [39]. Among all groups, the F@H300/Gel group exhibits significantly higher skin thickness (658 µm), while the blank group demonstrates atrophy and thinning of the skin (234 µm) (Fig. 4F). This finding was consistent with the observations presented in Figs. 4A and D. The involvement of β-catenin in the reproductive and differentiation processes of HFs stem cells [40] highlights its potential as an immunohistochemical marker for assessing treatment efficacy. The immunohistochemical staining of β-catenin in the cross-section of dorsal skin is depicted in Fig. 4C. The full skin section in the blank gel group exhibited no activity of β-catenin, while the expression levels of β-catenin were observed to be low in the hair bulbs of the oral FNS, FNS spray, and FNS/Gel groups. The expression of β-catenin is significantly upregulated in the HFs of mice treated with F@H200/Gel, F@H300/Gel, F@H400/Gel, and F@H600/Gel, potentially due to the ability of F@H/Gel to enhance activation of the Wnt/β-catenin signaling pathway in AGA models, thereby facilitating an increased number of HFs transitioning into the growth phase. The levels of DHT in the dorsal skin and serum were quantified using the enzyme-linked immunosorbent assay (ELISA) method, as depicted in Figs. 4H and I. The variation in DHT content among the skin samples from different experimental groups was not statistically significant, although F@H300/Gel, F@H400/Gel, and F@H600/Gel groups exhibit slightly lower levels compared to the blank gel group. This phenomenon may be attributed to the predominant localization of 5αR2 in hair follicles [41], limiting the conversion of testosterone in skin tissues with lower hair follicle density and consequently leading to a reduction in DHT levels. However, the presence of the system effect of FNS results in a significant decrease in the observed DHT content in oral FNS group compared to all other groups.
Figure 4
Figure 4.
Assessment of AGA treatment in vivo. (A, B) Representative H&E staining images of transverse and longitudinal skin section of regrow hair areas (solid red arrows indicate HFs). (C) Immunohistochemistry staining of β-catenin on treated skin. Scale bar: 200 µm. (D) Quantitative analysis of HFs numbers from (A) (n = 18 viewing fields). (E) Quantitative analysis of HFs length from (B) (n = 40 HFs). (F) Dorsal skin thickness of mice following treatment (n = 18). (G) Weight of regrow hair (n = 6). (H, I) Mouse DHT expression in skin and serum assessed using ELISA method. P < 0.05, **P < 0.01, ***P < 0.001 vs. blank gel group; #P < 0.05, ##P < 0.01, ###P < 0.001 vs. F@H300/Gel group;+P < 0.05, ++P < 0.01, +++P < 0.001 vs. oral FNS group; &P < 0.05, &&P < 0.01, &&&P < 0.001. The data were presented as the mean ± standard error of the mean.
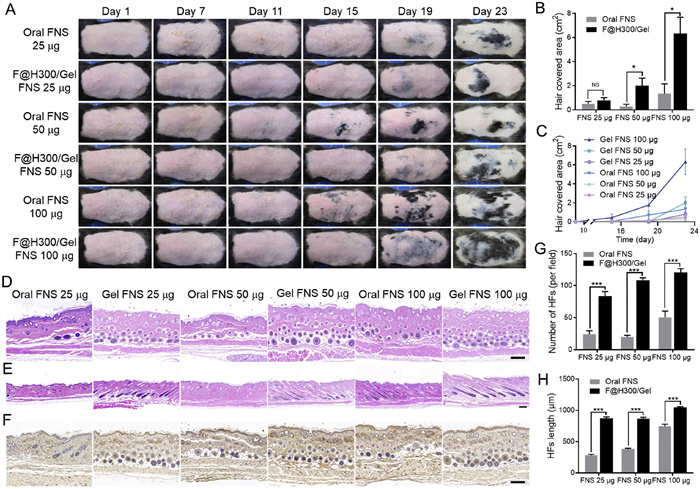
To further demonstrate the influence of FNS doses, the oral FNS suspension and F@H300/Gel with varying concentrations of FNS were conducted for AGA treatment. The dorsal skin images of model mice treated with different doses of oral FNS and F@H300/Gel are presented in Fig. 5A and Fig. S12A (Supporting information). As the drug concentration decreases, both the groups of oral FNS and F@H300/Gel exhibit a declining trend in hair growth area and velocity (Figs. 5B and C, Figs. S12B and C in Supporting information). For daily dosages of 50 and 100 µg, F@H300/Gel exhibited significantly superior efficacy in promoting hair regrowth compared to oral FNS. However, at a reduced dosage of 25 µg, there was no statistically significant disparity in hair cover between the two groups. This observation may be attributed to a decline in concentration leading to diminished permeation effectiveness. Pathological analysis of the hair regrowth area reveals that topical administration in gel form, when administered at 1 equiv. dosage, exerts a more pronounced effect on follicular induction into the anagen phase compared to oral administration (Figs. 5D and E). Consequently, this leads to a higher follicle count and increased follicle length (Figs. 5G and H). Similarly, the expression level of β-catenin and skin thickness in the three gel groups exhibited a significantly higher magnitude compared to that observed in the oral groups with equivalent FNS content (Fig. 5F and Fig. S12D in Supporting information). The systemic action of oral FNS results in a reduction in serum DHT concentration compared to the local application of F@H300/Gel (Fig. S12E in Supporting information). However, no significant differences in skin DHT levels were observed among the oral administration groups receiving different doses. The lack of variation observed may be attributed to the saturation effect of FNS, whereby any further increase in its high dosage does not yield additional benefits in terms of reducing DHT levels [42]. In general, the local application of F@H300/Gel is considered more favorable than the oral route for AGA therapy due to its superior promotion of hair follicle regeneration and avoidance of unnecessary systemic side effects.
Figure 5
Figure 5.
Assessment of AGA treatment efficacy with different doses of F@H300/Gel and oral FNS. (A) Representative dorsal skin photographs of mice following 1, 7, 11, 15, 19, and 23 days of diverse treatments. (B) Hair coverage area in the mouse model after different therapies on day 23. (C) Time profile of hair coverage area. (D–F) Representative H&E staining images of transverse and longitudinal skin section and immunohistochemistry staining of β-catenin of regrow hair areas. Scale bar: 200 µm. (G) Quantitative analysis of HFs numbers (n = 18 viewing fields). (H) Quantitative analysis of HFs length (n = 40 HFs). NS, not significant. P < 0.05, **P < 0.01, ***P < 0.001. The data were presented as the mean ± standard error of the mean.
In the present study, the HMSN of various sizes were initially prepared, followed by loading with FNS and subsequent combination with hydrogel to formulate a topical application for direct skin surface administration. The experimental findings demonstrated that larger sizes exhibit limited skin permeability, whereas smaller sizes may be constrained in their capacity for FNS delivery due to lower drug loading. Notably, the HMSN with a diameter of approximately 300 nm exhibits superior efficacy in augmenting the skin permeation and retention of FNS, particularly by effectively promoting accumulation within HFs. The drugs are initially delivered to the HFs with HMSN and subsequently released in a controlled manner, thereby exerting their therapeutic effects within the local vicinity. The hair regrowth achieved with F@H300/Gel in testosterone-induced AGA model mice was found to be superior compared to other gel composites or commercially available FNS spray, as demonstrated by its exceptional area coverage and density. Importantly, despite the higher oral bioavailability of FNS compared to local skin administration, its oral efficacy remains inferior to that of F@H300/Gel at equivalent dosages and is also associated with systemic adverse effects. In summary, F@H300/Gel composite offers a potential treatment option for AGA patients that is characterized by precise drug delivery, simplicity, efficiency, and the potential to reduce side effects.
Declaration of competing interest
The authors declare that they have no known competing financial interests or personal relationships that could have appeared to influence the work reported in this paper.
This study was funded by the National Natural Science Foundation of China Regional Innovation and Development Joint Fund (Sichuan) (No. U21A20417), and the National Natural Science Foundation of China (No. 31930067).
Supplementary materials
Supplementary material associated with this article can be found, in the online version, at doi:10.1016/j.cclet.2024.110723.
A. Vermeulen, V.A. Giagulli, P.D. Schepper, A. Buntinx, E. Stoner, Prostate 14 (1989) 45–53. doi: 10.1002/pros.2990140106
Figure 1
Schematic illustration of the preparation of the nanoparticles hydrogel system FNS@HMSN/Gel (F@H/Gel) and its topical application for improving hair follicle accumulation and promoting hair regrowth in the AGA mice model.
Figure 1
Characterization of SiNPs, HMSN, and FNS-loaded HMSN (F@H). (A, B) TEM images of SiNPs and HMSN. Scale bar: 200 nm. (C) SEM images of HMSN. Scale bar: 1 µm. (D, E) Nitrogen adsorption−desorption isotherm and pore size distribution of HMSN. (F, G) TGA curves and FT-IR spectra of HMSN and F@H.
Figure 2In vitro skin permeability evaluation. (A) Schematic representation of the Franz diffusion cell system for assessing skin permeability. (B) Schematic illustration of the differential stripping techniques. (C) The cumulative amount of FNS through the skin over time. (D) Skin penetration rate of FNS in various formulations. (E, F) Distribution of FNS in the skin and HFs. P < 0.05, **P < 0.01, ***P < 0.001 vs. F@H300/Gel group; #P < 0.05, ##P < 0.01. The data were presented as the mean ± standard error of the mean (n = 6). (G) Illustration depictions of the preparation process of NR@HMSN-FAM (N@H-FA). (H) Fluorescent images of skin tissue section throughout 4 h permeation of NR and 5-FAM SE hydrogel composite. Scale bar: 200 µm (red: NR, green: 5-FAM SE, blue: 4′,6-diamidino-2-phenylindole (DAPI)). (I–K) Depth profiles illustrating the transdermal permeation of NR across the skin at 1, 2 and 4 h after administration (n = 5 viewing fields). (L–N) Depth profiles illustrating the transdermal permeation of 5-FAM SE across the skin at 1, 2 and 4 h after administration (n = 5 viewing fields).
Figure 3
Hair regrowth evaluation of AGA model. (A) Schematic representation of the establishment of an AGA mouse model and therapeutic strategies using various FNS formulations. (B) Representative photographs depicted the hair regrowth progression on the dorsal region of mice following 1, 7, 11, 15, 19, and 23 days of diverse treatments. (C) Images of the dorsal skin of mice following a 23-day therapeutic intervention. (D, E) Time profile of hair coverage area and its proportion. (F, G) Hair coverage area and the percentage in the mouse model following a 23-day treatment period (n = 6). P < 0.05, **P < 0.01, ***P < 0.001 vs. blank gel group; #P < 0.05, ##P < 0.01, ###P < 0.001 vs. F@H300/Gel group; &P < 0.05, &&P < 0.01, &&&P < 0.001. The data were presented as the mean ± standard error of the mean.
Figure 4
Assessment of AGA treatment in vivo. (A, B) Representative H&E staining images of transverse and longitudinal skin section of regrow hair areas (solid red arrows indicate HFs). (C) Immunohistochemistry staining of β-catenin on treated skin. Scale bar: 200 µm. (D) Quantitative analysis of HFs numbers from (A) (n = 18 viewing fields). (E) Quantitative analysis of HFs length from (B) (n = 40 HFs). (F) Dorsal skin thickness of mice following treatment (n = 18). (G) Weight of regrow hair (n = 6). (H, I) Mouse DHT expression in skin and serum assessed using ELISA method. P < 0.05, **P < 0.01, ***P < 0.001 vs. blank gel group; #P < 0.05, ##P < 0.01, ###P < 0.001 vs. F@H300/Gel group;+P < 0.05, ++P < 0.01, +++P < 0.001 vs. oral FNS group; &P < 0.05, &&P < 0.01, &&&P < 0.001. The data were presented as the mean ± standard error of the mean.
Figure 5
Assessment of AGA treatment efficacy with different doses of F@H300/Gel and oral FNS. (A) Representative dorsal skin photographs of mice following 1, 7, 11, 15, 19, and 23 days of diverse treatments. (B) Hair coverage area in the mouse model after different therapies on day 23. (C) Time profile of hair coverage area. (D–F) Representative H&E staining images of transverse and longitudinal skin section and immunohistochemistry staining of β-catenin of regrow hair areas. Scale bar: 200 µm. (G) Quantitative analysis of HFs numbers (n = 18 viewing fields). (H) Quantitative analysis of HFs length (n = 40 HFs). NS, not significant. P < 0.05, **P < 0.01, ***P < 0.001. The data were presented as the mean ± standard error of the mean.

 DownLoad:

 下载:
下载:


 下载:
下载:
